. 2022 Oct 16;79(11):551.
doi: 10.1007/s00018-022-04591-w.

Fluid shear stress promotes periodontal ligament cells proliferation via p38-AMOT-YAP

Affiliations

Fluid shear stress promotes periodontal ligament cells proliferation via p38-AMOT-YAP

Qiusheng Shi et al. Cell Mol Life Sci. .

Abstract

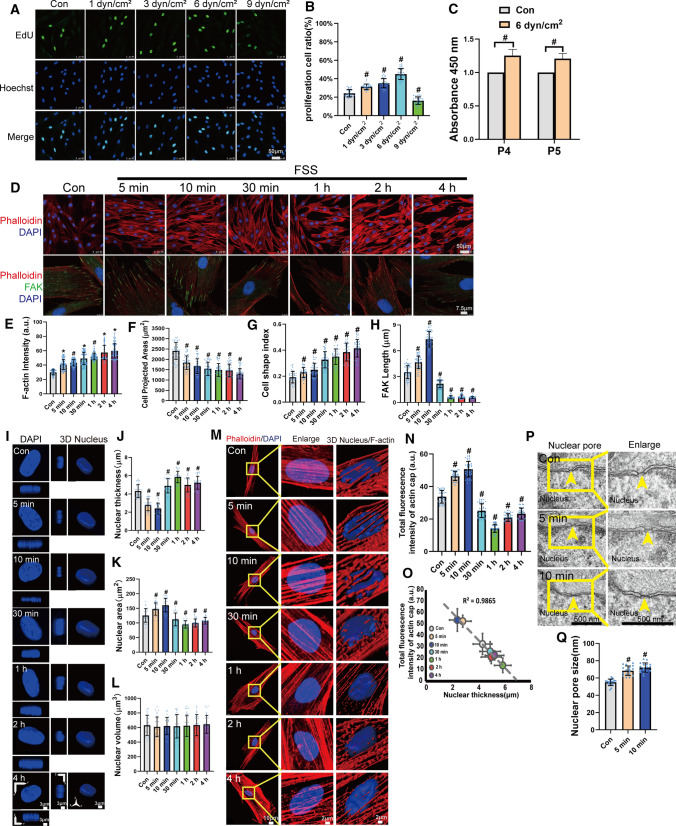
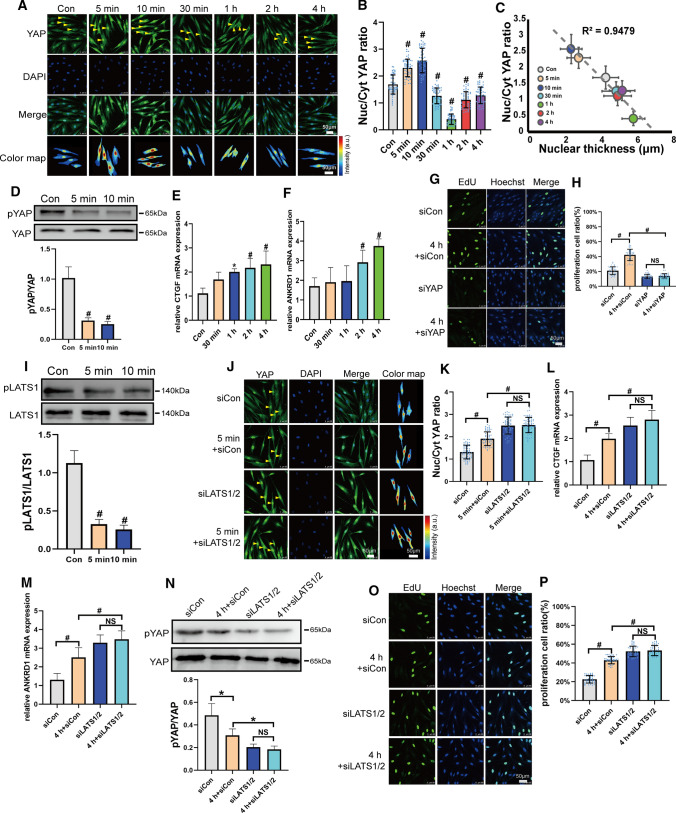
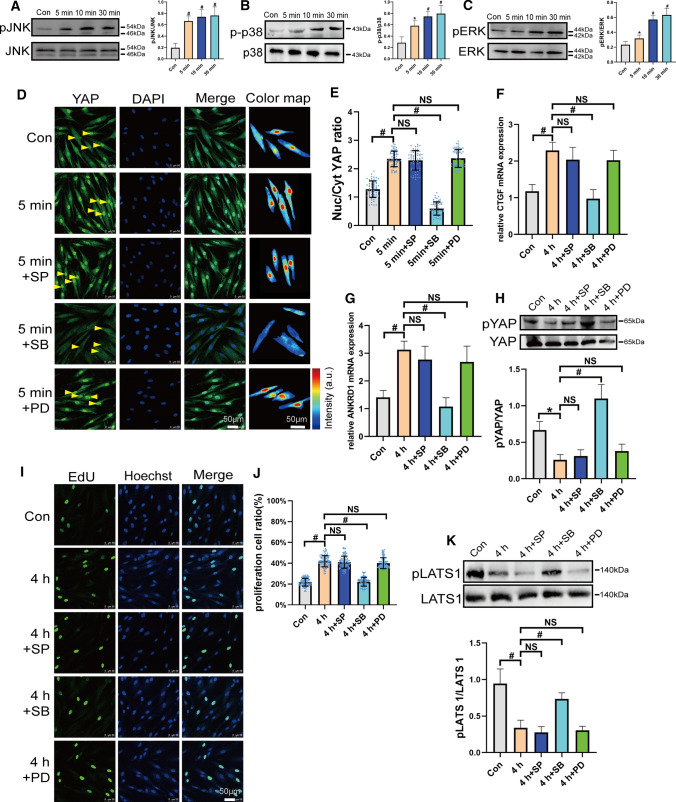
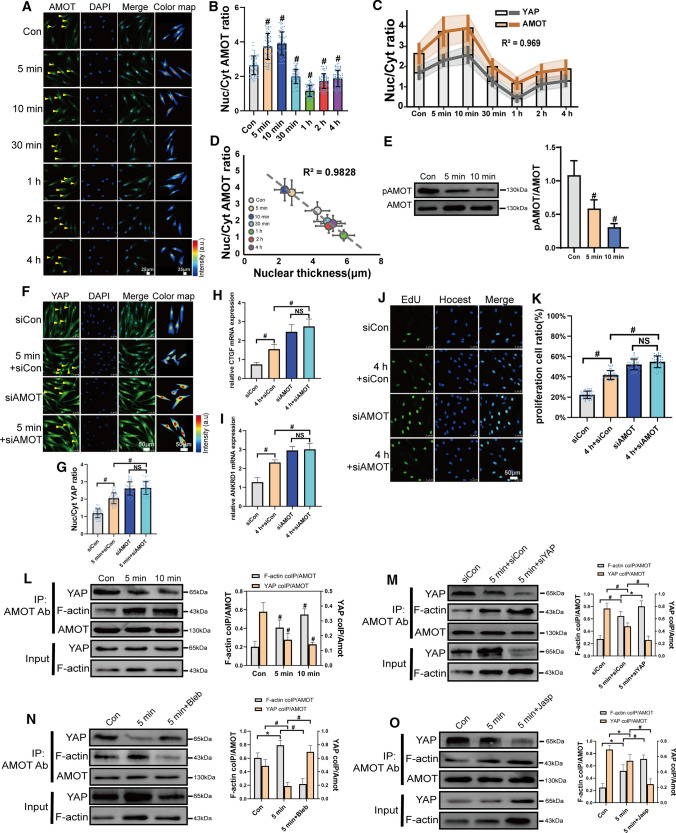
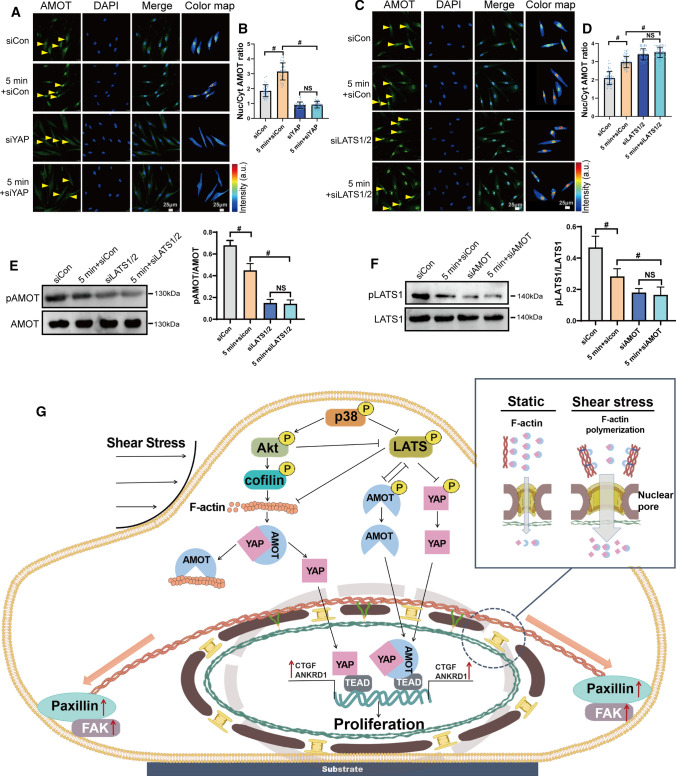
Periodontal ligament (PDL) cells are a promising tool for periodontal regeneration therapy. Achieving a sufficient number of PDL cells is essential to PDL regeneration. In our study, appropriate flow shear stress (FSS, 1-6 dyn/cm2) promotes the proliferation of PDL cells. FSS remodels cytoskeleton and focal adhesion in a duration-dependent manner. FSS induces PDL cells to form the actin cap within 10 min, flattens the nuclei, and increases the nuclear pore size, which promotes nuclear translocation of Yes-associated protein (YAP). FSS activates p38, which plays a dual function in YAP regulation. p38 regulates the phosphorylation of Akt and cofilin, as well as induced F-actin polymerization to induce YAP activity. In addition, p38 inhibits pLATS and consecutively regulates angiomotin (AMOT) and YAP phosphorylation. AMOT competitively binds to F-actin and YAP to participate in FSS-mediated YAP nuclear translocation and cell proliferation. Taken collectively, our results provide mechanistic insights into the role of p38-AMOT-YAP in FSS-mediated PDL cells proliferation and indicate potential applications in dental regenerative medicine.

Keywords: Biomechanics; LINC; Mechanotransduction; Nuclear changes; Nuclear-cytoplasmic translocation.


Conflict of interest statement

The authors declare that there are no conflicts of interest regarding the material discussed in the manuscript.

Figures

Fig. 1
Fig. 1
FSS promoted proliferation, rearranged the cytoskeleton, and changed the nuclear shape of PDL cells. A PDL Cells were subjected to 1 dyn/cm2, 3 dyn/cm2, 6 dyn/cm2, and 9 dyn/cm2 of FSS for 4 h. Cells cultured under static conditions served as the control. EdU-positive (green) cells and nuclei (blue) were imaged. Scale bars = 50 μm. B Quantification of the percentage of EdU-positive cells in each group. (n = 29, 29, 31, 30, 30 roi, respectively). C PDL cells were subjected to FSS for 4 h and cultured for two passages (P4 and P5). Cell viability was quantified and is represented as mean ± s.d. (n ≥ 3). D PDL cells subjected to FSS at 6 dyn/cm2 for 5 min, 10 min, 30 min, 1 h, 2 h, or 4 h were immunostained with rhodamine phalloidin (F-actin, red), FAK (green), and DAPI (blue). Quantification of cell density of F-actin (E) (n = 135, 135, 134, 135, 134, 134, 135 roi, respectively), cell projected areas (F) (n = 38, 35, 35, 44, 52, 45, 40 roi, respectively), cell shape index (CSI = 4π x area/perimeter2) (G) (n = 38, 26, 29, 31, 28, 26, 40 roi, respectively) in static or sheared PDL cells. H Quantification of FAK length (n = 47, 50, 50, 48, 50, 50 50 roi, respectively) in static or sheared PDL cells examined in (D). I PDL cells under static conditions or subjected to FSS at 6 dyn/cm2 for 5 min, 10 min, 30 min, 1 h, 2 h, or 4 h. Nuclear morphology of DAPI-stained nuclei (blue) indicates 3D nuclear shape, where maximum intensity projection onto the XY-plane was performed using upper hemispheres of the 3D reconstructed nuclei. The cross-sectional side view was captured along the XZ-plane and YZ-plane crossing the center of the nucleus. Scale bars = 3 μm. Nuclear thickness (J) and the projected nuclear area (K) onto the XY-plane was shown. The volume of the 3D reconstructed nuclei (L). (n = 29 roi per condition). M Actin cap was reorganized by FSS. Representative images of F-actin organization in the apical region of the nucleus were given. Scale bars = 10 μm. Yellow boxes indicate the regions that were shown as a magnified view. Scale bars = 2 μm. 3D rendering illustrate indicated the presence of the perinuclear actin cap. Scale bars = 2 μm. N Quantification of total fluorescence intensity of actin cap in static or sheared PDL cells (n = 39 roi per condition). O Total fluorescence intensity of actin cap versus nuclear thickness for the conditions in (N) and (J). The dashed line shows a linear fit to the data (R2, squared correlation coefficient). P TEM images of nuclear pores of PDL cells under static conditions or subjected to FSS for 5 min or 10 min. Yellow arrows indicated nuclear pores. Scale bars = 500 nm. Q Quantification of Nuclear pore size (n = 18 roi per condition nuclear pores from ≥ 10 cells per condition) in static or sheared PDL cells examined in (P). Bar represents mean ± s.d. *p < 0.05 and #p < 0.01; NS not significant
Fig. 2
Fig. 2
YAP involved in FSS-induced proliferation in PDL cells. A PDL cells under static conditions or after FSS at 6 dyn/cm2 for 5 min, 10 min, 30 min, 1 h, 2 h, or 4 h were fixed and immunostained with anti-YAP (green) antibody together with DAPI (blue). Yellow arrowheads of color maps showing YAP intensity for the conditions measured, respectively. Scale bars = 50 μm. B Quantification of nuclear relative to cytoplasmic fluorescent intensity of YAP in static or FSS. (n = 55 roi per condition). C Nuc/Cyt YAP ratio versus nuclear thickness for the conditions in (B) and Fig. 1J. The dashed line shows a linear fit to the data (R2, squared correlation coefficient). D Phosphorylated YAP on Ser127 expression on static or FSS (6 dyn/cm2, 5 min, 10 min) in PDL cells. pYAP/total YAP intensity ratio is shown on lower panel (n ≥ 3). E and F qPCR of CTGF (E) and ANKRD1 (F) gene expression under static conditions or FSS (n ≥ 3). G PDL Cells transfected with control siRNA or YAP siRNAs and subjected to FSS (6 dyn/cm2, 4 h). Representative image of EdU-positive cells in each group was given. Scale bars = 50 μm. H Quantification of the percentage of EdU-positive cells in each group was shown. (n = 41 roi per condition). I pLATS1 (Thr1079) expression of static or sheared (6 dyn/cm2, 5 min, 10 min) were detected by Western blotting and pLATS1/total LATS1 intensity were presented at lower panel (n ≥ 3). PDL Cells transfected with control siRNA or LATS1/2 siRNAs were subjected to FSS (6 dyn/cm2, 5 min) and YAP (green) localization (J), quantification of nuclear relative to cytoplasmic fluorescent intensity (K) (n = 65 roi per condition), CTGF (L), ANKRD1 (M) gene expression (n ≥ 3), pYAP expression (N) (n ≥ 3) and (O, P) EdU results (n = 42 roi per condition) were presented. Bar represents mean ± s.d. *p < 0.05 and #p < 0.01; NS not significant
Fig. 3
Fig. 3
p38 regulated FSS-induced cell proliferation by regulating LATS and YAP in PDL cells. AC 6 dyn/cm2 of FSS was loaded on PDL cells as the duration shown in figures. pJNK/JNK, p-p38/p38, pERK1/2/ERK expressions were detected by Western blotting. (n ≥ 3). DK PDL cells preincubated with DMSO, JNK pathway inhibitor SP600125 (SP, 10 μm, 2 h), p38 pathway inhibitor SB203580 (SB, 10 μm, 2 h), or ERK pathway inhibitor PD98059 (PD, 10 μm, 2 h) and subjected to FSS. YAP localization (green) (D), quantification of nuclear relative to cytoplasmic fluorescent intensity of YAP (E) (n = 64 roi per condition), pYAP(Ser127) (n ≥ 3) (F), CTGF (G), ANKRD1 (H), mRNA expression (n ≥ 3) and EdU results (n = 113, 107, 111, 109, 108 roi, respectively) (I, J), and pLATS1 (Thr1079) (n ≥ 3) (K). Bar represents mean ± s.d. *p < 0.05 and #p < 0.01; NS not significant
Fig. 4
Fig. 4
Cytoskeleton and LINC involve in FSS-induced YAP localization in PDL cells. (A) PDL cells preincubated with DMSO, actin inhibitor cytochalasin D (cyto D, 1 μm, 1 h), myosin II inhibitor Blebbistatin (Bleb, 50 μm, 2 h), Rho kinases (ROCK) inhibitor Y27632 (Y27632, 10 μm, 2 h), or actin stabilizer Jasplakinolide (Jasp, 50 nM, 2 h) were under static or subjected to FSS (6 dyn/cm2, 5 min) and were immunostained with anti-YAP (green) antibody and rhodamine phalloidin (red). Scale bars = 50 μm. B Quantification of nuclear relative to cytoplasmic fluorescent intensity of YAP in static or sheared PDL cells examined in (A) (n = 65, 65, 65, 65, 65, 64 roi, respectively). CF Nuclear morphology changed by FSS and cytoskeleton inhibitors. Scale bars = 3 μm. Quantification of nuclear thickness (D), nuclear area (E), and volume (F) (n = 34 roi per condition). GO PDL Cells transfected with control siRNA or Nesprin1 siRNAs were under static conditions or subjected to FSS (6 dyn/cm2, 5 min). Immunostained YAP (green) (G), quantification of nuclear fluorescence intensity of YAP relative to that of cytoplasm (H) (n = 70 roi per condition), quantification of F-actin fluorescence intensity (I) (n = 45 roi per condition), F-actin organization in the apical region of the nucleus and quantification of total fluorescence intensity of actin cap (J and K) (n = 36 roi per condition), nuclear morphology (L), nuclear thickness (M), nuclear area (N) and volume (O) (n = 34 roi per condition). Bar represents mean ± s.d. *p < 0.05 and #p < 0.01; NS not significant
Fig. 5
Fig. 5
p38 affected Akt/cofilin and LATS to regulate FSS-induced F-actin polymerization in PDL cells. A and B 6 dyn/cm2 of FSS loaded on PDL cells for 5 min, 10 min, and 30 min. pAkt, Akt (A), pcofilin and cofilin (B) protein expressions were detected by Western blotting (n ≥ 3). CG PDL cells transfected with control siRNA or cofilin siRNAs and under static conditions or subjected to FSS (6 dyn/cm2, 5 min). Immunostaining YAP (green) (C), quantification of nuclear relative to cytoplasmic fluorescent intensity of YAP (D) (n = 65 roi per condition), CTGF (E), ANKRD1 (F), mRNA expression (n ≥ 3), F-actin intensity (G) (n = 41 roi per condition). H pcofilin/cofilin expressions were detected when cells were incubated with DMSO or Akt inhibitor MK-2206 (2.5 μm, 24 h) under static conditions or subjected to FSS (6 dyn/cm2, 5 min) (n ≥ 3). IL PDL cells preincubated with DMSO or p38 pathway inhibitor SB203580 (10 μm, 2 h) and under static conditions or subjected to FSS (6 dyn/cm2, 5 min). pAkt (I), pcofilin (J) (n ≥ 3), and F-actin intensity (K and L) (n = 109,109,106 roi, respectively). M pLATS1/LATS1 expressions were detected when cells were incubated with DMSO or Akt inhibitor MK-2206 (2.5 μm, 24 h) under static conditions or subjected to FSS (6 dyn/cm2, 5 min) (n ≥ 3). NU PDL cells transfected with control siRNA or LATS1/2 siRNAs and under static conditions or subjected to FSS (6 dyn/cm2, 5 min). F-actin intensity (N and O) (n = 101,102, 103,104 roi, respectively), actin cap (P and Q) (n = 36 roi per condition), nuclear morphology (R), quantification of nuclear thickness (S), nuclear area (T), and volume (U) (n = 33 roi per condition). Bar represents mean ± s.d. *p < 0.05 and #p < 0.01; NS not significant
Fig. 6
Fig. 6
Angiomotin competitively bond with YAP and F-actin and involved in FSS-induced proliferation in PDL cells. PDL cells under static or exposed to 6 dyn/cm2 of FSS for 5 min, 10 min, 30 min, 1 h, 2 h, or 4 h. Immunostaining of AMOT (green) (A) and quantification of nuclear relative to cytoplasmic fluorescent intensity of AMOT (B) (n = 63 roi per condition), C Nuc/Cyt ratio of YAP and AMOT by FSS (R2, squared correlation coefficient). D Nuc/Cyt AMOT ratio versus nuclear thickness. E FSS (6 dyn/cm2, 5 min, 10 min) inhibited pAMOT (Ser175) expression (n ≥ 3). FK PDL cells transfected with control siRNA or AMOT siRNAs and subjected to FSS (6 dyn/cm2, 5 min or 4 h). YAP nuclear localization (F and G) (n = 68 roi per condition), CTGF (H), ANKRD1 (I), expression and EdU results (J, K) (n = 41, 41, 42, 41 roi, respectively). LO PDL cells were kept under static conditions or subjected to FSS (6 dyn/cm2, 5 min,10 min) (L). PDL cells transfected with control siRNA or YAP siRNAs were kept under static conditions or subjected to FSS (6 dyn/cm2, 5 min) (M). PDL cells were preincubated with DMSO, myosin II inhibitor Blebbistatin (Bleb, 50 μm, 2 h) (N), or actin stabilizer Jasplakinolide (Jasp, 50 nM, 2 h) (O) and were kept under static conditions or subjected to FSS (6 dyn/cm2, 5 min). Lysates of PDL cells were immunoprecipitated with anti-AMOT antibody. Coprecipitated endogenous YAP and F-actin were detected by immunoblotting with anti-YAP and anti-F-actin antibody. YAP and F-actin immunoprecipitated with anti-AMOT antibody (IP: AMOT Ab) in static or sheared PDL cells were analyzed. The relative intensity was calculated by the intensity of the band of immunoprecipitated YAP or F-actin by anti-AMOT antibody in the static or sheared PDL cells. Bar represents mean ± s.d. *p < 0.05 and #p < 0.01; NS not significant
Fig. 7
Fig. 7
YAP and LATS regulated FSS-induced AMOT phosphorylation and localization. PDL cells transfected with control siRNA or YAP siRNAs (A, B) or LATS1/2 siRNAs (C, D) and subjected to FSS (6 dyn/cm2, 5 min). Immunostaining of AMOT and quantification of nuclear relative to cytoplasmic fluorescent intensity of AMOT (B, n = 43 roi per condition) (D, n = 63 roi per condition). E When LATS1/2 were knocked down, FSS-depressed pAMOT (Ser175) expression was further declined (n ≥ 3). F When AMOT was knocked down, FSS-depressed pLATS1 expression was further decreased (n ≥ 3). G A schematic representation of how FSS regulated p38 and further affected YAP nuclear translocation to promoted proliferation in PDL cells. Bar represents mean ± s.d. *p < 0.05 and #p < 0.01; NS not significant

Similar articles

Cited by

References

    1. Pihlstrom BL, Michalowicz BS, Johnson NW (2005) Periodontal diseases. Lancet 366:1809–1820. 10.1016/S0140-6736(05)67728-8 - PubMed
    1. Kinane DF, Stathopoulou PG, Papapanou PN (2017) Periodontal diseases. Nat Rev Dis Primers 22:17038–17049. 10.1038/nrdp.2017.38 - PubMed
    1. Chen FM, Sun HH, Lu H, Yu Q (2012) Stem cell-delivery therapeutics for periodontal tissue regeneration. Biomaterials 33:6320–6344. 10.1016/j.biomaterials.2012.05.048 - PubMed
    1. Iwata T, Yamato M, Zhang Z et al (2010) Validation of human periodontal ligament-derived cells as a reliable source for cytotherapeutic use. J Clin Periodontol 37:1088–1099. 10.1111/j.1600-051X.2010.01597.x - PubMed
    1. Nakdilok K, Langsa-ard S, Krisanaprakornkit S et al (2020) Enhancement of human periodontal ligament by preapplication of orthodontic loading. Am J Orthod Dentofacial Orthop 157:186–193. 10.1016/j.ajodo.2019.03.019 - PubMed

MeSH terms

LinkOut - more resources