. 2022 Oct 16;13(1):6110.
doi: 10.1038/s41467-022-33787-8.

Ex vivo engineered human plasma cells exhibit robust protein secretion and long-term engraftment in vivo

Affiliations

Ex vivo engineered human plasma cells exhibit robust protein secretion and long-term engraftment in vivo

Rene Yu-Hong Cheng et al. Nat Commun. .

Abstract

Due to their unique longevity and capacity to secrete high levels of protein, plasma B cells have the potential to be used as a cell therapy for protein replacement. Here, we show that ex vivo engineered human plasma cells exhibit single-cell RNA profiles, scanning electron micrograph ultrastructural features, and in vivo homing capacity of long-lived plasma cells. After transferring human plasma cells to immunodeficient mice in the presence of the human cytokines BAFF and IL-6, we observe increases in retention of plasma cells in the bone marrow, with engraftment exceeding a year. The most profound in vivo effects of human IL-6 are observed within 20 days of transfer and could be explained by decreased apoptosis in newly differentiated plasma cells. Collectively, these results show that ex vivo engineered and differentiated human plasma cells have the potential for long-lived in vivo protein secretion, which can be modeled in small animals.


Conflict of interest statement

A patent application has been filed (K.L.H., I.F.K., D.J.R., and R.G.J. “Engraftable cell-based immunotherapy for long-term delivery of therapeutic proteins,” US patent application no. US20180282692A1). The remaining authors declare no competing interests.

Figures
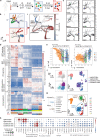
Fig. 1
Fig. 1. Single-cell transcriptomics illustrate the heterogeneity of ex vivo differentiated human PCs.
a Schematic of B cell culture ex vivo, and experimental setup: day 7 and day 13 cells were collected for CITE-seq. It was partially created with BioRender.com. b Single-cell graph by PAGA trajectory analysis of day 7 and day 13 cells, and heatmap by inferred pseudotime of all cells (n = 6011) from both time point and two biological replicates. Trajectory starts from the initial state node (cluster 1, activated B cells from day 7 cells) and ends at terminal state nodes (cluster 0/5, kappa/lambda PCs from day 13 cells). Cell differentiation states in between are labeled according to their representative cell status. c Single-cell trajectory graph heatmap showing expression of representative genes which indicate each cell status. d Expression heatmap of Louvain clusters, gene sets in each pathway show gene regulation along B cell development. Each data point present in the heatmap is computed by the average of normalized gene expression from 50 cells. e Surface protein (antibody-derived tag) expression trend along pseudotime. BCR expression is downregulated and CD38 expression is upregulated during PC differentiation. f Classification of B cell subsets categorized by the indicated protein markers: IgMhiCD38lo, IgMloCD38lo, CD38hiCD138lo, and CD38hiCD138hi. UMAP dimension-reduction projection of day 13 B cells (n = 2897) from two biological replicates. g Predominant immunoglobulin expression in each subset from f. h Dotplot visualization of day 13 B cells (n = 2897): subsets are listed on y-axis and genes (features) are listed along the x-axis. Dot size represents the percentage of cells in a group expressing each gene; the dot color indicates the mean expression level in a group.
Fig. 2
Fig. 2. A subset of ex vivo differentiated PCs resemble bone marrow ASCs.
a, b Using the indicated protein markers: active B (CD19hiCD38-), CD38+, CD38++, and CD138hi flow cytometry showing expression of MitoTracker Green FM (mitochondrial volume) and MitoTracker Red CMXRos (mitochondrial stress) from different B cell subsets. The data (n = 5 subjects) are normalized by minimal and maximal intensity per replicate and presented as mean and 95% confidence intervals. To assess significance, we used a paired one-way ANOVA with Tukey’s multiple comparison test (*p < 0.05, **p < 0.01, ***p < 0.001). P values for CD38+ and CD138hi with MitoTracker Green FM is 0.0123, for CD38+ and CD38++, CD38+ and CD138hi with MitoTracker Red CMXRos are 0.0044 and 0.0041, respectively. Source data are provided as a Source Data file. c Transmission electron microscopy of day 2 and day 13 B cells from three-stage culture. d Quantification of rough endoplasmic reticulum (RER) in ex vivo differentiated cultures. Day 2 (43 images) and day 13 cells (60 images) were scored blindly for having prominent RER or not (n = 6 participants). Data were presented as mean ± SD. Source data are provided as a Source Data file.
Fig. 3
Fig. 3. Ex vivo differentiated PCs home to BM and CD138+ PC is the main population engrafted.
a Schematic of firefly luciferase showing the homology-directed repair strategy, the B cell engineering and differentiation strategy, and the in vivo engraftment and tracking strategy. It was partially created with BioRender.com. b Representative images from an in vivo engraftment experiment tracking engineered B cells from Day 0 to day 51 using firefly luciferase imaging by IVIS (n = 10 animals, two independent donors. The imaging data is representative from a single donor; the data from donor two is in Supplementary Fig. 3a, b). c Luciferase flux was quantified in the hindlimb and chest at each of the time points. d Immunoglobulin was quantified in serum by ELISA. c, d The line indicates the mean at each time point, and the shadow shows the 95% confidence intervals. Source data are provided as a Source Data file. e Flow cytometry of cell subsets after enrichment with CD138 antibody. f Representative images and g quantification from in vivo subset engraftment tracking engineered B cells after a month. Cells were edited to express firefly luciferase and were imaged by IVIS (n = 3 animals). Data were presented as mean ± SD. Source data are provided as a Source Data file.
Fig. 4
Fig. 4. hIL-6 and hBAFF promote engraftment of ex vivo differentiated PCs.
a Schematic describing in vivo infusion of ex vivo differentiated B cells. Mock (n = 4 animals) or hBAFF (n = 5 animals) edited cells were transferred into NSG mice engineered to express hIL-6 (hIL-6-NSG). It was partially created with BioRender.com. bd ELISA was used to quantify B cell production of hIgG and hBAFF in NSG or NSG-hIL-6 animals. The line indicates the mean at each time point, and the shadow shows the 95% confidence intervals. Source data are provided as a Source Data file. e, f Using antibody secretion rate and antibody degradation rate as parameters (Supplementary Table 2), we fitted curves to explain the observed hIgG dynamics in the indicated mouse models. g, h For each animal (Mock, n = 4 animals; hBAFF, n = 5 animals), we used the fitted curves to calculate the decay rate and engrafted PC numbers. The box plot represents a central line denoting the median value (50th percentile), while the box contains the 25th to 75th percentiles of the dataset with black whiskers marking the maximum (95th percentile) and minimum (5th percentile). P values were calculated using an unpaired two-tailed Welch’s t-test. i Schematic showing how the key parameters (initial engraftment number and decay rate) are altered by hIL-6. It was created with BioRender.com.
Fig. 5
Fig. 5. Transfer of PCs into an immunodeficient mouse model expressing hIL-6 improves PCs engraftment.
a Schematic describing the transfer of ex vivo-derived PCs into B-NDG (control; n = 7 animals from two independent experiments) and hIL-6-B-NDG knock-in (hIL-6; n = 8 animals from two independent experiments) mice. It was partially created with BioRender.com. bd Firefly luciferase was quantified by IVIS imaging (normalized by Min-max normalization), hIgG and hIgM were quantified by ELISA and each point was plotted individually. The shadow represents the 95% confidence interval and the line represents the mean. P values were calculated in an unpaired two-sided t-test by comparing the area under curve (AUC) from individual mice. P values for normalized flux AUC and IgG AUC are 1.46E-05 and 1.37E-05, respectively. Source data are provided as a Source Data file. e, f Representative (e) and quantified (f) flow cytometry of BM cells from sacrificed mice using the indicated antibodies (control; n = 7 animals from two independent experiments) and hIL-6-B-NDG knock-in (hIL-6; n = 8 animals from two independent experiments). Data were presented as mean ± SD. P values were calculated using an unpaired one-sided t-test. Source data are provided as a Source Data file. g The relationship between hIgG antibody concentration and hIgG PCs counts in B-NDG mice and hIL-6-B-NDG mice. The correlation between them is presented by the Pearson correlation coefficient based on their quasi-linear relationship and assumption of normality of variables. The line indicates the mean at each time point, and the shadow shows the 95% confidence intervals. Source data are provided as a Source Data file.
Fig. 6
Fig. 6. hIL-6 prevents CD38hiCD138lo PC apoptosis and increases hIgG secretion rate.
a Schematic showing possible PC features affected by hIL-6, including proliferation rate (α), death rate (δ), and antibody secretion rate (γ). b Following ex vivo differentiation of PCs, CD138+ cells were isolated and cultured for 20 days in the presence or absence of hIL-6. The cell number for each replicate (n = 8; four independent donors) was plotted and curves were fitted (red and blue lines) based on the primary cell counting data. A two-sided paired t-test is performed for each time point, significance is under a significance level of α = 0.05. (*p < 0.05, **p < 0.01, ***p < 0.001). P values from left to right are 0.001, 0.007, 0.004, and 0.006, respectively. Source data are provided as a Source Data file. c Representative fitted curves with constant decay rate (β) and time-dependent decay rate (β0+β1t), respectively. d Fitted results of β0 and β1 from independent experiments (n = 8; four donors). The box plot represents a central line denoting the median value (50th percentile), while the box contains the 25th to 75th percentiles of the dataset with black whiskers marking the maximum (95th percentile) and minimum (5th percentile). P values were calculated by a two-sided paired t-test. A two-sided paired t-test is performed, significance is under a significance level of α =  0.05. (*p < 0.05, **p < 0.01, ***p < 0.001). P value for β0 and β1 are 0.0027 and 0.03, respectively. e Ex vivo differentiated PCs were labeled with BrdU at day 16 for 72 h and analyzed by flow cytometry at day 19 (n = 3 donors). A two-sided paired t-test is performed, significance is under a significance level of α = 0.05. (*p < 0.05, **p < 0.01, ***p < 0.001). Data were presented as mean ± SD. Source data are provided as a Source Data file. f Ex vivo differentiated PCs were incubated with or without hIL-6 for the indicated time periods and flow cytometry was used to quantify Caspglow in the indicated phenotypic subsets (n = 6 donors). P values were elucidated by a two-sided paired t-test (*p < 0.05; **p < 0.01, and **p < 0.001). Source data are provided as a Source Data file. g Schematic describing experimental outline for quantification of PC antibody secretion capacity ex vivo and in vivo. h hIgG secretion calculated from ELISA and cell counts (pg/cell/day) from day 0 to day 21 after three-stage culture (n = 9; five donors). P values were calculated using a two-sided paired t-test, significance is under a significance level of α = 0.05 (*p < 0.05; **p < 0.01, and **p < 0.001). P values from left to right are 0.61, 0.70, 0.0007, and 0.015, respectively. Source data are provided as a Source Data file. i Histogram and kernel density estimate (solid line) distributions of ELISPOT size from ex vivo day 13 CD138+ cells cultured with or without hIL-6 for 21 days. Data were normalized by scaling input vectors individually to the unit norm. Source data are provided as a Source Data file. j Mean of ELISPOT spot in three-dimensional size from ex vivo differentiated PCs cultured for 21 days (n = 3 donors). P values were calculated using a two-sided paired t-test. k Histogram and kernel density estimate (solid line) distributions of ELISPOT size converted from three-dimensional pixels, quantified from ASCs from B-NDG mice (n = 4 animals) and hIL-6-B-NDG mice (n = 5 animals) at day 28. Data normalized by scaling input vectors individually to unit norm. Source data are provided as a Source Data file. l Mean of ELISPOT spot in three-dimensional size from ASCs from B-NDG mice and hIL-6-B-NDG mice at day 28. P values were calculated using a two-sided t-test. h, j, l Box plot represents a central line denoting median value (50th percentile), while the box contains the 25th to 75th percentiles of the dataset with black whiskers marking the maximum (95th percentile) and minimum (5th percentile). a, g were created with BioRender.com.

References

    1. Lagassé HAD, et al. Recent advances in (therapeutic protein) drug development. F1000Res. 2017;6:113. doi: 10.12688/f1000research.9970.1. - DOI - PMC - PubMed
    1. Veronese FM, Mero A. The impact of PEGylation on biological therapies. BioDrugs. 2008;22:315–329. doi: 10.2165/00063030-200822050-00004. - DOI - PubMed
    1. Czajkowsky DM, Hu J, Shao Z, Pleass RJ. Fc-fusion proteins: new developments and future perspectives. EMBO Mol. Med. 2012;4:1015–1028. doi: 10.1002/emmm.201201379. - DOI - PMC - PubMed
    1. Smith BJ, et al. Prolonged in vivo residence times of antibody fragments associated with albumin. Bioconjug. Chem. 2001;12:750–756. doi: 10.1021/bc010003g. - DOI - PubMed
    1. Damgé C, Maincent P, Ubrich N. Oral delivery of insulin associated to polymeric nanoparticles in diabetic rats. J. Control. Release. 2007;117:163–170. doi: 10.1016/j.jconrel.2006.10.023. - DOI - PubMed

Publication types