. 2023 Apr 4;33(8):4761-4778.
doi: 10.1093/cercor/bhac378.

Whole-brain dynamics of human sensorimotor adaptation

Affiliations

Whole-brain dynamics of human sensorimotor adaptation

Dominic I Standage et al. Cereb Cortex. .

Abstract

Humans vary greatly in their motor learning abilities, yet little is known about the neural processes that underlie this variability. We identified distinct profiles of human sensorimotor adaptation that emerged across 2 days of learning, linking these profiles to the dynamics of whole-brain functional networks early on the first day when cognitive strategies toward sensorimotor adaptation are believed to be most prominent. During early learning, greater recruitment of a network of higher-order brain regions, involving prefrontal and anterior temporal cortex, was associated with faster learning. At the same time, greater integration of this "cognitive network" with a sensorimotor network was associated with slower learning, consistent with the notion that cognitive strategies toward adaptation operate in parallel with implicit learning processes of the sensorimotor system. On the second day, greater recruitment of a network that included the hippocampus was associated with faster learning, consistent with the notion that declarative memory systems are involved with fast relearning of sensorimotor mappings. Together, these findings provide novel evidence for the role of higher-order brain systems in driving variability in adaptation.

Keywords: cognition; fMRI; learning; modularity; motor learning.


Figures

Fig. 1
Fig. 1
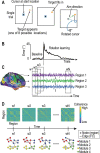
Overview of task and neural analyses. A) VMR task, where the viewed cursor, controlled by the hand, is rotated about the movement start location. B) A typical plot of error in degrees during the baseline and rotation epochs. The dashed line depicts the onset of the 45° rotation. C) Each participant’s cerebrum, striatum, and cerebellum were parcellated into discrete brain regions and the average %BOLD time series was extracted from each region for the entire task on each day (3 example cerebral regions are shown). The coherence (of Haar wavelet family, scale 2 coefficients, see Materials and methods) was calculated for each pair of regions in sliding, half-overlapping windows, constructing whole-brain functional connectivity matrices for each window (w1–wN; shown in “C”). D) Time-resolved clustering methods were applied to the functional connectivity matrices constructed in “B,” linking module labels (for each node) across time slices. This procedure allowed us to identify network modules that evolved during learning (4 modules shown in the schematic).
Fig. 2
Fig. 2
Clustering of participants’ learning data revealed 3 behavioral subgroups. A) Mean (across participants) of the binned median error (in degrees) during baseline (nonrotation), learning (45° rotation of the cursor) and washout (nonrotation) on day 1 (magenta) and day 2 (blue). Shading shows standard error (±1 SE) and the dashed vertical lines demark the 3 task components. Note that savings (inset) is significant at the group level (paired t-test; t(31) = 6.122, P = 8.666e-7). B) The group-averaged approach in panel A obscures differences in learning between individuals (3 example participants, P1–P3). C) k-means clustering of participants’ early and late errors and savings across days 1 and 2 (5 variables in total) identified 3 subgroups of participants. Plot shows the silhouette and Calinski-Harabasz (C–H) indices (see Materials and methods), measuring the goodness of clustering. Both measures are maximized by 3 clusters (open circles and dashed line indicate the best clustering solution). D) The mean (across participants) binned median error for the three behavioral subgroups (identified in B, C) during baseline, learning, and washout on day 1 (left) and day 2 (right). The subgroups are readily distinguished by their early error on each day and we refer to their patterns of learning as FF (n = 15), SS (n = 10), and SF (n = 7). On day 1, mean early error of FF was significantly lower than that of SS (2-sample t-test, t(23) = −9.963, P = 8.203e-10) and SF (t(20) = −12.74, P = 4.691e-11), but there was no statistical difference between SF and SS (t(15) = 1.0931, P = 0.292). On day 2, mean early error of FF was significantly lower than that of SS (t(23) = −7.413, P = 8.476e-10) and SF (t(20) = −3.106, P = 0.006), and mean early error of SF was significantly lower than that of SS (t(15) = −6.67, P = 7.495e-6). Inset shows savings by behavioral group. The FF and SF subgroups showed significant savings (t-test vs. 0; FF: t(14) = 5.817, P = 4.473e-5; SF: t(6) = 20.703, P = 8.265e-7), but SS did not (t-test vs. 0: t(9) = 1.688, P = 0.126). E) Top 2 components of the PCA for the 5 learning measures across participants. Single data points correspond to participants, color-coded by their cluster-assigned subgroup (legend in panel D). The x-axis of the plot shows that PC1 accurately classifies 31 of 32 participants (97% accuracy). Inset scatter plots show that PC1 and PC2 have strong linear relationships with mean early error across days and savings, respectively. F) Mean bin median RT for each subgroup (legend in panel D) for the baseline, learning, and washout epochs on day 1 (left) and day 2 (right). Shading shows standard error (±1 SE). G) Cluster distance matrix, showing Euclidian distance from cluster centroids for each participant.
Fig. 3
Fig. 3
During early learning, A) coordinated and B) uncoordinated modular reconfiguration are associated with fast and slow learning profiles, respectively. A) Scatter plots show the mean strength (across regions) of cohesive flexibility (cohesion strength, see text) during early learning, plotted over PC1. Filled circles correspond to FF, SS, and SF participants (see legend). The fitted line shows the best linear fit, where the shaded area shows ±1 SE. Subgroup means ±1 SE are shown as bar graphs to the right of the scatter plots. Differences between the subgroups were nonsignificant (FF − SF: t(20) = 0.511, P = 0.615. FF − SS: t(23) = 1.813, P = 0.083. SF − SS: t(15) = 1.02, P = 0.324). B) Mean disjointed flexibility (disjointedness, see text) as a function of PC1 during early learning. SS was more disjointed than FF (FF > SS: t(23) = −2.855, P = 0.009), but SF did not differ significantly from SS (t(15) = −2.122, P = 0.051) or FF (t(20) = −0.435, P = 0.669). Star in the bar plot indicates statistical significance (P < 0.05). C) Brain plots show correlations between PC1 and cohesion strength (upper plots) and disjointedness (lower plots) for each region. Correlation values associated with cohesion strength (mostly positive) and disjointedness (mostly negative) are shown under a divergent color scheme, ranging from strongly negative (dark blue) to strongly positive (dark red).
Fig. 4
Fig. 4
Summary of dynamic network architecture during sensorimotor adaptation. A) Left, module allegiance matrix showing the probability that each pair of brain regions was in the same temporal module during early learning, calculated over all participants, modular partitions, and time windows. Right, the same matrix organized according to the consensus clustering solution (see text). B) Network clusters from “A,” rendered onto the cortical and subcortical surfaces (highlighted areas denote the derived networks). Network 1 consisted of regions spanning contralateral motor cortex, bilateral cerebellum, medial prefrontal cortex, and several subcortical structures (bilateral hippocampus, pallidum, amygdala, and accumbens). Network 2 was a purely cortical network, consisting of regions spanning angular gyrus, superior temporal gyrus, cingulate cortex, and medial prefrontal cortex. Network 3 was also a purely cortical network, consisting mainly of regions in visual and fusiform cortex, and medial somatomotor cortex. Network 4 consisted of regions in visual cortex, medial and lateral parietal cortex, lateral somatomotor, and premotor cortex along with bilateral thalamus and putamen. Lastly, network 5 consisted of regions spanning the anterior temporal pole, inferior and superior parietal cortex, DLPFC, and the bilateral caudate. Note that we refrain from linking these specific task-derived networks to those described in the resting-state literature (Yeo et al. 2011) and refer to them as networks 1–5 in the text. For the list of brain regions belonging to each network, see Supplementary Table S2.
Fig. 5
Fig. 5
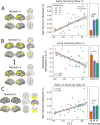
Recruitment of specific summary networks is associated with participants’ learning profiles during A) early learning and C) relearning on each day. A) During early learning, recruitment of network 5 (composed mainly of anterior temporal and prefrontal regions, left side) was positively correlated with PC1, where recruitment by FF and SF participants was statistically indistinguishable (2-sample t-test, t(20) = 0.235, P = 0.817) but was greater among FF (t(23) = 4.273, P = 2.85e-4) and SF (t(15) = 5.398, P = 7.398e-5) than SS (rightmost panel). B) During early learning, integration between network 4 (composed mainly of visual and somatomotor regions, left side) and network 5 was negatively correlated with PC1, where integration between these networks was greater among SS participants than FF (t(23) = −2.654, P = 0.014) but did not differ statistically between FF and SF (t(20) = −0.652, P = 0.522) nor between SF and SS (t(20) = −2.13, P = 5.016e-2) (rightmost panel). C) During early relearning, recruitment of network 1 (composed mainly of hippocampal, striatal, and cerebellar regions, left side) was positively correlated with PC1, where recruitment by FF and SF participants was statistically indistinguishable (t(20) = 0.11, P = 0.913) but was greater among FF (t(23) = 2.492, P = 0.02) and SF (t(15) = 2.86, P = 0.012) participants than SS (rightmost panel). In scatter plots, fitted line shows linear fit, where shading corresponds to ±1 SE. Bar plots show means, where error bars show ±1 SE. In bar plots, stars indicate significant differences (1 star: P < 0.05; 3 stars: P < 1e-3).
Fig. 6
Fig. 6
Summary of network recruitment and integration during learning and relearning. Recruitment of network 5 (left, top solid box) during early learning was correlated with a fast learning profile (dark green shading), but this correlation did not differ statistically from that during other task epochs on either day (light green). Integration of networks 4 and 5 (left, dotted box) was correlated with a slow learning profile (dark red shading). This effect was stronger than during day 1 baseline and early and late relearning (light red). Recruitment of network 1 (left, bottom solid box) during early relearning was correlated with a fast learning profile. This effect was specific to day 2. Black traces at top show group-averaged error.

References

    1. Abraham A, Pedregosa F, Eickenberg M, Gervais P, Mueller A, Kossaifi J, Gramfort A, Thirion B, Varoquaux G. Machine learning for neuroimaging with Scikit-Learn. Front Neuroinform. 2014:8:14. - PMC - PubMed
    1. Albert ST, Jang J, Shanaathanan M, Marius ‘t H, Henriques D, Lerner G, Della-Maggiore V, Haith AM, Krakauer JW, Shadmehr R. Competition between parallel sensorimotor learning systems. elife. 2022:11:e65361. - PMC - PubMed
    1. Anguera JA, Russell CA, Noll DC, Seidler RD. Neural correlates associated with intermanual transfer of sensorimotor adaptation. Brain Res. 2007:1185:136–151. - PubMed
    1. Anguera JA, Reuter-Lorenz PA, Willingham DT, Seidler RD. Contributions of spatial working memory to visuomotor learning. J Cogn Neurosci. 2010:22(9):1917–1930. - PubMed
    1. Anguera JA, Reuter-Lorenz PA, Willingham DT, Seidler RD. Failure to engage spatial working memory contributes to age-related declines in visuomotor learning. J Cogn Neurosci. 2011:23(1):11–25. - PubMed

Publication types

Grants and funding