

Regeneration of the human segmentation clock in somitoids in vitro
- PMID: 36245268
- PMCID: PMC9713707
- DOI: 10.15252/embj.2022110928
Regeneration of the human segmentation clock in somitoids in vitro
Abstract
Each vertebrate species appears to have a unique timing mechanism for forming somites along the vertebral column, and the process in human remains poorly understood at the molecular level due to technical and ethical limitations. Here, we report the reconstitution of human segmentation clock by direct reprogramming. We first reprogrammed human urine epithelial cells to a presomitic mesoderm (PSM) state capable of long-term self-renewal and formation of somitoids with an anterior-to-posterior axis. By inserting the RNA reporter Pepper into HES7 and MESP2 loci of these iPSM cells, we show that both transcripts oscillate in the resulting somitoids at ~5 h/cycle. GFP-tagged endogenous HES7 protein moves along the anterior-to-posterior axis during somitoid formation. The geo-sequencing analysis further confirmed anterior-to-posterior polarity and revealed the localized expression of WNT, BMP, FGF, and RA signaling molecules and HOXA-D family members. Our study demonstrates the direct reconstitution of human segmentation clock from somatic cells, which may allow future dissection of the mechanism and components of such a clock and aid regenerative medicine.
Keywords: UiSomitoid; anteroposterior axis; oscillation; presomitic mesoderm; somitogenesis.
© 2022 The Authors.
Figures
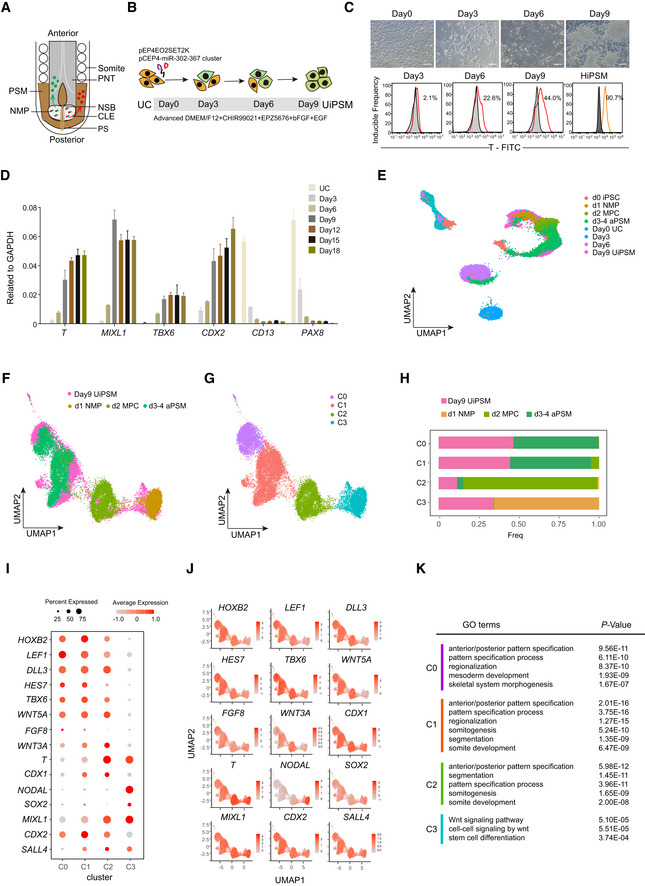
Schematic representation of the vertebrate embryonic central nervous system (CNS) indicating cell populations that give rise to the CNS. The posterior spinal cord arises from neuromesodermal progenitors (NMPs; red/green), which are located in the anterior primitive streak (PS; brown) and in the adjacent caudal lateral epiblast (CLE; light gray). NMPs give rise to new neural progenitors (NP; green), which contribute to the CLE (light gray) and then the preneural tube (PNT; dark gray), and to new mesoderm progenitors (MP; red), which contribute to presomitic mesoderm (PSM; brown), then give rise to somites.
Schematic overview of UiPSM reprogramming from UC. UC, human‐derived urine cells; UiPSM, presomitic mesoderm progenitor cells induced from human‐derived urine cells.
Representative images showing morphologic changes during UiPSM reprogramming (n = 3 independent experiments). Scale bars, 100 μm. Representative flow cytometry of T protein expression during UiPSM reprogramming, with hES‐derived HiPSM as a positive control (n = 3 independent experiments).
qRT–PCR analysis of PSM‐specific genes T, MIXL1, TBX6, and CDX2; and UC‐specific genes CD13 and PAX8 during the extended reprogramming time points, including days 0, 3, 6, 9, 12, 15, and 18. Data are mean ± s.d., n = 3 independent experiments.
UMAP analysis of 32,798 individual cells from UiPSM reprogramming on days 0, 3, 6, 9, and human iPSC differentiated PSM at d0 iPSC, d1 NMP, d2 MPC, and d3‐4 aPSM based on Margarete Diaz‐Cuadros et al (2020).
UMAP analysis of UiPSM on day 9 and published data (d1 NMP, d2 MPC, and d3‐4 aPSM) as in (E).
The cells in (F) are clustered and colored by the Louvain algorithm with four clusters.
Bar chart showing the proportion of UiPSM on day 9, d1 NMP, d2 MPC, and d3‐4 aPSM in each cluster.
Dot plot showing the expression level and ratio of PSM marker genes in four clusters.
Expression level of PSM marker genes in UMAP projection.
Gene ontology analyses of differentially expressed genes in four clusters with significantly enriched terms ranked by P‐value.
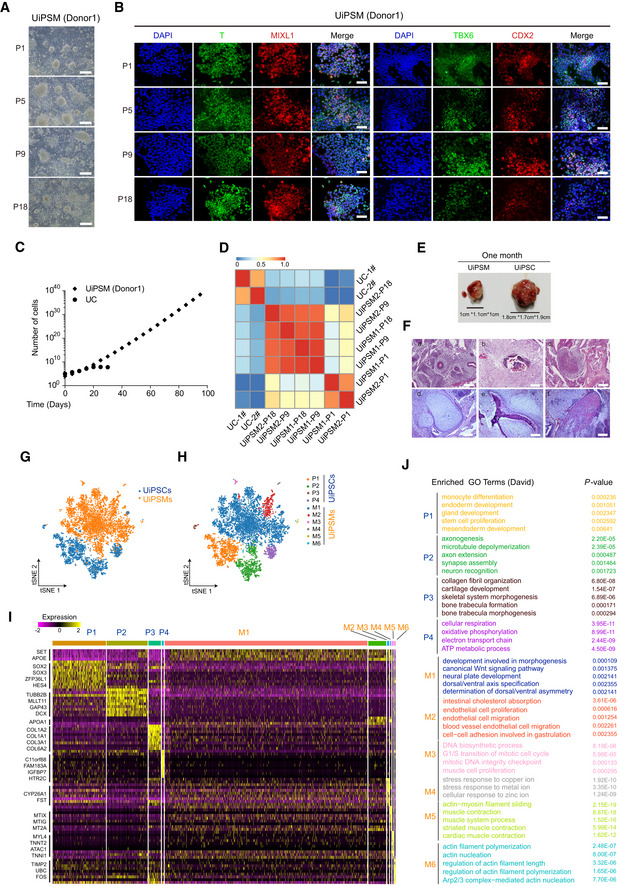
Representative images of UiPSM maintained in a defined medium (DM) at different passages. n = 4 biological experiments. Scale bars, 100 μm.
Immunofluorescence of DAPI, T, MIXL1, TBX6, and CDX2 in UiPSM colonies in (A). n = 4 biological experiments. Scale bars, 200 μm.
Growth curve of UCs and UiPSMs. Cells were seeded at 1 × 10⁵ cells/well (24‐well plate) and passaged every 5 days. Data were mean, n = 3 wells from three biological experiments.
Correlation analysis showing the similarity among UiPSM and the difference between UC and UiPSM. UiPSM1/2/3 derived from donor 1/2/3.
Representative images of UiPSM‐ and UiPSC‐derived teratomas at 1 month after transplantation. n = 3 biological experiments.
Representative images of HES‐stained UiPSM (d–f) and UiPSC (a–c)‐derived teratomas. (a) gland epithelium (endoderm); (b) osteoblast (mesoderm); (c) neural epithelium (ectoderm); (d) chondrocyte (mesoderm); (e) osteoblasts, osteoclasts, osteocytes (mesoderm); (f) muscle cell (ectoderm); n = 3 biological experiments. Scale bars, 100 μm.
t‐SNE projection of 12,456 individual cells from UiPSM and UiPSC teratomas.
t‐SNE projection in (G) colored by clusters identified with Louvain algorithm.
Representative marker expression shown in heatmap corresponding to each cluster in (G) and (H).
Gene ontology analyses for each cluster in (G) and (H). P‐value was < 0.05.
- A
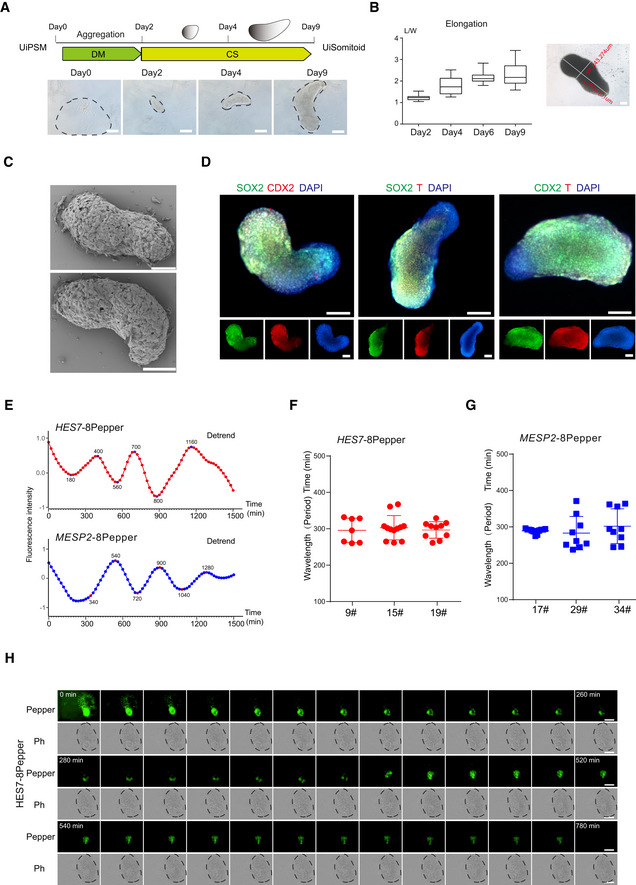
Schematic overview of UiSomitoid generation from UiPSM in a two‐stage process, CS (Advanced DMEM/F12 supplemented with 3 μM CHIR99021 and 5 μM SB431542) medium from day 2 to 9 after 2‐day aggregation in DM medium. Scale bars, 200 μm.
- B
Representative images of UiSomitoids (n = 10 biological experiments). Scale bars, 100 μm. Detected the ratio of length (L) over width (W) axis in (A). Top to bottom on the box chart represents maximum value, 75th percentile, median, 25th percentile, and minimum value. Twenty‐four aggregates calculated in one experiment. n = 3 independent experiments. Scale bars, 100 μm.
- C
Scanning electron micrographs of UiSomitoids on day 9. Two presentative examples were shown in two independent experiments (n = 24 UiSomitoids). Scale bars, 200 μm.
- D
Immunofluorescence of SOX2 (green) co‐stained with T (red) or CDX2 (red), CDX2 (green) co‐stained with T (red) within UiSomitoids on day 9 (n = 4 biological experiments). Scale bars, 200 μm.
- E
Representative quantification of HES7 and MESP2 mRNA–8pepper fluorescence intensity in a Uisomitoid (red and blue lines, n = 29 independent experiments for each plot).
- F, G
Oscillatory HES7 (F) and MESP2 (G) reporter activity measured with Incucyte® S3 Live‐Cell Analysis System and calculated oscillation periods. Data are mean ± s.d. n = 7, 12, 10 independent experiments for HES7 and n = 11, 9, 9 independent experiments for MESP2.
- H
Representative time‐lapse imaging of a single UiSomitoid (n = 10 biological experiments), pepper, HES7 mRNA–8pepper; Ph—phase. Scale bar, 400 μm.

Illustration of somitogenesis in mammalian embryos. Dark yellow, FGF/WNT signaling; light yellow, RA/BMP signaling; green, HES7. Lower panel: Diagram of representative images during the elongation of UiSomitoids along A‐P axis (green HES7‐GFP).
Bar charts showing the anteroposterior distribution of tailbud‐associated genes T, SOX2, and CDX2 in UiSomitoid.
Geo‐seq of an UiSomitoid with ~1,500 top highly variable genes selected by calculating variances along the anteroposterior axis. Selected genes are classified into six groups by the fuzzy clustering method.
Gene trends along the anteroposterior axis for clusters U2–U5 with Gene Ontology (GO) terms on the right. Line means; shading, s.d.
Localization distribution of HOX family along the anteroposterior axis. The level of expression is in scaled expression value.
Expression distribution of Wnt, BMP, RA, and FGF signaling components along the A‐P axis. Red color highlights genes located along the posterior axis. Blue color for genes located along the anterior axis.
References
-
- Beccari L, Moris N, Girgin M, Turner DA, Baillie‐Johnson P, Cossy AC, Lutolf MP, Duboule D, Arias AM (2018) Multi‐axial self‐organization properties of mouse embryonic stem cells into gastruloids. Nature 562: 272–276 - PubMed
Publication types
MeSH terms
Substances
Associated data
- Actions
- Actions
- Actions
- Actions
- Actions
- Actions
- Actions
LinkOut - more resources
Full Text Sources
Molecular Biology Databases
Miscellaneous
