

Prohibitin 1 regulates mtDNA release and downstream inflammatory responses
- PMID: 36245295
- PMCID: PMC9753472
- DOI: 10.15252/embj.2022111173
Prohibitin 1 regulates mtDNA release and downstream inflammatory responses
Abstract
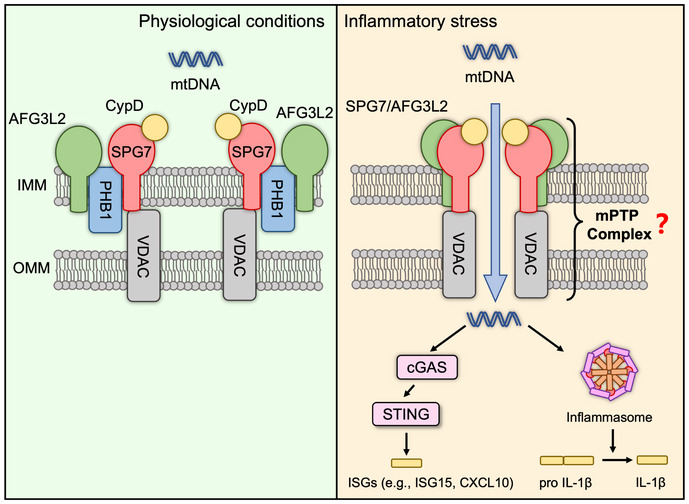
Exposure of mitochondrial DNA (mtDNA) to the cytosol activates innate immune responses. But the mechanisms by which mtDNA crosses the inner mitochondrial membrane are unknown. Here, we found that the inner mitochondrial membrane protein prohibitin 1 (PHB1) plays a critical role in mtDNA release by regulating permeability across the mitochondrial inner membrane. Loss of PHB1 results in alterations in mitochondrial integrity and function. PHB1-deficient macrophages, serum from myeloid-specific PHB1 KO (Phb1MyeKO) mice, and peripheral blood mononuclear cells from neonatal sepsis patients show increased interleukin-1β (IL-1β) levels. PHB1 KO mice are also intolerant of lipopolysaccharide shock. Phb1-depleted macrophages show increased cytoplasmic release of mtDNA and inflammatory responses. This process is suppressed by cyclosporine A and VBIT-4, which inhibit the mitochondrial permeability transition pore (mPTP) and VDAC oligomerization. Inflammatory stresses downregulate PHB1 expression levels in macrophages. Under normal physiological conditions, the inner mitochondrial membrane proteins, AFG3L2 and SPG7, are tethered to PHB1 to inhibit mPTP opening. Downregulation of PHB1 results in enhanced interaction between AFG3L2 and SPG7, mPTP opening, mtDNA release, and downstream inflammatory responses.
Keywords: AFG3L2; MIMP; PHB; SPG7; mtDNA.
© 2022 The Authors.
Figures
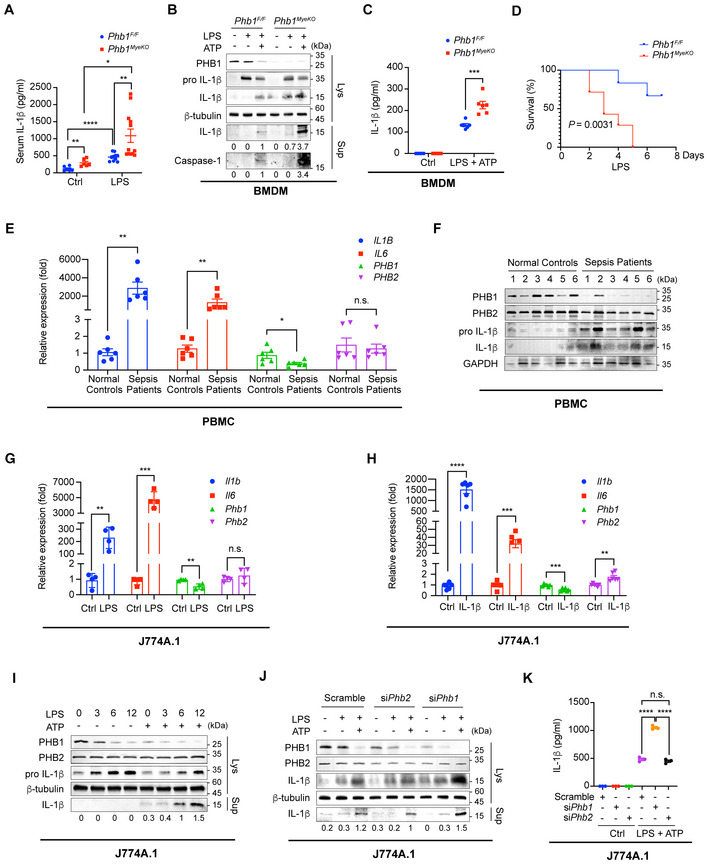
- A
After being randomized, 8‐ to 12‐week‐old and sex‐matched Phb1 F/F mice and Phb1 MyeKO mice were administered with PBS or LPS (30 mg/kg) for 12 h via intraperitoneal injection. Serum was collected and ELISA assays were used to detect the level of IL‐1β (n = 6, 10, 6, and 12 mice for each group, respectively). Data presented as mean ± SEM. *P < 0.05, **P < 0.01, ****P < 0.0001 (Student's t‐test).
- B
BMDMs were extracted from Phb1 F/F or Phb1 MyeKO mice and stimulated by 20% culture supernatant of L929 cells for 7 days. Differentiated BMDMs were stimulated with LPS (200 ng/ml) for 6 h and ATP (4 mM) for 45 min, the cells were lysed and the culture medium was collected. Western blotting (WB) assays were used to detect protein levels in whole cell lysates (Lys) and culture medium (Sup).
- C
BMDMs were extracted from Phb1 F/F or Phb1 MyeKO mice and stimulated with 20% culture supernatant of L929 cells for 7 days. Differentiated BMDMs were stimulated with LPS (200 ng/ml) for 6 h and ATP (4 mM) for 45 min. ELISA assays were used to detect protein levels in the culture medium. Data of BMDMs from the separate mice (n = 6 mice for each group) are presented as mean ± SEM. ***P < 0.001 (Student's t‐test).
- D
After randomized, 4 weeks old and sex‐matched Phb1 F/F mice and Phb1 MyeKO mice were administered with PBS or LPS (300 mg/kg) to induce septic shock via intraperitoneal injection. The life span of Phb1 F/F mice (n = 6) and Phb1 MyeKO mice (n = 7) was recorded.
- E
PBMCs were extracted from normal controls and patients with sepsis (n = 6 individuals). Intracellular mRNA levels were detected by real‐time quantitative PCR (RT–qPCR) assays (mean ± SEM). n.s., no significance, *P < 0.05, **P < 0.01 (Student's t‐test).
- F
PBMCs were extracted from normal controls and infant patients with sepsis. Protein levels in whole cell lysates were detected by WB assays.
- G, H
J774A.1 cells were stimulated with LPS (200 ng/ml) for 6 h or recombinant IL‐1β (100 pg/ml) for 24 h. Intracellular mRNA levels were detected by RT–qPCR assays. Data are from four independent experiments for (G) and six independent experiments for (H) (mean ± SEM). n.s., no significance, **P < 0.01, ***P < 0.001, ****P < 0.0001 (Student's t‐test).
- I
After J774A.1 cells were stimulated with LPS (200 ng/ml) for 0, 3, 6, 12 h and ATP (4 mM) for 45 min, the cells were lysed, and the culture medium was collected. Protein levels in whole cell lysates (Lys) and culture medium (Sup) were detected by WB assays.
- J
After J774A.1 cells with Phb1 or Phb2 knockdown were stimulated with LPS (200 ng/ml) for 6 h and ATP (4 mM) for 45 min, the cells were lysed, and the culture medium was collected. Protein levels in whole cell lysates (Lys) and culture medium (Sup) were detected by WB assays.
- K
After J774A.1 cells with Phb1 or Phb2 knockdown were stimulated with LPS (200 ng/ml) for 6 h and ATP (4 mM) for 45 min, the culture medium was collected. ELISA assays were used to detect IL‐1β levels in the culture medium. Data are from three independent experiments (mean ± SEM). n.s., no significance, ****P < 0.0001 (Student's t‐test).

- A, B
GFP‐expressing HeLa cells with stable Phb1 knockdown were fixed and subjected to immunofluorescence (IF) analysis to detect mitochondria (MitoTracker, red; A) or ΔΨm (TMRM, red; B). Images shown are representative of at least three independent experiments. White boxed regions in the panels in (A) are enlarged. Scale bar: 10 μm.
- C
Flow cytometric analysis of ΔΨm (TMRM). HeLa cells with stable Phb1 knockdown were treated with CsA (2 μM) for 30 min or FCCP (4 μM) for 5 min.
- D
The mitochondrial respiratory capacity of J774A.1 cells with or without Phb1 knockdown was measured with a Seahorse XFe96 analyzer. Data are from at least three independent experiments (mean ± SEM). n.s., no significance. **P < 0.01, ***P < 0.001, ****P < 0.0001 (Student's t‐test).
- E
HeLa cells with stable PHB1 ablation were incubated with H2O2 (2 μM) and CsA (2 μM) for 30 min. Flow cytometric analysis of intracellular ROS levels (DHE).
- F, G
Confocal microscopy analyses of mitochondrial Ca2+ in time‐series mode. HeLa cells stably expressing 4mt‐RCaMPh with or without Phb1 knockdown were treated with CsA (2 μM) for 30 min. During the acquisition of fluorescence images (F), cells were treated with histamine (200 μM). Traces of mitochondrial Ca2+ (4mt‐RCaMPh) dynamics are shown in (G) (mean ± SEM). n = 16, 16, 15, 16 (from the top to the bottom). Scale bar: 10 μm. *P < 0.05 relative to Scramble group, #P < 0.05 relative to shPHB1 group (Student's t‐test).

- A
The co‐localization between mtDNA (SG‐ALK, green) and mitochondria (MitoTracker, red) was examined in J774A.1 cells with or without knockdown of Phb1 or Phb2. White boxed regions in the panels are enlarged. The white arrows indicate mtDNA outside mitochondria. Scale bar: 10 μm.
- B
Quantitative analysis of data from (A). Data are from 10, 8, and 7 images from three independent experiments (left to right, respectively) (mean ± SEM). n.s., no significance, ***P < 0.001 (Student's t‐test).
- C
J774A.1 cells with or without Phb1 knockdown were lysed, and DNA was extracted. qPCR assays were used to detect the mtDNA levels (D‐loop) in the cytosol relative to nuclear DNA levels (Tert) in the whole cell lysates. Data are from six independent experiments (mean ± SEM). ****P < 0.0001 (Student's t‐test).
- D
BMDMs isolated from Phb1 F/F mice and Phb1 MyeKO mice were fixed and subjected to IF analysis to detect the co‐localization between mitochondria (MitoTracker, red) and mtDNA (SG‐ALK, green). White boxed regions in the panels are enlarged. The white arrows indicate mtDNA outside mitochondria. Scale bar: 10 μm.
- E
Quantitative analysis of data from (D). Data are from 10 and 8 images from three independent experiments (mean ± SEM). **P < 0.01 (Student's t‐test).
- F
PBMCs were extracted from Phb1 F/F mice and Phb1 MyeKO mice. Cells were lysed, and DNA was extracted. qPCR assays were used to detect the levels of mtDNA (D‐loop) in the cytosol relative to the levels of nuclear DNA levels (Tert) in the whole cell lysates. Data of PBMC are from seven Phb1 F/F mice and Phb1 MyeKO mice, respectively (mean ± SEM). **P < 0.01 (Student's t‐test).
- G
HeLa cells expressing TFAM‐FLAG with or without Phb1 knockdown were incubated with CsA (2 μM) for 30 min. Cells were fixed and subjected to IF analysis to detect the co‐localization between mitochondria (anti‐TOMM20, red) and TFAM‐FLAG (anti‐FLAG, green). White boxed regions in the panels are enlarged. The white arrows indicate mtDNA outside mitochondria. The yellow arrows indicate mtDNA inside mitochondria. Scale bar: 10 μm.
- H
Quantitative analysis of data from (G). Data from 30, 27, 25, and 24 images from three independent experiments (mean ± SEM). ****P < 0.0001 (Student's t‐test).
- I
HeLa cells with or without Phb1 knockdown were incubated with H2O2 (5 mM) for 20 min and CsA (4 μM) for 12 h. Cells were lysed, and DNA was extracted. qPCR assays were used to detect mtDNA levels (ND1) in the cytosol and nuclear DNA levels (18S) in the whole cell lysates. Data are from four independent experiments (mean ± SEM). **P < 0.01, ***P < 0.001, ****P < 0.0001 (Student's t‐test).
- J, K
HeLa cells with or without Phb1 knockdown were incubated with VBIT‐4 (10 μM) for 1 h and subsequently lysed, and DNA was extracted. qPCR assays were used to detect mtDNA levels (ND1 in HeLa cells or D‐loop in J774A.1 cells) in the cytosol relative to nuclear DNA levels (TERT in HeLa cells or Tert in J774A.1 cells) in the whole cell lysates. Data are from three independent experiments (mean ± SEM). n.s., no significance, *P < 0.05, **P < 0.01, ***P < 0.001 (Student's t‐test).
- L
J774A.1 cells with or without Phb1 knockdown were lysed. The whole cell lysates were immunoprecipitated by IgG or anti‐ASC antibody and the resulting proteins were detected by WB assay.
- M
BMDMs isolated from Phb1 F/F mice and Phb1 MyeKO mice were incubated with MCC950 (50 nM) for 30 min and were subsequently stimulated by LPS (200 ng/ml) for 6 h and ATP (4 mM) for 45 min. Protein levels in whole cell lysates and culture medium were detected by WB assay.
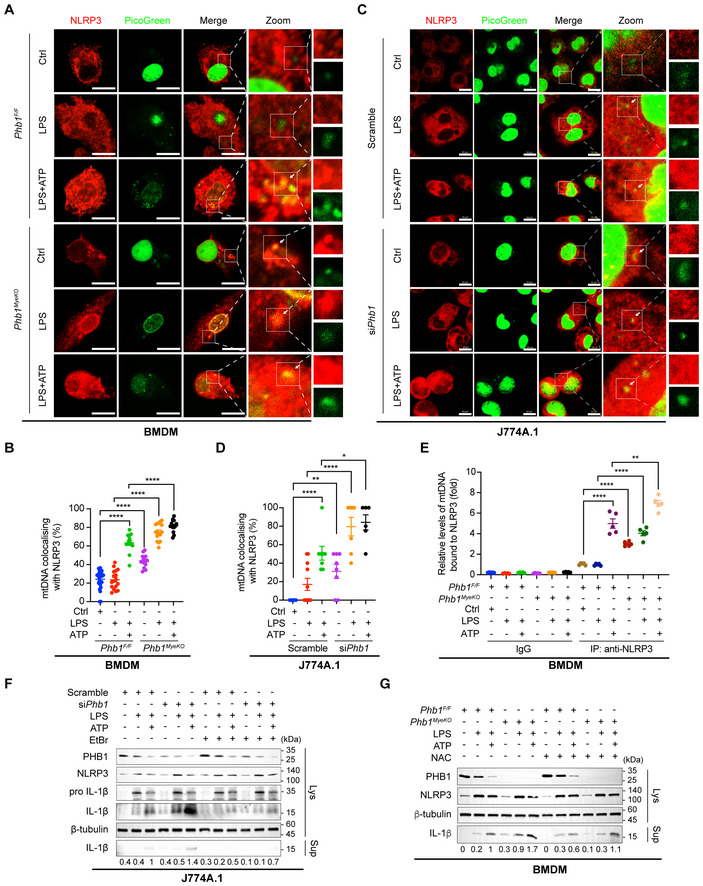
- A
BMDMs isolated from Phb1 F/F mice and Phb1 MyeKO mice were stimulated with LPS (200 ng/ml) for 6 h, and ATP (4 mM) for 45 min. Cells were fixed and subjected to IF analysis to detect the co‐localization between NLRP3 (anti‐NLRP3, red) and mtDNA (PicoGreen, green). White boxed regions in the panels are enlarged. The white arrows indicate mtDNA co‐localized with NLRP3. Scale bar: 10 μm.
- B
Quantitative analysis of data from (A). Data are from at least 14 images from three independent experiments (mean ± SEM). ****P < 0.0001 (Student's t‐test).
- C
J774A.1 cells with or without Phb1 knockdown were stimulated with LPS (200 ng/ml) for 6 h and ATP (4 mM) for 45 min. Cells were fixed and subjected to IF analysis to detect the co‐localization between NLRP3 (anti‐NLRP3, red) and mtDNA (PicoGreen, green). White boxed regions in the panels are enlarged. The white arrows indicate mtDNA co‐localized with NLRP3. Scale bar: 10 μm.
- D
Quantitative analysis of data from (C). Data are from at least six images from three independent experiments (mean ± SEM). *P < 0.05, **P < 0.01, ****P < 0.0001 (Student's t‐test).
- E
J774A.1 cells with or without Phb1 knockdown were stimulated with LPS (200 ng/ml) for 6 h and ATP (4 mM) for 45 min. After cells were lysed, NLRP3 was immunoprecipitated by anti‐NLRP3 antibody. mtDNA levels (D‐loop) from immunoprecipitants were detected by qPCR in J774A.1 cells with or without Phb1 knockdown. Data are from five independent experiments (mean ± SEM). **P < 0.01, ****P < 0.0001 (Student's t‐test).
- F
J774A.1 cells with Phb1 knockdown were incubated with EtBr (150 ng/ml) for 3 days, followed by LPS (200 ng/ml) for 6 h and ATP (4 mM) for 45 min. WB was used to detect the protein levels in whole cell lysates and culture medium.
- G
BMDMs isolated from Phb1 F/F mice and Phb1 MyeKO mice were treated with NAC (2 mM) for 8 h, LPS (200 ng/ml) for 6 h and ATP (4 mM) for 45 min. WB assay was used to detect the protein levels in whole cell lysates and in the culture medium.
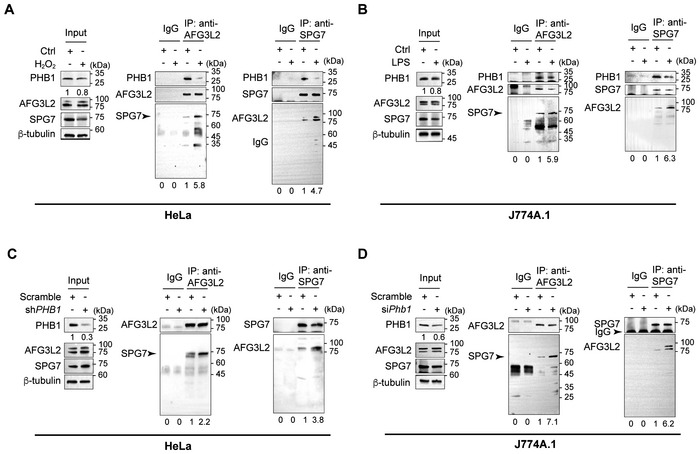
- A
HeLa cells were incubated with H2O2 (5 mM) for 20 min and then lysed. The whole cell lysate was immunoprecipitated by IgG, anti‐AFG3L2 antibody, or anti‐SPG7 antibody. WB was used to detect the SPG7 or AFG3L2 levels, respectively, in the precipitated products.
- B
J774A.1 cells were stimulated with LPS (200 ng/ml) for 6 h and lysed. The whole cell lysate was immunoprecipitated by IgG, anti‐AFG3L2 antibody, or anti‐SPG7 antibody. The respective levels of precipitated SPG7 or AFG3L2 were examined by WB.
- C, D
HeLa cells or J774A.1 cells with or without Phb1 knockdown were lysed. The whole cell lysate was immunoprecipitated by IgG, anti‐AFG3L2 antibody, or anti‐SPG7 antibody. The respective levels of precipitated SPG7 or AFG3L2 were examined by WB.
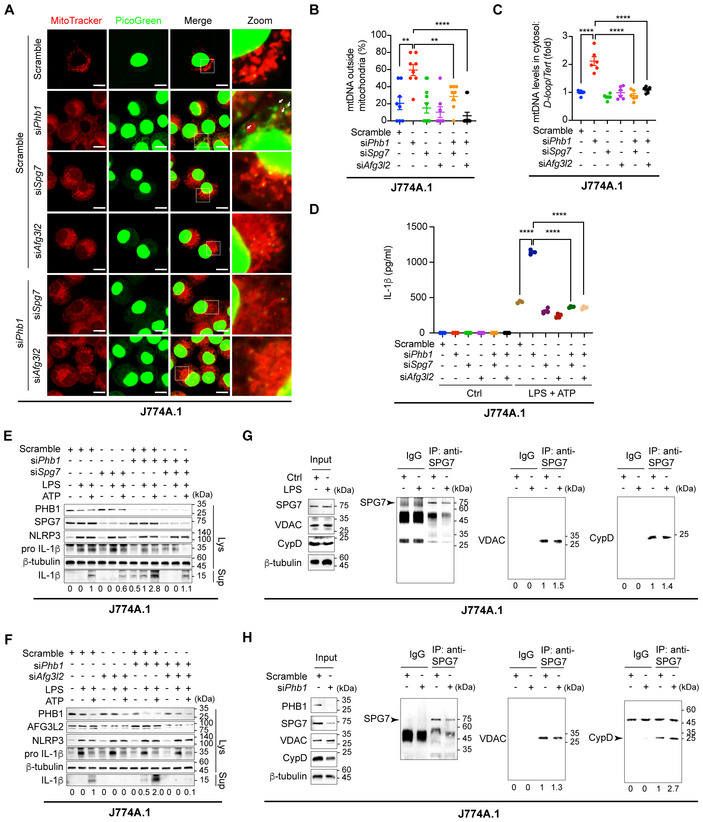
J774A.1 cells with knockdown of Phb1 alone, Afg3l2 alone, Spg7 alone, Phb1 + Afg3l2, or Phb1 + Spg7 were fixed and subjected to IF analysis to assess the co‐localization between mitochondria (MitoTracker, red) and mtDNA (PicoGreen, green). White boxed regions in the panels are enlarged. The white arrows indicate mtDNA outside mitochondria. Scale bar: 10 μm.
Quantitative analysis of the data from (A). Data are from at least 12 images from three independent experiments (mean ± SEM). **P < 0.01, ****P < 0.0001 (Student's t‐test).
J774A.1 cells with knockdown of Phb1 alone, Afg3l2 alone, Spg7 alone, Phb1 + Afg3l2, or Phb1 + Spg7 were lysed, and DNA was extracted. qPCR was used to detect the mtDNA levels (D‐loop) in the cytosol relative to the nuclear DNA levels (Tert) in the whole cell lysate. Data are from six independent experiments (mean ± SEM). ****P < 0.0001 (Student's t‐test).
J774A.1 cells with knockdown of Phb1 alone, Afg3l2 alone, Spg7 alone, Phb1 + Afg3l2, or Phb1 + Spg7 were stimulated with LPS (200 ng/ml) for 6 h and ATP (4 mM) for 45 min. The culture medium was collected and ELISA assays were used to detect IL‐1β levels in the culture medium. Data are from four independent experiments (mean ± SEM). ****P < 0.0001 (Student's t‐test).
J774A.1 cells with Phb1 knockdown, Spg7 knockdown, or combined Phb1 and Spg7 knockdowns were stimulated with LPS (200 ng/ml) for 6 h and ATP (4 mM) for 45 min. WB assay was used to detect the protein levels in whole cell lysates and culture medium.
J774A.1 cells with Phb1 knockdown, Afg3l2 knockdown, and combined Phb1 and Afg3l2 knockdowns were stimulated with LPS (200 ng/ml) for 6 h and ATP (4 mM) for 45 min. WB assay was used to detect the protein levels in whole cell lysates and culture medium.
J774A.1 cells were stimulated with LPS (200 ng/ml) for 6 h and lysed. The whole cell lysate was immunoprecipitated by IgG or anti‐SPG7 antibody. WB was used to detect the CYPD and VDAC levels in the precipitated products.
J774A.1 cells with or without Phb1 knockdown were lysed. The whole cell lysates were immunoprecipitated by IgG or anti‐SPG7 antibody. WB was used to detect the CYPD and VDAC levels in the precipitated products.
References
Publication types
MeSH terms
Substances
LinkOut - more resources
Full Text Sources
Research Materials
