

The chromatin factor ROW cooperates with BEAF-32 in regulating long-range inducible genes
- PMID: 36245419
- PMCID: PMC9724677
- DOI: 10.15252/embr.202254720
The chromatin factor ROW cooperates with BEAF-32 in regulating long-range inducible genes
Abstract
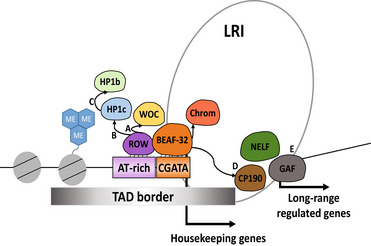
Insulator proteins located at the boundaries of topological associated domains (TAD) are involved in higher-order chromatin organization and transcription regulation. However, it is still not clear how long-range contacts contribute to transcriptional regulation. Here, we show that relative-of-WOC (ROW) is essential for the long-range transcription regulation mediated by the boundary element-associated factor of 32kD (BEAF-32). We find that ROW physically interacts with heterochromatin proteins (HP1b and HP1c) and the insulator protein (BEAF-32). These proteins interact at TAD boundaries where ROW, through its AT-hook motifs, binds AT-rich sequences flanked by BEAF-32-binding sites and motifs. Knockdown of row downregulates genes that are long-range targets of BEAF-32 and bound indirectly by ROW (without binding motif). Analyses of high-throughput chromosome conformation capture (Hi-C) data reveal long-range interactions between promoters of housekeeping genes bound directly by ROW and promoters of developmental genes bound indirectly by ROW. Thus, our results show cooperation between BEAF-32 and the ROW complex, including HP1 proteins, to regulate the transcription of developmental and inducible genes through long-range interactions.
Keywords: Drosophila; gene regulation; heterochromatin proteins; insulator proteins; topological associated domains (TADs).
© 2022 The Authors. Published under the terms of the CC BY NC ND 4.0 license.
Figures
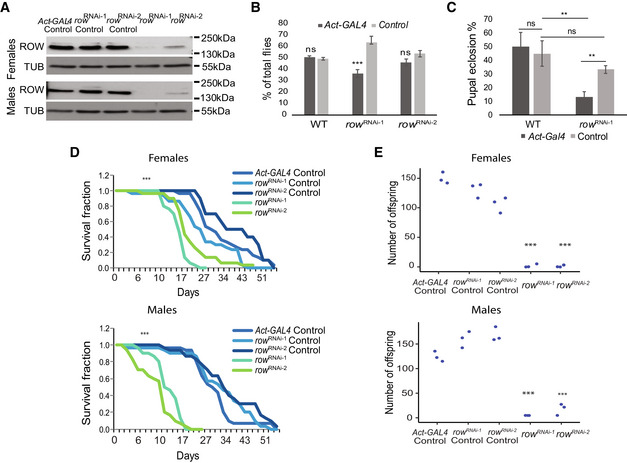
Levels of ROW protein in row RNAi lines were decreased in both male and female fly heads. Western blot for the two row RNAi lines compared with controls was performed using rat polyclonal αROW and rat αTUBULIN (TUB). Genotype description: row RNAi‐1 (Act‐GAL4/+; UAS‐rowRNAi‐1/+), row RNAi‐2 (Act‐GAL4/+; UAS‐rowRNAi‐2/+), row RNAi‐1 Control (CyO/+; UAS‐rowRNAi‐1/+), row RNAi‐2 Control (CyO/+; UAS‐ rowRNAi‐2) and Act‐GAL4 Control (Act‐GAL4 /+).
Decrease in the viability of row RNAi lines. To examine the viability of row RNAi flies, we counted the offspring generated from the cross between the heterozygous Act‐GAL4/CyO driver line with the homozygotes row RNAi, or WT (w1118) flies as control. Values are the percentages from the total progeny ± standard error of the mean (SEM). n = 3 (biological replicates). Significance was tested using a two‐sided binomial test.
Decrease in pupal eclosion of row RNAi line. Pupae were collected from the cross between the heterozygous Act‐GAL4/CyO driver line with the homozygotes row RNAi‐1 or WT (w1118) flies as control. Values are the percentages for each genotype of pupal eclosion ± SEM. n = 3 (biological replicates). Significance was tested using post hoc tests with ANOVA.
Survival curve for row RNAi flies showing reduced life span compared with controls. n = 3 (biological replicates). Significance was tested using the Kaplan–Meier estimate of survival and log‐rank test.
Crossing of females/males row RNAi flies with WT males/females (w1118) flies resulted in a strong reduction in offspring number. Values are the number of offspring from crosses between WT (w1118) flies and flies with different genotypes. n = 3 (biological replicates). Statistical tests were performed with ANOVA followed by the Tukey's test.
- A
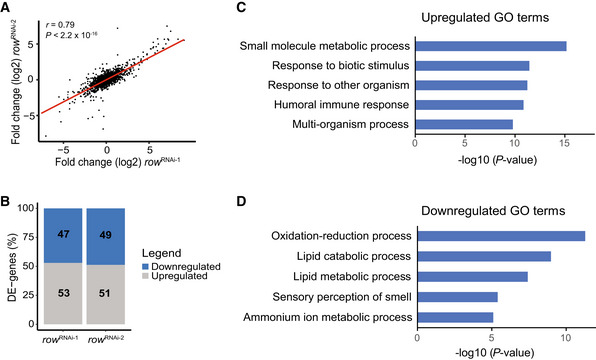
Correlation between the fold changes (log2) in row RNAi‐1 (n = 3 biological replicates) and row RNAi‐2 (n = 2 biological replicates). Fold changes were calculated relative to Act‐GAL4 control (n = 3 biological replicates; using edgeR). Significance was tested using the Pearson's correlation test.
- B
The percentage of differentially expressed genes (DE‐genes) upregulated and downregulated in the two row RNAi lines.
- C, D
The top 5 most significantly enriched biological processes (FDR < 0.05) that are associated with (C) upregulated and (D) downregulated genes. Results are after removing redundant terms using the REVIGO tool. GO—gene ontology.
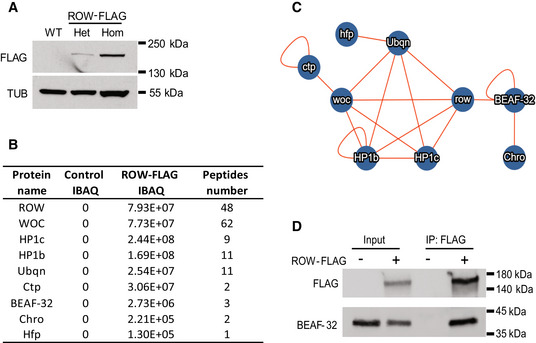
Western blot for flies expressing endogenous FLAG‐tagged ROW (ROW‐FLAG), with αFlag tag antibody to validate the tagging. αTubulin (TUB) antibody was used as a reference. Het, Heterozygotes; Hom, Homozygotes for tagged ROW.
Table summarizing the affinity purification–mass spectrometry data. IBAQ (intensity‐based absolute quantification) reflects the protein abundance in the sample. Peptide number is the number of razor and unique peptides. The data are the mean for the control (W1118, n = 3) and ROW‐FLAG flies (n = 3) samples. The proteins presented in the table were co‐purified with ROW in at least two out of the three experiments, none in the control experiments, and are supported by additional evidence from previous studies.
Network of identified protein–protein interactions associated with ROW in fly heads. The lines represent previously identified interactions.
BEAF‐32 coimmunoprecipitate with ROW. Lysates from S2 cells not transfected (−) or transfected (+) with ROW‐FLAG tagged plasmid were subjected to immunoprecipitation with αFlag tag beads. The immunoprecipitates and input (5%) were analyzed by western blot with αFlag tag and αBEAF‐32 antibodies.
- A
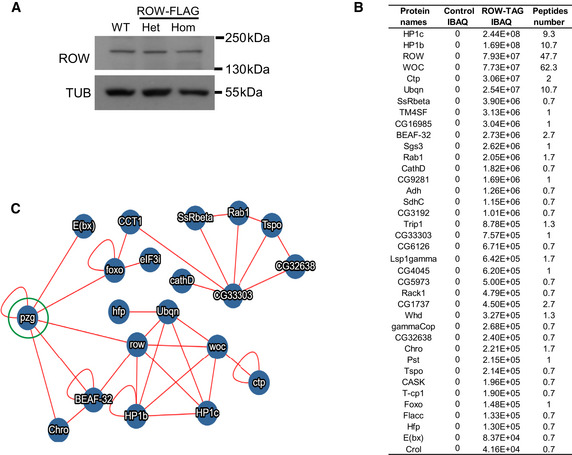
Western blot for flies expressing endogenous FLAG‐tagged ROW (ROW‐TAG) with αROW antibody was used to verify that the tagging does not affect ROW protein levels. αTubulin (TUB) antibody was used as a reference. Het, Heterozygotes; Hom, Homozygotes for tagged ROW.
- B
Proteins co‐purified with ROW in at least two of the three experiments that were also not detected in the control experiments. IBAQ (Accurate Label‐Free Protein Quantitation) reflects the protein abundance in the sample. Peptide number is the number of Razor and unique peptides. The data are the mean of control (W1118, n = 3) and ROW‐FLAG flies (n = 3) samples.
- C
Protein–protein interactions that are supported by previous studies. The interactions are based on the molecular interaction search tool (MIST; Hu et al, 2018). The PZG (Z4) protein (circled in green) was not co‐purified with ROW in our study but was found previously to interact with ROW (Guruharsha et al, ; Kessler et al, 2015) and may connect the two complexes we identified to interact with ROW.
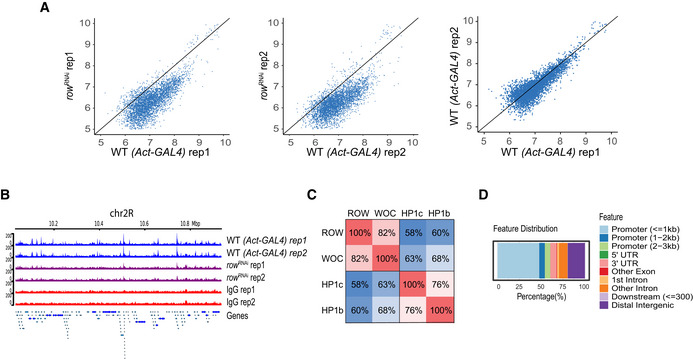
Scatter plots of the ChIP‐seq signal of ROW in row RNAi flies compared with Act‐GAL4 flies (WT) and the results of the two biological replicates (rep1 and rep2) in WT flies against each other. The result shows that in row RNAi flies, the signal is below the straight line with a slope of 1.
ChIP‐seq signals for ROW in a representative genomic region. The data are shown for Act‐GAL4 flies, row RNAi‐1 flies, and IgG ChIP‐seq signals (n = 2 biological replicates for each).
Percentage of overlap between the binding sites of ROW, WOC, HP1c, and HP1b.
Genomic annotation of the shared binding sites between ROW, WOC, HP1c, and HP1b.
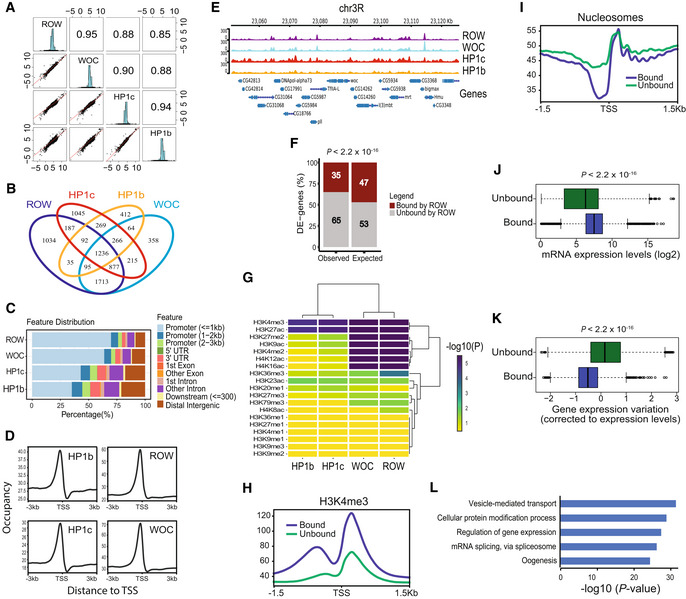
Pairwise correlation analysis between the ChIP‐seq signals of ROW, WOC, HP1c, and HP1b in nonoverlapping bins of 2,000 bases across the genome. In the boxes of the upper triangle are the Pearson correlation coefficients. In the diagonal boxes are histograms showing the distributions of the ChIP‐seq signal. On the lower triangle boxes are bivariate scatter plots with linear regression lines. The ChIP‐seq signals are an average of three biological replicates for each protein.
Venn plot showing the overlap between the binding sites of ROW, WOC, HP1c, and HP1b.
Genomic annotation of ROW‐, WOC‐, HP1c‐, and HP1b‐binding sites.
Average signal profiles (metagene plot) of ROW, WOC, HP1c, and HP1b over a 6‐kb window around TSSs. The ChIP‐seq signals are an average of three biological replicates for each protein.
ChIP‐seq signals for ROW, WOC, HP1c, and HP1b at example genomic region. The ChIP‐seq signals are an average of three biological replicates for each protein.
The percentages of differentially expressed genes in fly heads bound or unbound by ROW and the expected values under an independent assumption. Significance was tested using the Fisher's exact test.
Heatmap showing the significance of the overlap between different histone modifications and ROW, WOC, HP1c, and HP1b.
A metagene plot of H3K4me3 over a 3‐kb window around TSSs for genes bound and unbound by ROW with matched expression levels.
Average nucleosome profile over a 3‐kb window around TSSs for genes bound and unbound by ROW with matched expression levels.
Expression levels in the fly heads for all genes bound (n = 4,651) and unbound by ROW (n = 9,132). Values are log2 of the normalized reads count based on RNA‐seq from control flies. Within each box, the central band is the median value; boxes represent the range between the 25th to the 75th percentile distribution of values; whiskers denote the minimum/maximum values within 1.5 times the interquartile range of the 25th and 75th percentile; dots are observations outside the whiskers range. Significance was calculated using the Wilcoxon signed‐rank test.
Gene expression variation (corrected to expression levels, see methods) for genes bound (n = 4,651) and unbound by ROW (n = 9,132) across 30 different developmental stages. Within each box, the central band is the median value; boxes represent the range between the 25th to the 75th percentile distribution of values; whiskers denote the minimum/maximum values within 1.5 times the interquartile range of the 25th and 75th percentile; dots are observations outside the whiskers range. Significance was tested using the Wilcoxon signed‐rank test.
The top 5 most significantly enriched biological processes (FDR < 0.05) for genes bound by ROW, after removing redundant terms using the REVIGO tool.
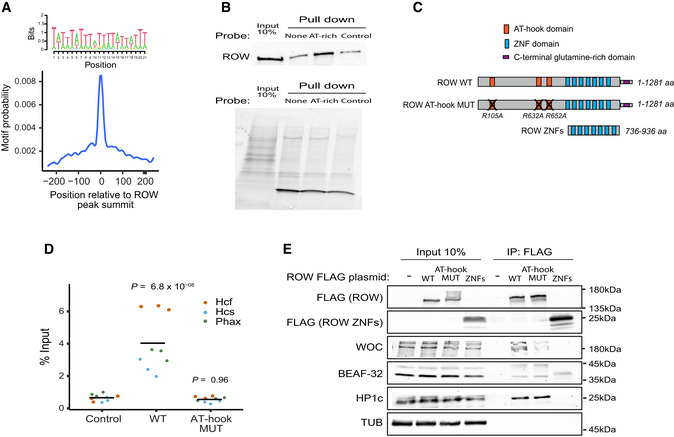
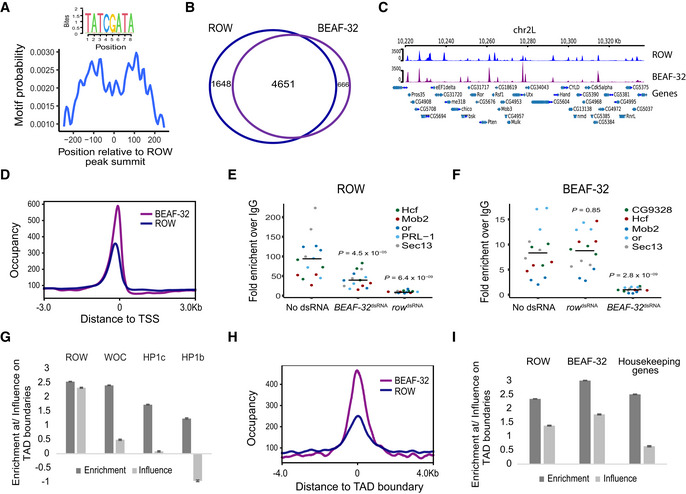
Central enrichment of AT‐rich sequence in ROW‐binding regions. The logo shows the most significant enriched sequence (based on MEME‐ChIP analysis). The plot shows the motif's probability relative to the ROW ChIP‐seq peaks (calculated with centriMo).
On the top are the results of DNA affinity pulldown followed by western blot with ROW antibody. None is a pulldown with no probe, AT‐rich is a pulldown with a biotin‐labeled AT‐rich dsDNA probe, and control is a pulldown with a probe composed of 49% A/T bases. On the bottom is the stain‐free gel as a loading control.
The structure of ROW, the AT‐hook mutant, and the plasmid containing only the ZNF domains of ROW that were used in ChIP–qPCR and Co‐IP experiments. The length of the predicted proteins in numbers of amino acids (aa) and the positions of the mutations in the AT‐hook domains of ROW are shown.
ChIP–qPCR results using FLAG‐tag antibody for S2 cells transfected with WT or AT‐hook mutant ROW‐FLAG tagged plasmids (n = 3, technical and biological replicates). As a control, cells not transfected with ROW‐FLAG tagged plasmid were used. Input percentages for three biological replicates are shown for three promoters containing AT‐rich sequences (Hcf, Phax, and Hcs). The horizontal line represents the mean. Significance was calculated using a mixed model followed by the Tukey's post hoc test.
Co‐IP results using αFlag antibody in S2 cells transfected with WT or AT‐hook mutant ROW‐FLAG tagged plasmids or with a plasmid containing only the ZNF domains of ROW (with FLAG‐tag). As a control, cells not transfected with ROW‐FLAG tagged plasmid were used. Western blot using αFLAG, αWOC, αBEAF‐32, αHP1c, and αTUB (loading control) antibodies is shown for input and IP samples.
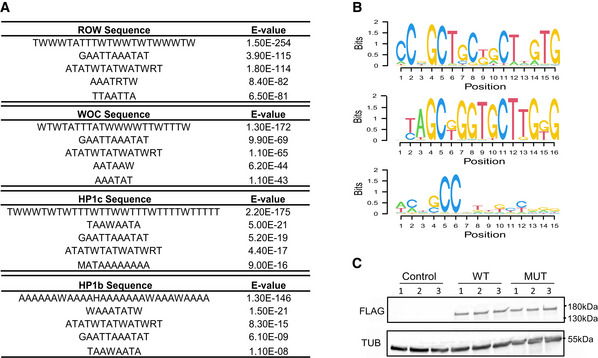
Top five centrally enriched sequences in ROW‐, WOC‐, HP1b‐, and HP1c‐binding sites in fly heads based on MEME‐ChIP tool.
Predicted DNA sequences for ROW‐ Cys2His2 zinc fingers under different models.
Validation of the expression of ROW‐FLAG tagged proteins in S2 cells transfected with WT, or AT‐hook mutant ROW‐FLAG tagged plasmids (MUT) by western blot. Control are cells not transfected with ROW‐FLAG tagged plasmids. Western blot was performed with αFlag tag and αTubulin (TUB) antibodies.
- A
BEAF‐32 consensus motif (logo) was enriched within ROW‐binding sites (MEME‐ChIP analysis). The plot (calculated with centriMo) shows that the probability of having the BEAF‐32 motif is highest around 100 bases from the center of the ROW ChIP‐seq peaks.
- B
The overlap between genes bound by ROW and genes bound by BEAF‐32 (based on ChIP‐seq results in S2 cells; n = 3 biological replicates).
- C
Example of average ChIP‐seq signal of ROW and BEAF‐32 at a representative region with annotation of genes (n = 3 biological replicates).
- D
The distribution of ROW and BEAF‐32 binding relative to the positions of TSSs. Occupancy is the average ChIP‐seq signal (n = 3 biological replicates).
- E, F
ChIP–qPCR results using ROW (E) or BEAF‐32 (F) antibody in S2 cells treated with dsRNA against row or BEAF‐32. Cells not treated with dsRNA were used as a control (n = 3, technical and biological replicates). The enrichment is relative to IgG for three biological replicates and five promoter regions bound by both ROW and BEAF‐32. The horizontal line represents the mean. Significance was calculated using a mixed model followed by the Tukey's post hoc test.
- G
Multiple logistic regression was used to compare the enrichment and independent influence of the proteins (ROW, WOC, HP1c, and HP1b) at TAD boundaries (based on ChIP‐seq results in fly heads). Values are the enrichment and influence beta coefficients ± standard error calculated by the HiCfeat R package (Mourad & Cuvier, 2016).
- H
The distribution of ROW and BEAF‐32 binding relative to the positions of TAD boundaries (based on ChIP‐seq results in S2 cells).
- I
Results of multiple logistic regression used to compare the enrichment and independent influence at TAD boundaries of BEAF‐32 and ROW (based on ChIP‐seq results in S2 cells) and promoters of housekeeping genes. Values are the enrichment and influence beta coefficients ± standard error calculated by the HiCfeat R package (Mourad & Cuvier, 2016).
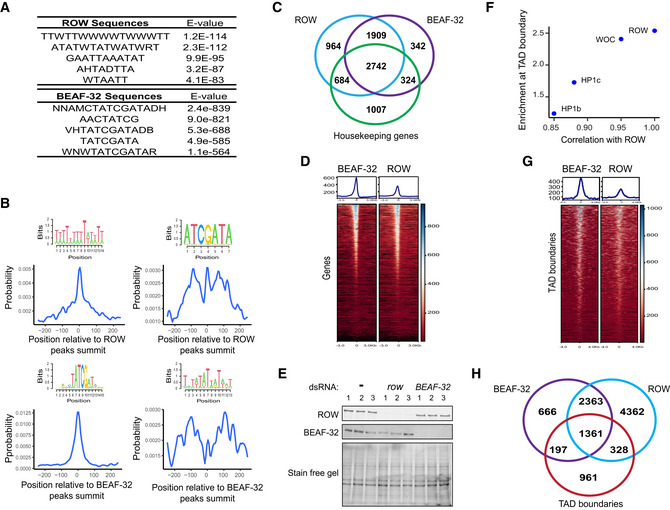
Top five centrally enriched sequences in ROW‐ and BEAF‐32‐binding sites in S2 cells based on MEME‐ChIP tool.
Central enrichment of AT‐rich sequences and BEAF‐32 consensus motifs (logo) in ROW‐binding regions (upper figures) and BEAF‐32‐binding regions (lower figures) in S2 cells. The plots show the probability of having the motif relative to ROW or BEAF‐32 ChIP‐seq peak's summits (calculated with centriMo).
Overlap between the genes bound by ROW, BEAF‐32, and housekeeping genes.
Heatmap of ROW and BEAF‐32 ChIP‐Seq signals in S2 cells ± 3 kb around TSS (average of n = 3 biological replicates).
Protein levels of ROW and BEAF‐32 in nontreated S2 cells (−) and cells treated with dsRNA against row or BEAF‐32. The stain‐free gel was used as a loading control.
Enrichment at TAD boundaries of ROW, WOC, HP1c, and HP1b () as a function of the correlation of the ChIP‐Seq signals in fly heads of the proteins with ROW.
Heatmap of ROW and BEAF‐32 ChIP‐Seq signals in S2 cells ± 4 kb around TAD boundaries (average of n = 3 biological replicates).
Overlap of the binding sites of ROW and BEAF‐32 with TAD boundaries.
- A
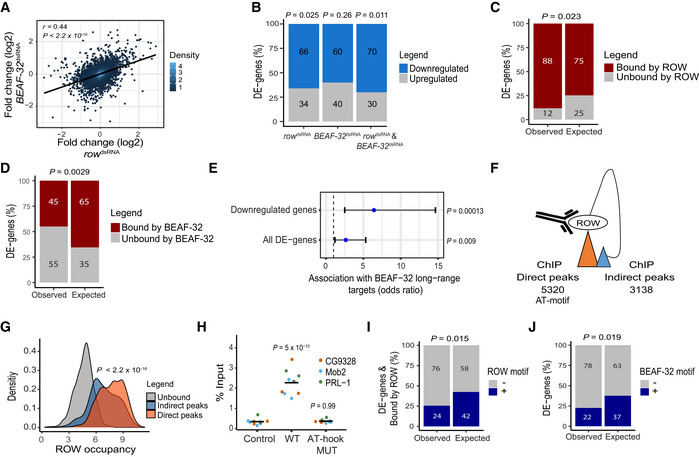
Relationship between the gene expression fold change (log2) in cells treated with row dsRNA and cells treated with BEAF‐32 dsRNA (n = 3, biological replicates). The fold change was calculated relative to control cells. Significance is based on a Pearson's correlation test.
- B
The percentage of differentially expressed genes (DE‐genes) upregulated and downregulated in row dsRNA‐, BEAF‐32 dsRNA‐, and row dsRNA‐ and BEAF‐32 dsRNA‐treated cells (n = 3, biological replicates). Significance was calculated using a two‐sided binomial test.
- C, D
The percentages of differentially expressed genes bound or unbound by (C) ROW or (D) BEAF‐32 and the expected values under an independence assumption. Significance was calculated using the Fisher's exact test.
- E
Association between the 51 differentially expressed genes in S2 cells with row and BEAF‐32 knockdown and previously published long‐range targets of BEAF‐32. Values are the odds ratio ± 95% confidence interval of the association between all genes or restricting the analysis to downregulated genes. Significance was calculated using the Fisher's exact test.
- F
Illustration of ROW ChIP direct and indirect peaks and their number.
- G
Density plots of ROW‐binding signal (ChIP‐seq) at promoters of genes unbound by ROW, promoters bound directly by ROW (with AT‐rich sequences), and promoters bound indirectly by ROW (without AT‐rich sequences). Significance was calculated using a t‐test.
- H
ChIP–qPCR results using FLAG‐tag antibody in S2 cells transfected with WT or AT‐hook mutant ROW‐FLAG tagged plasmids. Cells not transfected with ROW‐FLAG tagged plasmid were used as a control. Percentages of input are shown for three biological replicates and three promoters with an indirect binding of ROW (PRL‐1, Mob2, and CG9328). The horizontal line represents the mean. Significant was tested using a mixed model followed by the Tukey's post hoc test.
- I
The percentages of differentially expressed genes bound by ROW with or without ROW‐binding sequences (15 repeats of A or T) at the promoter regions and the expected values under an independent assumption. Significance was calculated using the Fisher's exact test.
- J
The percentages of differentially expressed genes with or without a BEAF‐32‐binding motif (TCGATA) at the promoter regions and the expected values under an independence assumption. Significance was calculated using the Fisher's exact test.
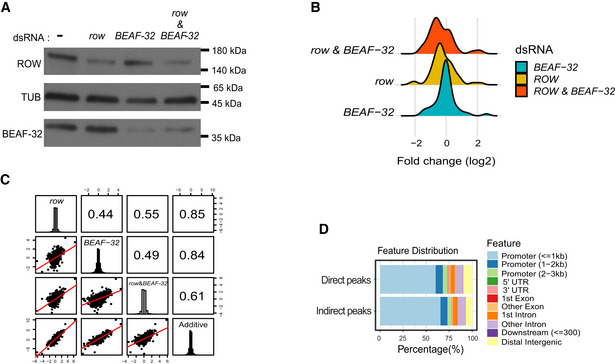
Protein levels of ROW and BEAF‐32 in nontreated S2 cells (−) and cells treated with dsRNA against row, BEAF‐32, or both. αTubulin (TUB) was used as a loading control.
Density plot of the gene expression fold changes (log2) in cells treated with row dsRNA, BEAF‐32 dsRNA, and row dsRNA & BEAF‐32 dsRNA, shown for significantly differentially expressed genes.
Pairwise correlation between the gene expression fold changes (log2) in cells treated with row dsRNA, BEAF‐32 dsRNA, row dsRNA and BEAF‐32 dsRNA, and the additive model (sum of fold change in the separate knockdowns of row and BEAF‐32). Fold changes were calculated relative to control cells (using edgeR). In the boxes of the upper triangle are the Pearson correlation coefficients. In the diagonal boxes are histograms showing the distributions of the fold changes. On the lower triangle, boxes are bivariate scatter plots with linear regression lines.
Genomic annotation of direct and indirect peaks of ROW shows that most are gene promoters.
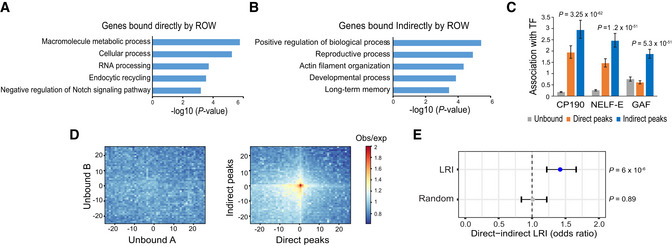
- A, B
The top 5 most significantly enriched biological processes (P‐value <0.001) for (A) genes bound directly and (B) indirectly by ROW, after removing redundant terms using the REVIGO tool.
- C
The association of three transcription factors (CP190, NELF‐E, and GAF) with genes unbound (n = 7,378), bound directly (n = 2,335), and bound indirectly by ROW (n = 3,176). Values are the odds ratios ± 95% confidence interval.
- D
Plot of aggregated Hi‐C submatrices of (left panel) random sets of promoters unbound by ROW, and (right panel) promoters bound directly and indirectly by ROW. The plots show the promoters in the center within a region of 50 kb divided into 50 bins (bin size = 1 kb). The values are the mean of observed/expected transformed submatrices (warm colors indicate higher values). The middle region on the right panel shows a high observed/expected value indicating a high level of long‐range interactions between promoters bound directly and indirectly by ROW.
- E
Significant enrichment of long‐range interactions (LRI) between direct (n = 5,320) and indirect ROW peaks (n = 3,138) but not between randomly generated interactions. The association tests within the interactions identified in Hi‐C data were performed using the PSYCHIC tool (Ron et al, 2017). Values are the odds ratios ±95% confidence interval. Significance was calculated using the Fisher's exact test.
References
-
- Blecher‐Gonen R, Barnett‐Itzhaki Z, Jaitin D, Amann‐Zalcenstein D, Lara‐Astiaso D, Amit I (2013) High‐throughput chromatin immunoprecipitation for genome‐wide mapping of in vivo protein‐DNA interactions and epigenomic states. Nat Protoc 8: 539–554 - PubMed
Publication types
MeSH terms
Substances
Associated data
- Actions
- Actions
- Actions
- Actions
- Actions
LinkOut - more resources
Full Text Sources
Molecular Biology Databases
Research Materials
