. 2022 Sep 28:9:987400.
doi: 10.3389/fnut.2022.987400. eCollection 2022.

Limosilactobacillus reuteri FN041 prevents atopic dermatitis in pup mice by remodeling the ileal microbiota and regulating gene expression in Peyer's patches after vertical transmission

Affiliations

Limosilactobacillus reuteri FN041 prevents atopic dermatitis in pup mice by remodeling the ileal microbiota and regulating gene expression in Peyer's patches after vertical transmission

Jingbo Zhou et al. Front Nutr. .

Abstract

Objectives: Limosilactobacillus reuteri FN041 is a potential probiotic bacterium isolated from breast milk in traditional farming and pastoral areas of China. The purpose of this study was to investigate the optimal intervention mode and potential mechanism of FN041 to prevent atopic dermatitis (AD) in mice.

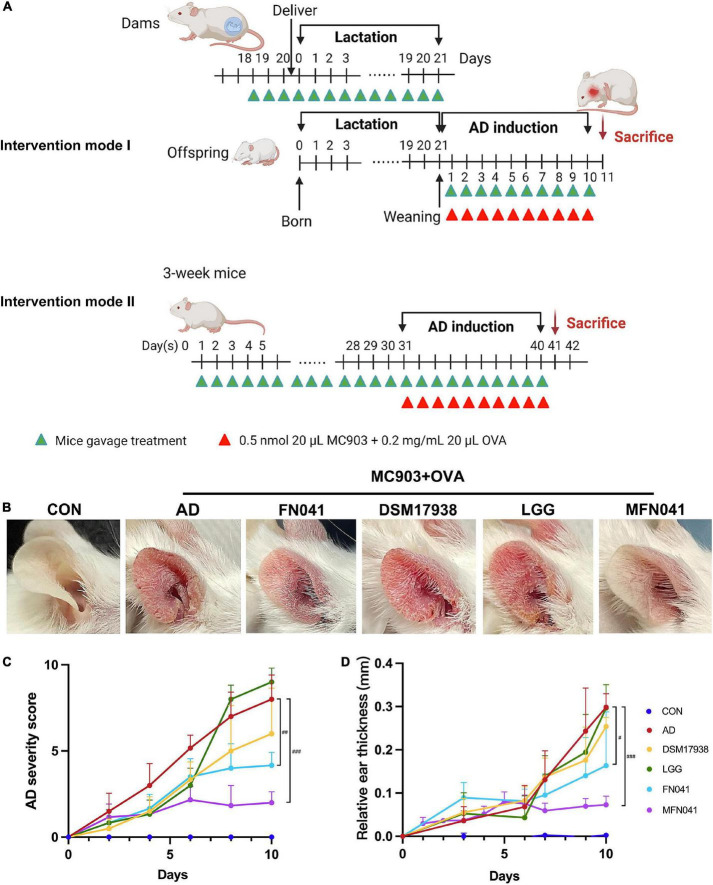
Methods: In intervention mode I, FN041 was supplemented to dams during the late trimester and lactation and pups after weaning; in intervention mode II, FN041 was supplemented after pups were weaned. AD was induced in pups with MC903 plus ovalbumin on the ear after weaning.

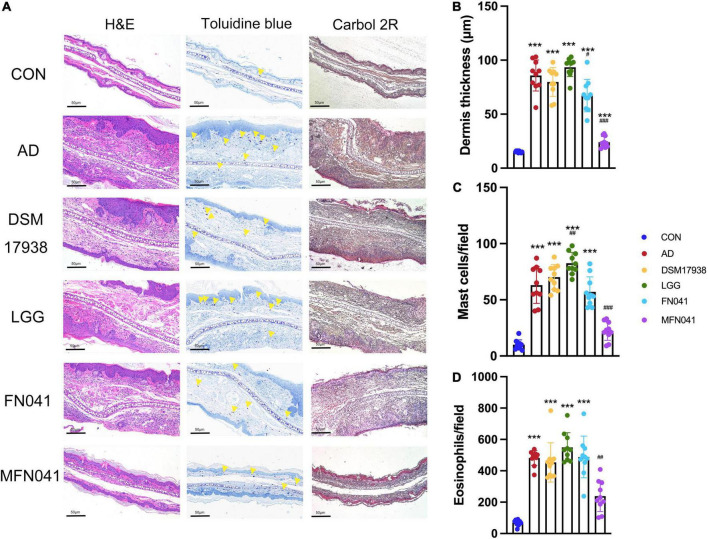
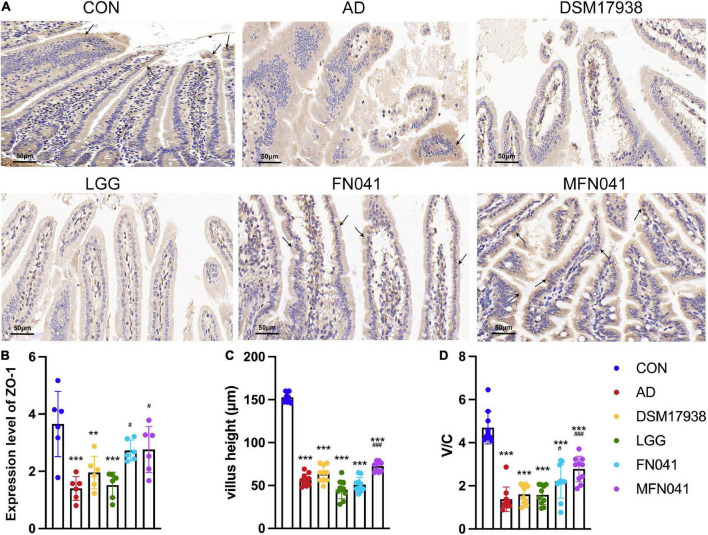
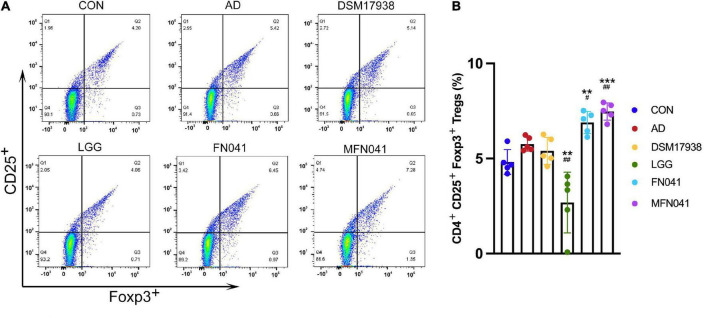
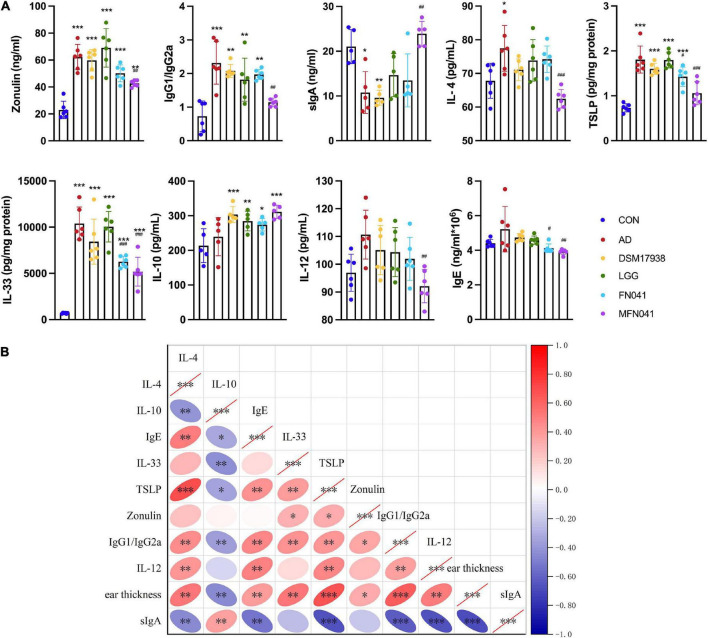
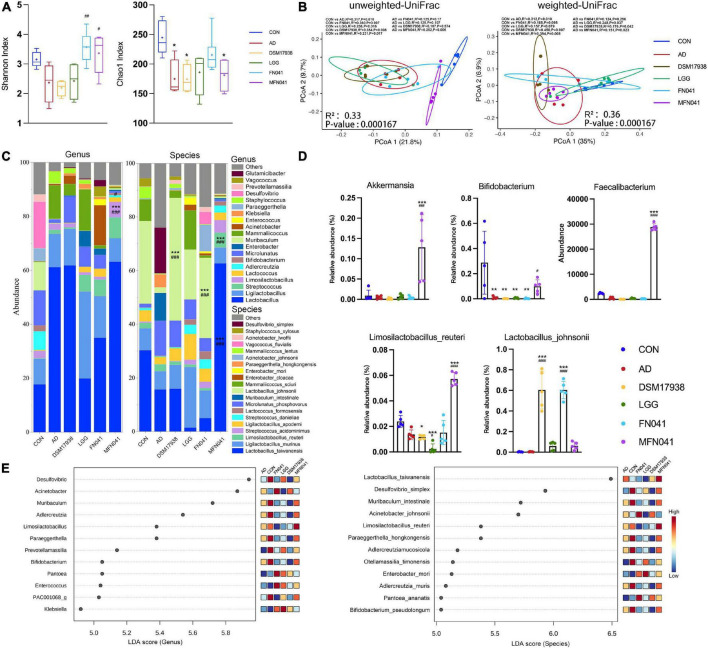
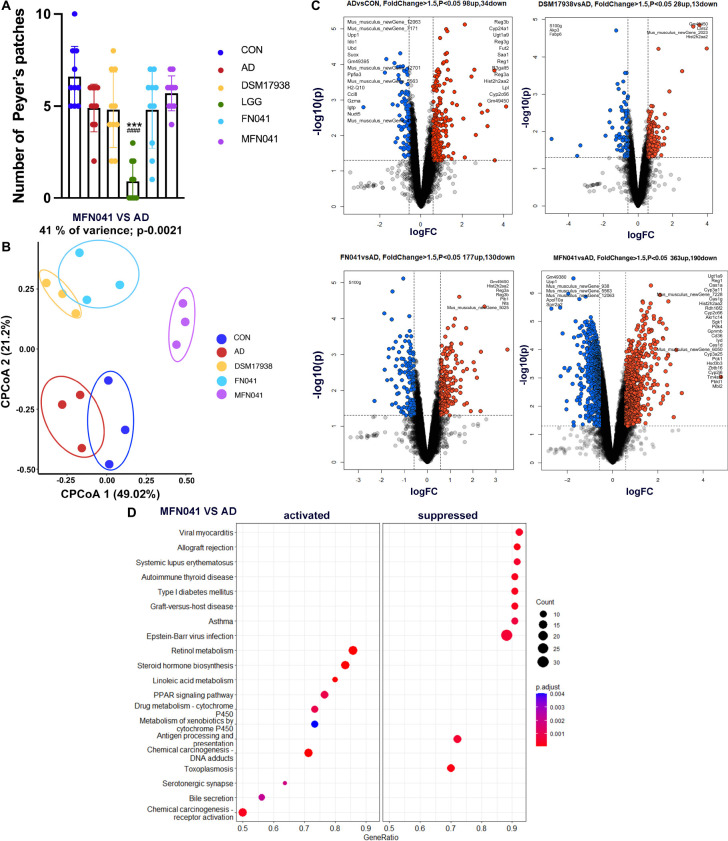
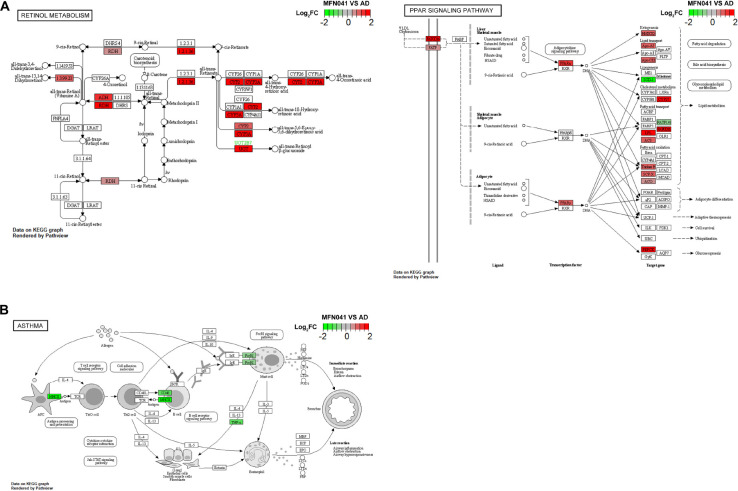
Results: The effect of intervention mode I in preventing AD was significantly better than that of intervention mode II. Compared with the model group, the inflammatory response of the pup's ears, the proportion of spleen regulatory T cells and the plasma IgE were significantly decreased in mice in intervention mode I. Furthermore, the intestinal mucosal barrier was enhanced, and the Shannon index of the ileal microbiota was significantly increased. The microbiota structure deviated from the AD controls and shifted toward the healthy controls according to the PCoA of unweighted UniFrac. The relative abundances of Limosilactobacillus, Faecalibacterium, Bifidobacterium, and Akkermansia in the ileum were significantly increased compared to the AD group. Based on RNA-seq analysis of pups' Peyer's patches (PPs), FN041 inhibits autoimmune pathways such as asthma and systemic lupus erythematosus and activates retinol metabolism and PPAR signaling pathways to reduce inflammatory responses. Intervention mode II also significantly reduced AD severity score, but the reduction was approximately 67% of that of intervention mode I. This may be related to its ineffective remodeling of the ileal microbiota.

Conclusion: Prenatal and postnatal administration of FN041 is an effective way to prevent AD in offspring, and its mechanism is related to remodeling of ileal microbiota and PPs immune response.

Keywords: Limosilactobacillus reuteri; Peyer’s patches; atopic dermatitis; ileal mucosal barrier; regulatory T cells; retinol metabolism; vertical transmission.


Conflict of interest statement

The authors declare that the research was conducted in the absence of any commercial or financial relationships that could be construed as a potential conflict of interest.

Figures

FIGURE 1
FIGURE 1
Effect of different intervention modes on MC903 plus OVA-induced symptoms of atopic dermatitis in mice. (A) Procedure for two intervention modes. (B) Gross appearances of the ears on day 10 after AD induction. (C) AD severity score, including the number of scratching bouts, erythema/hemorrhage, eruption, edema and scaling-like changes in the ear on a scale of 0–10, with higher scores indicating more severe AD symptoms (n = 12). (D) Ear thickness relative to that of day 0 after MC903 plus OVA induction (n = 12). #P < 0.05, ##P < 0.01, ###P < 0.001 vs. AD group (one-way ANOVA test). CON, normal control mice supplemented with sanitary saline; AD, supplementation with sanitary saline after weaning of pups before AD induction; DSM17938, supplementation with DSM17938 after weaning of pups before AD induction; LGG, supplementation with LGG after weaning of pups before AD induction; FN041, supplementation with FN041 after weaning of pups before AD induction; MFN041, FN041 supplementation in dams during the late trimester and lactation period and after weaning of pups before AD induction.
FIGURE 2
FIGURE 2
Effect of different intervention modes on ear inflammation in mice with atopic dermatitis. (A) Histology of the skin lesions. Hematoxylin and eosin (H&E) staining showed the thickness of the dermis, toluidine blue staining showed the infiltration of mast cells, and Carbol 2R hematoxylin indicated eosinophils. (B) H&E staining shows the thickness of the dermis in 10 random fields of view of mice ear sections. (C) Mast cells are indicated by yellow triangles on the images, and their numbers represent the number of mast cells in 10 random fields of view of mouse ear sections. (D) Eosinophils are the number of cells in 10 random fields of view of mice ear sections. ***P < 0.001 vs. CON group; #P < 0.05, ##P < 0.01, ###P < 0.001 vs. AD group (one-way ANOVA test). CON, normal control mice supplemented with sanitary saline; AD, supplementation with sanitary saline after weaning of pups before AD induction; DSM17938, supplementation with DSM17938 after weaning of pups before AD induction; LGG, supplementation with LGG after weaning of pups before AD induction; FN041, supplementation with FN041 after weaning of pups before AD induction; MFN041, FN041 supplementation in dams during the late trimester and lactation period and after weaning of pups before AD induction.
FIGURE 3
FIGURE 3
Effects of different intervention modes on the ileal mucosal barrier and histomorphology. (A) Immunohistochemistry showing ZO-1 expression (black arrows) in the ileal mucosa of mice in each group. (B) The expression level of ZO-1 in the ileum (n = 6). (C) Mouse ileal villus height expressed as height in 10 random fields of mouse ear slices. (D) The ratio of ileal villus height to crypt depth. **P < 0.01, ***P < 0.001 vs. CON group; #P < 0.05, ###P < 0.001 vs. AD group (one-way ANOVA test). CON, normal control mice supplemented with sanitary saline; AD, supplementation with sanitary saline after weaning of pups before AD induction; DSM17938, supplementation with DSM17938 after weaning of pups before AD induction; LGG, supplementation with LGG after weaning of pups before AD induction; FN041, supplementation with FN041 after weaning of pups before AD induction; MFN041, FN041 supplementation in dams during the late trimester and lactation period and after weaning of pups before AD induction.
FIGURE 4
FIGURE 4
Effect of different intervention modes on regulatory T-cell of spleen of mice with atopic dermatitis induction. (A) Isolated cells were obtained from the spleens of different groups of mice. (B) Based on the spleen cell percentage, CD4+ CD25+ Foxp3+ cells were calculated. A Kruskal-Wallis analysis was performed between all groups (n = 5). **P < 0.01, ***P < 0.001 vs. CON group; #P < 0.05, ##P < 0.01 vs. AD group. CON, normal control mice supplemented with sanitary saline; AD, supplementation with sanitary saline after weaning of pups before AD induction; DSM17938, supplementation with DSM17938 after weaning of pups before AD induction; LGG, supplementation with LGG after weaning of pups before AD induction; FN041, supplementation with FN041 after weaning of pups before AD induction; MFN041, FN041 supplementation in dams during the late trimester and lactation period and after weaning of pups before AD induction.
FIGURE 5
FIGURE 5
Cytokine levels in mice plasma and ear tissue. (A) Zonulin, IL-12, IgG1/IgG2a, IL-4, sIgA, IL-10, IgE in plasma and TSLP, IL-33 in ear tissue. *P < 0.05, **P < 0.01, ***P < 0.001 vs. CON group; #P < 0.05, ##P < 0.01, ###P < 0.001 vs. AD group (one-way ANOVA test) (n = 5–6). (B) Spearman correlation analysis was performed for cytokines in mice, with red indicating positive correlation and blue indicating negative correlation, with darker colors representing stronger correlation. The right slope of the ellipse represents a negative correlation, and the left slope represents a positive correlation. The flatter the ellipse, the more significant it is. *P < 0.05, **P < 0.01, ***P < 0.001. CON, normal control mice supplemented with sanitary saline; AD, supplementation with sanitary saline after weaning of pups before AD induction; DSM17938, supplementation with DSM17938 after weaning of pups before AD induction; LGG, supplementation with LGG after weaning of pups before AD induction; FN041, supplementation with FN041 after weaning of pups before AD induction; MFN041, FN041 supplementation in dams during the late trimester and lactation period and after weaning of pups before AD induction.
FIGURE 6
FIGURE 6
Effect of different intervention modes on ileal microbiota in AD mice. (A) Alpha diversity is measured by the chao1 index and Shannon index (n = 5). (B) Principal coordinate analysis (PCoA) score plots based on unweighted- UniFrac and weighted-UniFrac distance and permutational multivariate analysis of variance (PERMANOVA) was used to test the difference between groups at the OTU level. (C,D) Mean relative abundance of genus level and species level. (E) Taxa are significantly different between groups based on LEfSe analysis (LDA score > 4). *P < 0.05, **P < 0.01, ***P < 0.001 vs. CON group; #P < 0.05, ##P < 0.01, ###P < 0.001 vs. AD group (n = 5). CON, normal control mice supplemented with sanitary saline; AD, supplementation with sanitary saline after weaning of pups before AD induction; DSM17938, supplementation with DSM17938 after weaning of pups before AD induction; LGG, supplementation with LGG after weaning of pups before AD induction; FN041, supplementation with FN041 after weaning of pups before AD induction; MFN041, FN041 supplementation in dams during the late trimester and lactation period and after weaning of pups before AD induction.
FIGURE 7
FIGURE 7
(A) Spearman’s correlation coefficients between pro-inflammatory chemokines and cytokines and changes in the relative abundance of individual genera. Positive correlations are shown in red and negative correlations are shown in blue. Darker colors indicate stronger correlations. The False Discovery Rate was used to correct P-values for multiple testing. *P < 0.05, **P < 0.01, ***P < 0.001. (B) Gene prediction of intestinal flora function of mice (n = 5). CON, normal control mice supplemented with sanitary saline; AD, supplementation with sanitary saline after weaning of pups before AD induction; DSM17938, supplementation with DSM17938 after weaning of pups before AD induction; LGG, supplementation with LGG after weaning of pups before AD induction; FN041, supplementation with FN041 after weaning of pups before AD induction; MFN041, FN041 supplementation in dams during the late trimester and lactation period and after weaning of pups before AD induction.
FIGURE 8
FIGURE 8
(A) The number of PPs (n = 10); (B) CPCoA, (C) Volcano plot, (D) KEGG enrichment scatter diagram of differently expressed genes for transcriptome analysis of PPs of offspring mice (n = 3). Data are shown as mean ± SD and compared by Student’s t-test; ***P < 0.001 vs. CON group; ###P < 0.001 vs. AD group. CON, normal control mice supplemented with sanitary saline; AD, supplementation with sanitary saline after weaning of pups before AD induction; DSM17938, supplementation with DSM17938 after weaning of pups before AD induction; LGG, supplementation with LGG after weaning of pups before AD induction; FN041, supplementation with FN041 after weaning of pups before AD induction; MFN041, FN041 supplementation in dams during the late trimester and lactation period and after weaning of pups before AD induction.
FIGURE 9
FIGURE 9
(A) KEGG pathway graph of retinol metabolism and PPAR signaling pathway, (B) asthma rendered by Pathview (n = 3), red for activation, green for inhibition. CON, normal control mice supplemented with sanitary saline; AD, supplementation with sanitary saline after weaning of pups before AD induction; DSM17938, supplementation with DSM17938 after weaning of pups before AD induction; LGG, supplementation with LGG after weaning of pups before AD induction; FN041, supplementation with FN041 after weaning of pups before AD induction; MFN041, FN041 supplementation in dams during the late trimester and lactation period and after weaning of pups before AD induction.

Similar articles

Cited by

References

    1. Weidinger S, Novak N. Atopic dermatitis. Lancet. (2016) 387:1109–22. 10.1016/S0140-6736(15)00149-X - DOI - PubMed
    1. David Boothe W, Tarbox JA, Tarbox MB. Atopic dermatitis: pathophysiology. Adv Exp Med Biol. (2017) 1027:21–37. 10.1007/978-3-319-64804-0_3 - DOI - PubMed
    1. Lin S, Mukherjee S, Li J, Hou W, Pan C, Liu J. Mucosal immunity-mediated modulation of the gut microbiome by oral delivery of probiotics into Peyer’s patches. Sci Adv. (2021) 7:eabf0677. 10.1126/sciadv.abf0677 - DOI - PMC - PubMed
    1. Liu H-Y, Giraud A, Seignez C, Ahl D, Guo F, Sedin J, et al. Distinct B cell subsets in Peyer’s patches convey probiotic effects by Limosilactobacillus reuteri. Microbiome. (2021) 9:198. 10.1186/s40168-021-01128-4 - DOI - PMC - PubMed
    1. Mantis NJ, Cheung MC, Chintalacharuvu KR, Rey J, Corthésy B, Neutra MR. Selective adherence of IgA to murine Peyer’s patch M cells: evidence for a novel IgA receptor. J Immunol. (2002) 169:1844–51. 10.4049/jimmunol.169.4.1844 - DOI - PubMed

LinkOut - more resources