. 2022 Sep 29:2022:8213723.
doi: 10.1155/2022/8213723. eCollection 2022.

An Integrative Multi-Omics Analysis Based on Nomogram for Predicting Prostate Cancer Bone Metastasis Incidence

Affiliations

An Integrative Multi-Omics Analysis Based on Nomogram for Predicting Prostate Cancer Bone Metastasis Incidence

Jun Zhao et al. Genet Res (Camb). .

Abstract

Background: The most common site of prostate cancer metastasis is bone tissue with many recent studies having conducted genomic and clinical research regarding bone metastatic prostate cancer. However, further work is needed to better define those patients that are at an elevated risk of such metastasis.

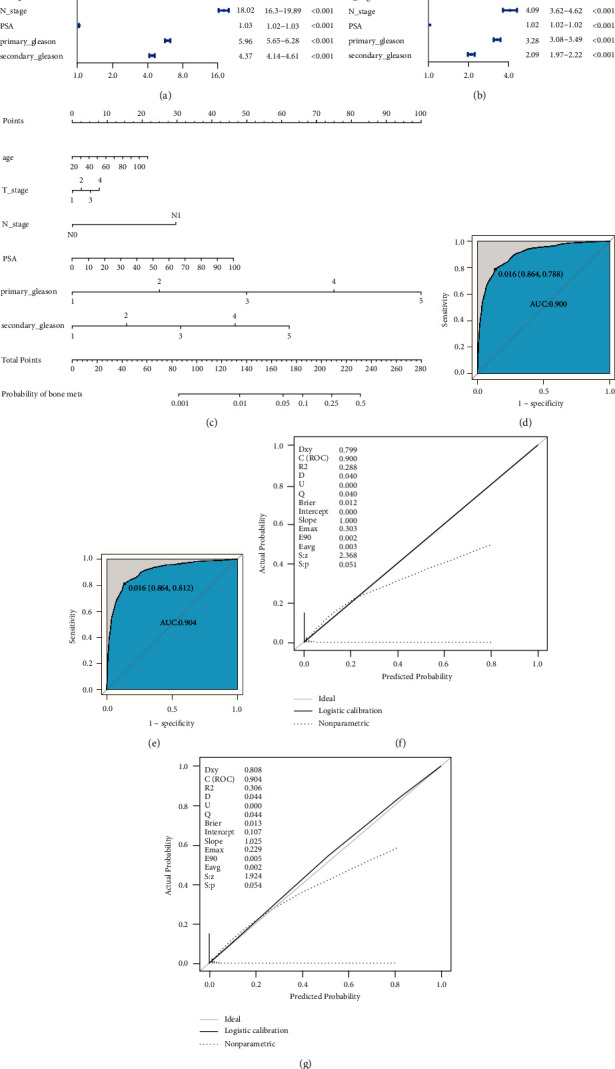
Methods: SEER and TCGA databases were searched to develop a nomogram for predicting prostate cancer bone metastasis.

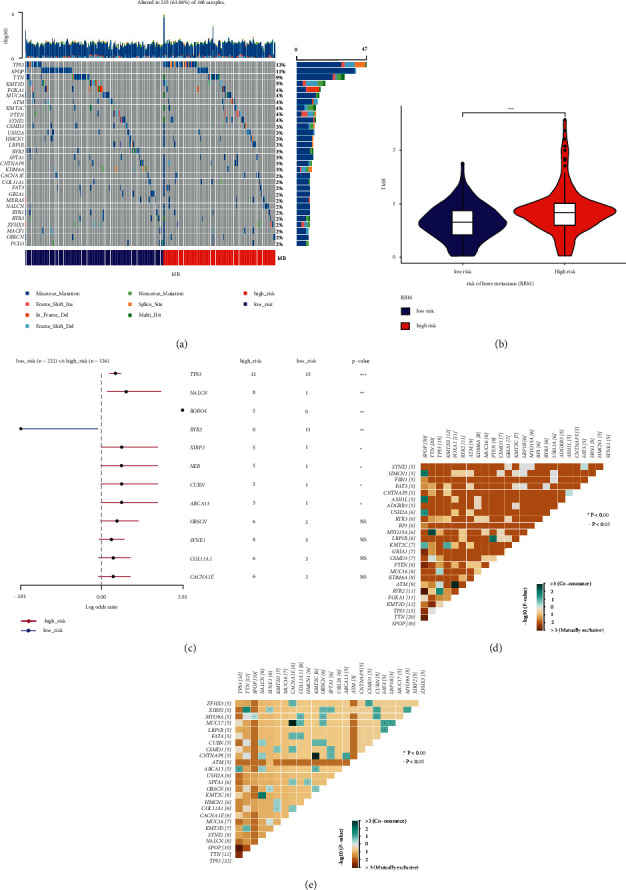
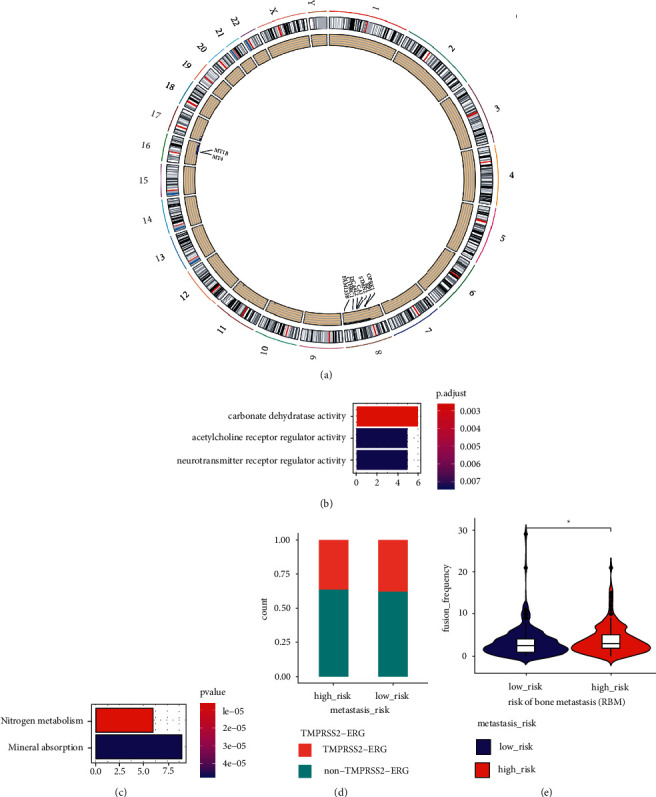
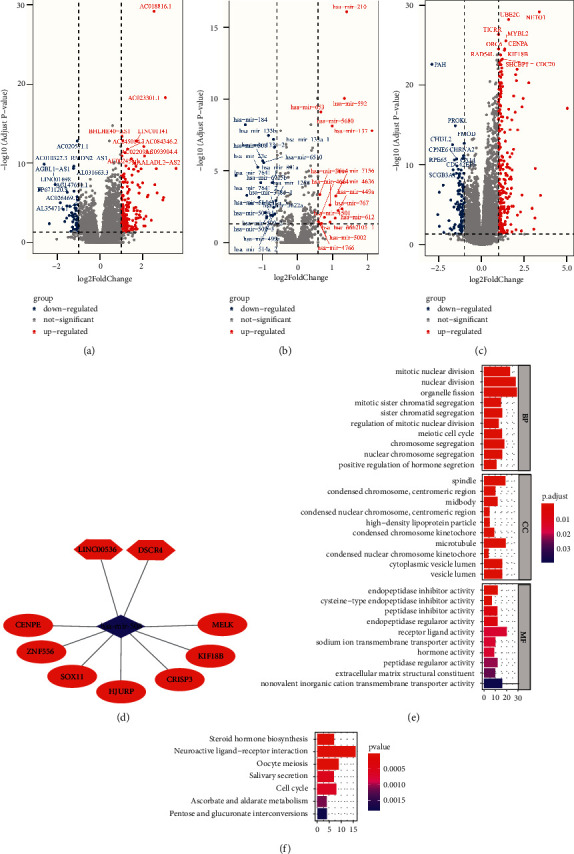
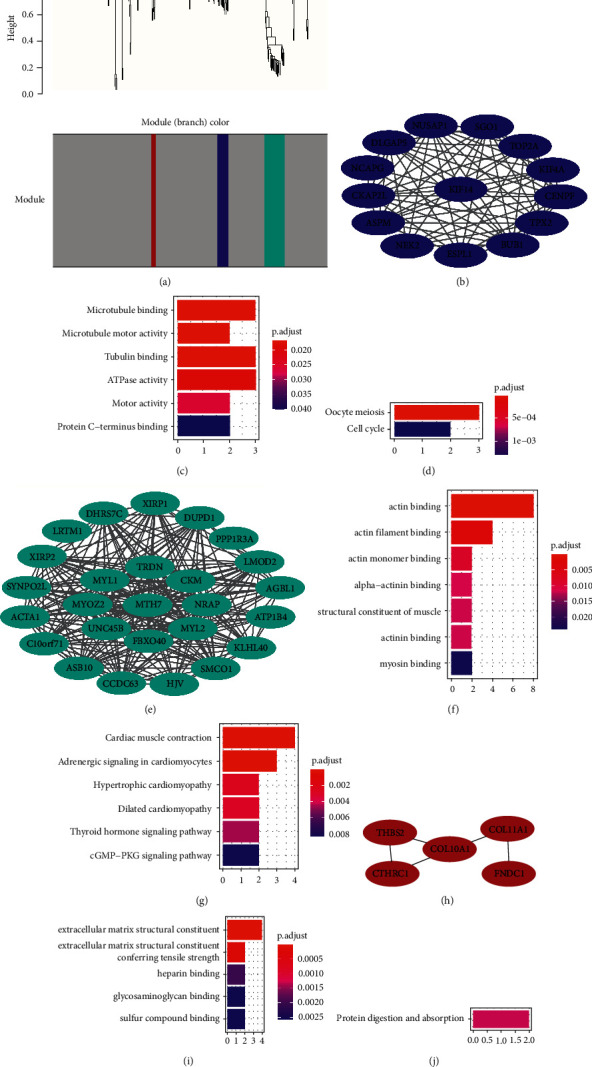
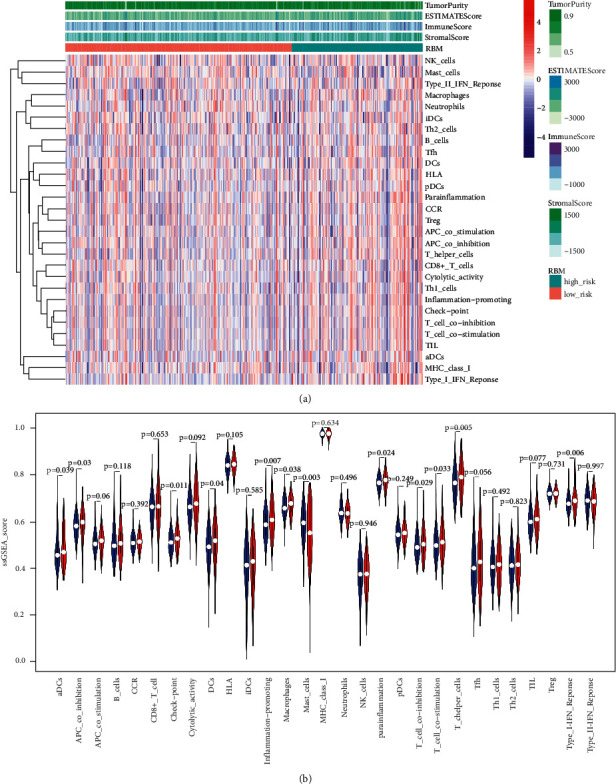
Results: Herein, we leveraged the Surveillance, Epidemiology, and End Results (SEER) database to construct a predictive nomogram capable of readily and accurately predicted the odds of bone metastasis in prostate cancer patients. This nomogram was utilized to assign patients with prostate cancer included in The Cancer Genome Atlas (TCGA) to cohorts at a high or low risk of bone metastasis (HRBM and LRBM, respectively). Comparisons of these LRBM and HRBM cohorts revealed marked differences in mutational landscapes between these patient cohorts, with increased frequencies of gene fusions, somatic copy number variations (CNVs), and single nucleotide variations (SNVs), particularly in the P53 gene, being evident in the HRBM cohort. We additionally identified lncRNAs, miRNAs, and mRNAs that were differentially expressed between these two patient cohorts and used them to construct a competing endogenous RNA (ceRNA) network. Moreover, three weighted gene co-expression network analysis (WGCNA) modules were constructed from the results of these analyses, with KIF14, MYH7, and COL10A1 being identified as hub genes within these modules. We further found immune response activity levels in the HRBM cohort to be elevated relative to that in the LRBM cohort, with single sample gene enrichment analysis (ssGSEA) scores for the immune checkpoint signature being increased in HRBM patient samples relative to those from LRBM patients.

Conclusion: We successfully developed a nomogram capable of readily detecting patients with prostate cancer at an elevated risk of bone metastasis.


Conflict of interest statement

The authors state that there are no conflicts of interest to declare.

Figures

Figure 1
Figure 1
Construction of a nomogram capable of predicting prostate cancer patient bone metastasis. (a) Forest plot results corresponding to a univariate logistic regression model analysis of bone metastasis risk. (b) Forest plot results corresponding to a multivariate logistic regression model analysis of bone metastasis risk. The x-axis corresponds to the OR for bone metastasis. OR: odds ratio. CI: confidence interval. (c) A nomogram used to predict the odds of prostate cancer patient bone metastasis based on patient age, T_stage, N_stage, PSA, primary Gleason score, and secondary Gleason score. To use the nomogram, a straight line was drawn upwards from the appropriate point on each variable axis to the score axis, with the points for each of these predictors being summed together. The total sum score was then used to judge the odds of bone metastasis for that patient by drawing a line downwards. (d) ROC curves for the predictive nomogram in the training cohort (ROC curve AUC = 0.9; cutoff = 0.016; sensitivity = 0.864; specificity = 0.788). (e) ROC curves for the predictive nomogram in the validation cohort (ROC curve AUC = 0.904; cutoff = 0.016; sensitivity = 0.864; specificity = 0.812). (f) Calibration models for the predictive model when used to analyze the training cohort, with the actual and predicted probability being graphed against one another. (g) Calibration models for the predictive model when used to analyze the validation cohort. In the calibration curves, the reference line corresponds to perfect concordance between predicted and actual odds of bone metastasis.
Figure 2
Figure 2
SNV comparisons in patients at a low and high risk of bone metastasis. (a) Mutational landscape profile for prostate cancer patient samples, with the waterfall plot being used to show mutational information for each gene, while colors with specific annotations along the bottom of the plot denote specific types of mutations. Mutational burden is shown in a bar plot above the legend. MB, metastasis of bone. (b) TMB value for the LRBM and HRBM cohorts. Violin plots represent TMB values as dots, with a box plot being present within this violin plot. P < 0.05, ∗∗P < 0.01, ∗∗∗P < 0.001; two-sided Mann–Whitney U test. (c) Differentially mutated genes were compared between the LRBM and HRBM cohorts with the “mafCompare” function in the R “maftools” package. P < 0.05, ∗∗P < 0.01, ∗∗∗P < 0.001. (d-e) Coincident and exclusive associations among mutated genes within the (d) LRBM and (e) HRBM cohorts.
Figure 3
Figure 3
Comparisons of CNV and gene fusion frequencies in the HRBM and LRBM cohorts. (a) CNVs with different mutational frequencies in the LRBM and HRBM patient cohorts, with the inner circle presenting a scatter plot of the 676 CNVs that were differentially frequent in these two cohorts, and the outer circle corresponding to the locations of these genes on specific chromosomes. Those genes harboring CNVs that were also significantly differentially expressed between these two cohorts are marked within the circle. (b-c) GO (b) and KEGG (c) analyses of genes containing CNVs at different frequencies in the LRBM and HRBM cohorts, with enriched terms being shown on the left and bar plots on the right corresponding to the number of genes associated with the indicated term. Bar coloration is based on the P value for the corresponding term. (d) Frequencies of TMPRSS2-ERG gene fusions in the LRBM and HRBM cohorts, with the y-axis corresponding to the TMPRSS2-ERG gene fusion proportion. (e) Frequencies of gene fusions in the LRBM and HRBM cohorts. Violin plots show gene fusion frequencies in individual samples as dots, with boxplots being drawn within violin plots. P < 0.05, ∗∗P < 0.01, ∗∗∗P < 0.001; two-sided Mann–Whitney U test.
Figure 4
Figure 4
Generation of a bone metastasis-related ceRNA network. (a-c) Differentially expressed lncRNAs (a), miRNAs (b), and mRNAs (c) identified when comparing the LRBM and HRBM cohorts. The top 10 upregulated and downregulated genes are shown for each category, with horizontal lines corresponding to an adjusted P value of 0.05. (a, c) Vertical lines correspond to a log2 (fold change) at −1 and 1. (b) Vertical lines correspond to a log2 (fold change) at −0.58 and 0.58. (d) A ceRNA network was generated in which lncRNAs, miRNAs, and mRNAs were represented by hexagons, rhombuses, and ovals, respectively. (e) Enriched GO terms associated with mRNAs differentially expressed between the LRBM and HRBM cohorts, with the top 10 terms in each of three categories being shown. BP: biological processes. CC: cell component. MF: molecular function. (f) KEGG enrichment analyses for mRNAs differentially expressed in the HRBM and LRBM cohorts. The brown module was composed of five genes that were upregulated in HRBM patient samples, among which COL10A1 was the hub gene (Figure 5(h)). These five genes were enriched for GO terms including extracellular matrix structural constituent, extracellular matrix structural constituent conferring tensile strength, heparin binding, glycosaminoglycan binding, and sulfur compound binding (Figure 5(i)), as well as the protein digestion and absorption of KEGG pathway (Figure 5(j)). In the brown module PPI network, COL11A1 and COL10A1 were predicted to interact (Figure S2(e)).
Figure 5
Figure 5
Bone metastasis-related gene module identification. (a) A dendrogram generated via the clustering of dissimilarity based on consensus topological overlap with corresponding modules being shown based on the colored rows corresponding to modules containing genes that were highly connected with one another. (b) Blue module co-expression network, with the hub gene in the network center. (c) GO analysis of genes in the blue module. (d) KEGG analysis of genes in the blue module. (e) Turquoise module co-expression network, with the hub gene in the network center. (f) GO analysis of genes in the turquoise module. (g) KEGG analysis of genes in the turquoise module. (h) Brown module co-expression network, with the hub gene in the network center. (i) GO analysis of genes in the brown module. (j) KEGG analysis of genes in the brown module.
Figure 6
Figure 6
Relationship between immunological microenvironment and the odds of bone metastasis. (a) A hierarchical clustering analysis of 367 TCGA prostate cancer samples based on 29 immune-related gene sets. Tumor purity, ESTIMATE, immune, and stromal scores were determined using ESTIMATE. RBM: risk of bone metastasis. (b) ssGSEA score comparisons in the LRBM and HRBM cohorts for 29 immune-related gene sets. P < 0.05, ∗∗P < 0.01, ∗∗∗P < 0.001; two-sided Mann–Whitney U test.

Similar articles

Cited by

References

    1. Bray F., Ferlay J., Soerjomataram I., Siegel R. L., Torre L. A., Jemal A. Global cancer statistics 2018: GLOBOCAN estimates of incidence and mortality worldwide for 36 cancers in 185 countries. CA: A Cancer Journal for Clinicians . 2018;68(6):394–424. doi: 10.3322/caac.21492. - DOI - PubMed
    1. Halabi S., Kelly W. K., Ma H., et al. Meta-analysis evaluating the impact of site of metastasis on overall survival in men with castration-resistant prostate cancer. Journal of Clinical Oncology . 2016;34(14):1652–1659. doi: 10.1200/jco.2015.65.7270. - DOI - PMC - PubMed
    1. Cancer Genome Atlas Research N. The molecular taxonomy of primary prostate cancer. Cell . 2015;163:1011–1025. - PMC - PubMed
    1. Li J., Xu C., Lee H. J., et al. A genomic and epigenomic atlas of prostate cancer in Asian populations. Nature . 2020;580(7801):93–99. doi: 10.1038/s41586-020-2135-x. - DOI - PubMed
    1. Liu D., Kuai Y., Zhu R., et al. Prognosis of prostate cancer and bone metastasis pattern of patients: a SEER-based study and a local hospital based study from China. Scientific Reports . 2020;10(1):p. 9104. doi: 10.1038/s41598-020-64073-6. - DOI - PMC - PubMed

Publication types