. 2022 Jun 22;3(9):1578-1589.
doi: 10.34067/KID.0007352021. eCollection 2022 Sep 29.

Critical Role of Osteopontin in Maintaining Urinary Phosphate Solubility in CKD

Affiliations

Critical Role of Osteopontin in Maintaining Urinary Phosphate Solubility in CKD

Jason R Stubbs et al. Kidney360. .

Abstract

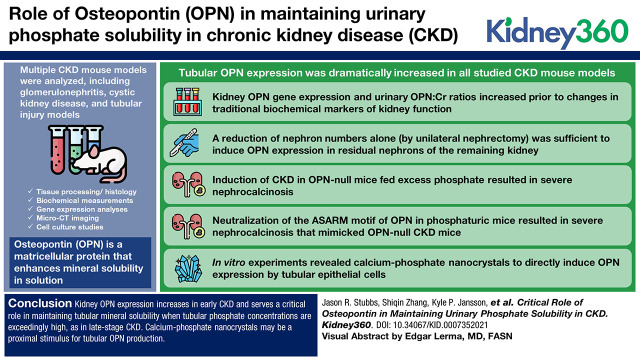
Background: Nephron loss dramatically increases tubular phosphate to concentrations that exceed supersaturation. Osteopontin (OPN) is a matricellular protein that enhances mineral solubility in solution; however, the role of OPN in maintaining urinary phosphate solubility in CKD remains undefined.

Methods: Here, we examined (1) the expression patterns and timing of kidney/urine OPN changes in CKD mice, (2) if tubular injury is necessary for kidney OPN expression in CKD, (3) how OPN deletion alters kidney mineral deposition in CKD mice, (4) how neutralization of the mineral-binding (ASARM) motif of OPN alters kidney mineral deposition in phosphaturic mice, and (5) the in vitro effect of phosphate-based nanocrystals on tubular epithelial cell OPN expression.

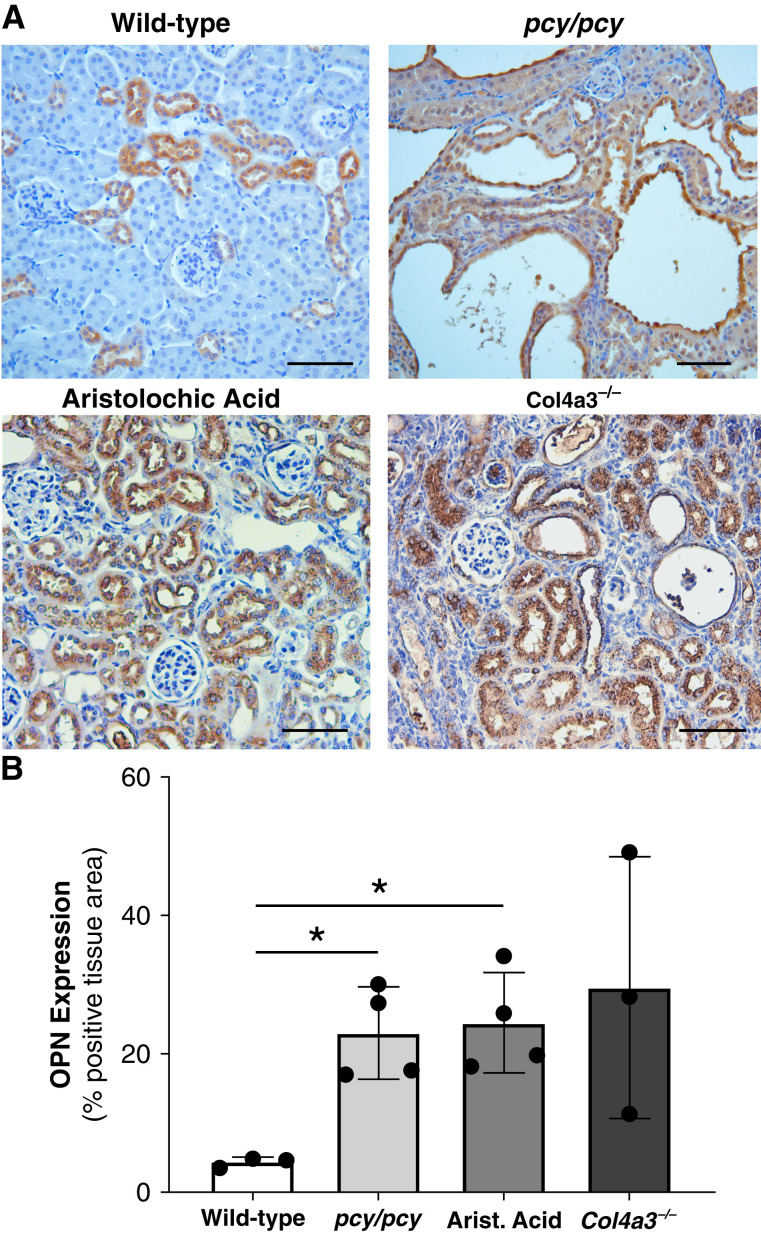
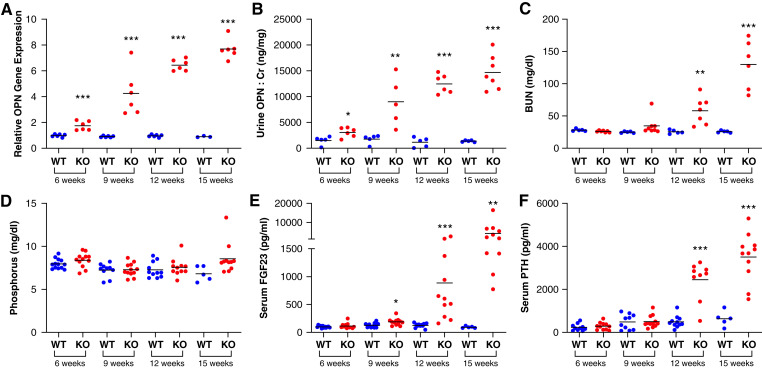
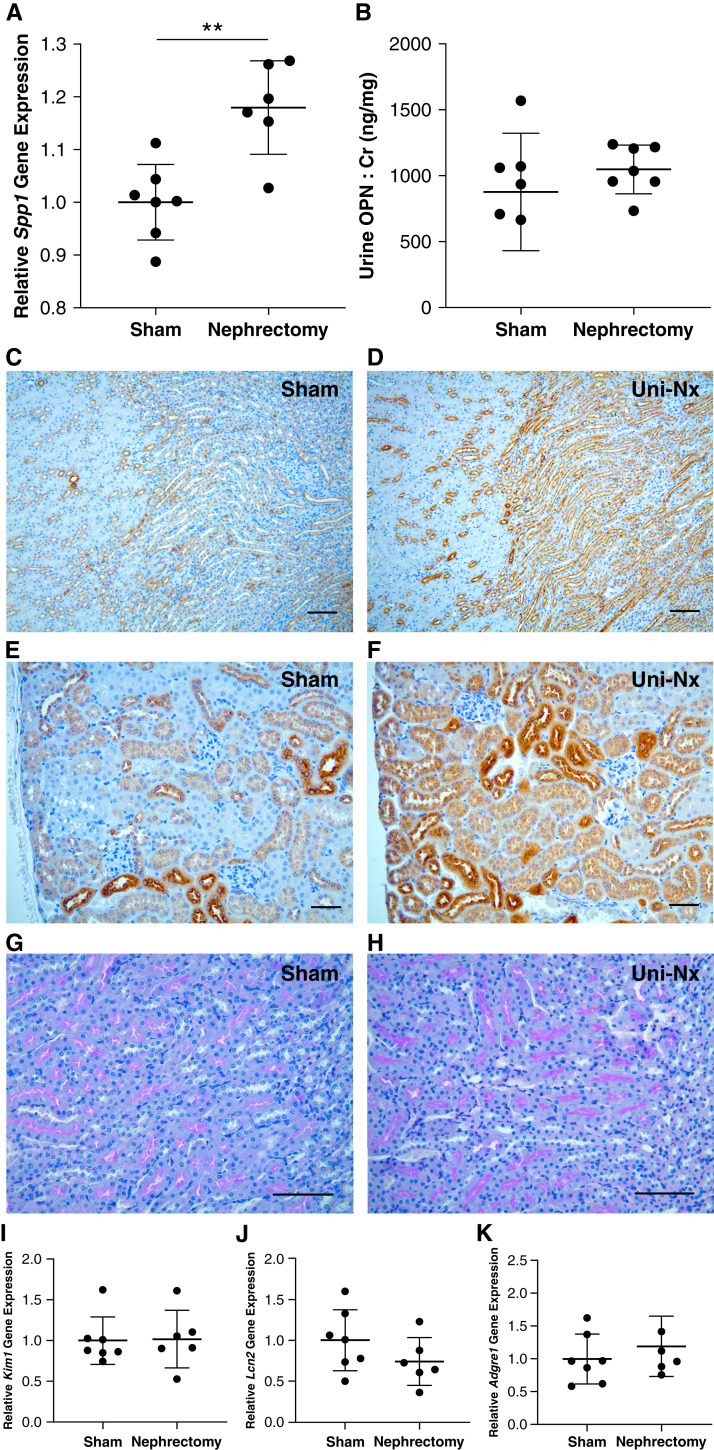
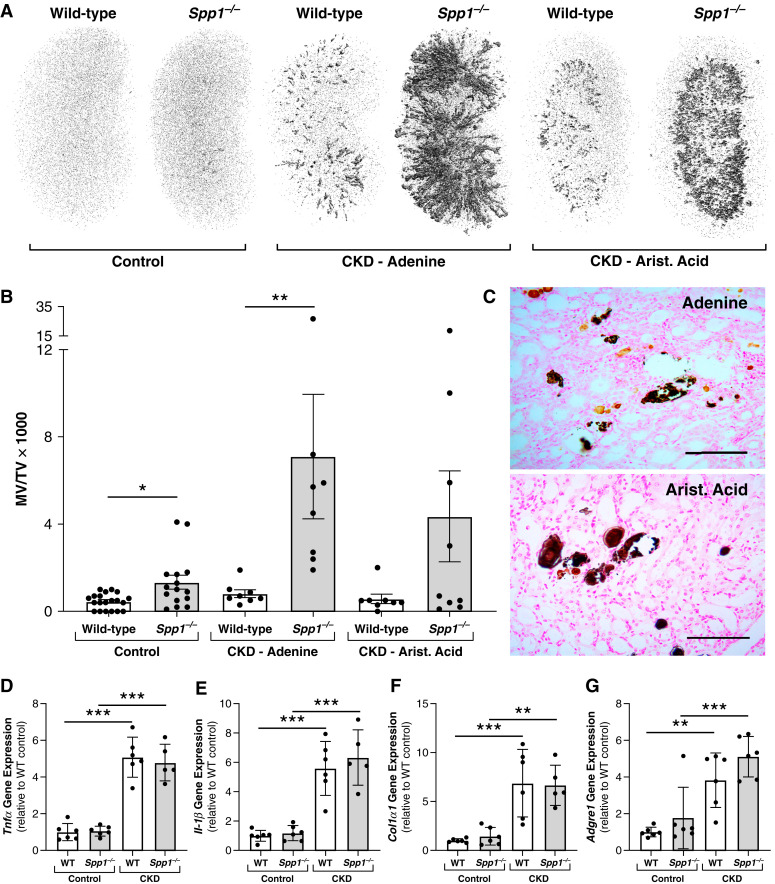
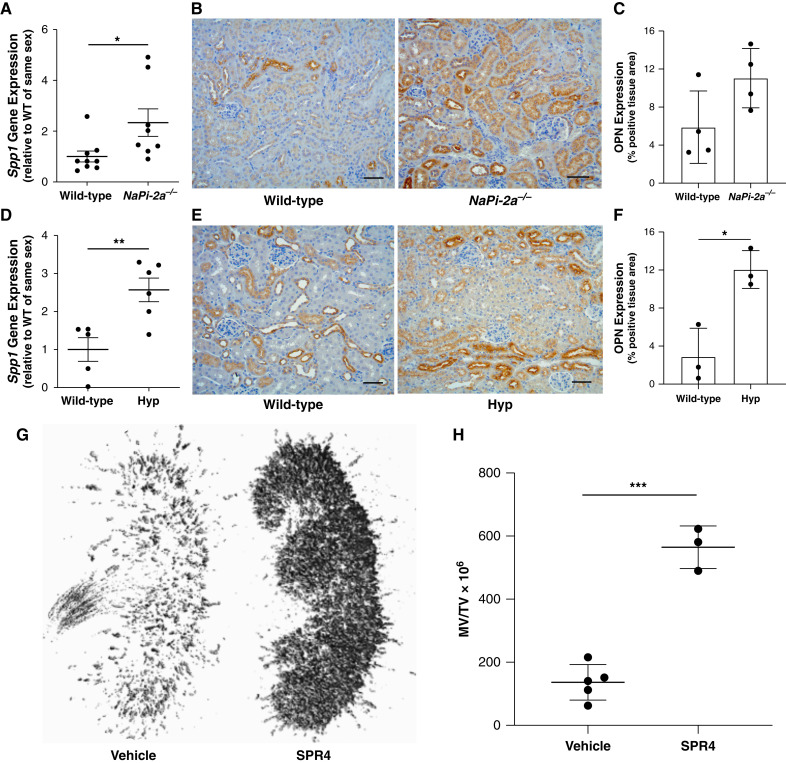
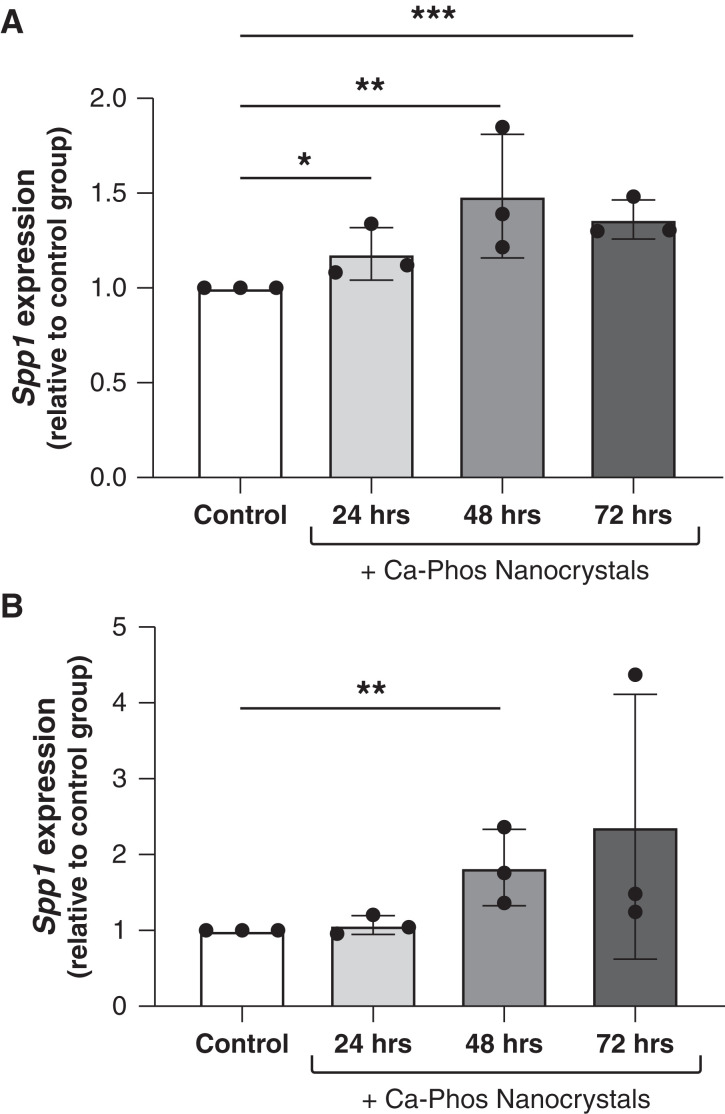
Results: Tubular OPN expression was dramatically increased in all studied CKD murine models. Kidney OPN gene expression and urinary OPN/Cr ratios increased before changes in traditional biochemical markers of kidney function. Moreover, a reduction of nephron numbers alone (by unilateral nephrectomy) was sufficient to induce OPN expression in residual nephrons and induction of CKD in OPN-null mice fed excess phosphate resulted in severe nephrocalcinosis. Neutralization of the ASARM motif of OPN in phosphaturic mice resulted in severe nephrocalcinosis that mimicked OPN-null CKD mice. Lastly, in vitro experiments revealed calcium-phosphate nanocrystals to induce OPN expression by tubular epithelial cells directly.

Conclusions: Kidney OPN expression increases in early CKD and serves a critical role in maintaining tubular mineral solubility when tubular phosphate concentrations are exceedingly high, as in late-stage CKD. Calcium-phosphate nanocrystals may be a proximal stimulus for tubular OPN production.

Keywords: basic science; chronic kidney disease; mineral metabolism; nephrocalcinosis; osteopontin; phosphate; solubility.


Conflict of interest statement

J. Boulanger reports being an employee of Sanofi-Genzyme. S. Liu reports being an employee of Sanofi-Genzyme and ownership interest in Sanofi. P.S. Rowe reports ownership interest in Apple (AAPL), CYBL, DWAC, and RTX, and patents or royalties from the University of Kansas Medical Center. J.R. Stubbs reports consultancy agreements with Novadiol; research funding from Genzyme; and being a scientific advisor for Spectradyne LLC. All remaining authors have nothing to disclose.

Figures

None
Graphical abstract
Figure 1.
Figure 1.
Kidney osteopontin (OPN) expression is increased in various CKD murine models. (A) Immunohistochemistry (IHC) of OPN protein expression (brown) in kidneys from mice with normal kidney function (wild type [WT]), cystic kidney disease (pcy/pcy), chronic tubular injury/fibrosis (aristolochic acid), and primary glomerulonephritis (Alport disease; Col4a3−/−). WT mice exhibit OPN staining in distal tubules, whereas all other CKD models demonstrate diffuse OPN staining in all nephron segments. (B) Quantification of OPN IHC staining confirmed the higher OPN expression in CKD models. Representative images were selected from a minimum of three per group; scale bar=100 µm for all images (*P<0.05 versus WT by t test with Welch’s correction; data presented as mean±SD).
Figure 2.
Figure 2.
Kidney expression and urine concentrations of OPN are increased long before changes in traditional kidney function markers and mineral metabolism parameters in Col4a3−/− (knockout) mice. Col4a3−/− mice possess defective glomerular basement membrane structure leading to severe proteinuria and progressive CKD. We characterized changes in kidney and urine OPN in relation to established mineral metabolism and kidney function parameters in Col4a3−/− mice (F1 hybrid background for SV129 and C57Bl/6 strains) at 6, 9, 12, and 15 weeks of age. These measurements included (A) kidney OPN gene expression, (B) urine OPN/creatinine (Cr) ratio, (C) BUN, (D) serum phosphorus, (E) serum fibroblast growth factor 23, and (F) serum parathyroid hormone (**P<0.01, ***P<0.001 versus WT of same age; bars=mean per group).
Figure 3.
Figure 3.
Kidney OPN expression is increased by reduction of functional nephrons (unilateral nephrectomy; Uni-Nx). (A) Spp1 (OPN) gene expression by quantitative real-time PCR was increased in the remaining kidney at 3 weeks post unilateral nephrectomy compared with sham-operated littermates. (B) No difference was observed in urine OPN (normalized to Cr). (C) and (D) IHC staining of residual kidneys from nephrectomy mice demonstrated markedly increased OPN expression (brown staining) in medullary tubules near the corticomedullary junction compared with sham controls (×10 magnification; scale bar=100 μm). Moreover, nearly all tubular segments in the kidney cortex (E) and (F) exhibited increased OPN expression in the Uni-Nx group (×20 magnification; scale bar=50 μm). Importantly, no evidence of tubular injury was observed by periodic acid-Schiff staining of kidney sections (G) and (H) (×20 magnification; scale bar=100 μm) or gene expression for Kim1 or Lcn2 (NGAL) (I) and (J). Additionally, Adgre1 (F4/80) expression was comparable for the two groups (K), suggesting no difference in macrophage accumulation in response to changes in OPN. Representative images were selected from a minimum of three per group (**P<0.01 by Student’s t test; all data presented as mean±SD; gene expression normalized to HPRT).
Figure 4.
Figure 4.
Induction of CKD in Spp1−/− (OPN-null) mice results in severe nephrocalcinosis. (A) Representative whole kidney micro-computed tomography (μCT) images demonstrating severe nephrocalcinosis in Spp1−/− mice after CKD induction by either chronic ingestion of 0.2% adenine or repeated subcutaneous injections of aristolochic acid. All mice were consuming a high (1.1%) phosphate diet for these studies to ensure high levels of urinary phosphate excretion. (B) Quantification of total kidney mineralized volume over total volume (MV/TV×1000) by μCT for all mice included in studies depicted in (A). (C) Von Kossa staining of kidney sections from CKD mice with OPN deletion showed a mixture of adenine (light brown) and phosphate-based crystals (black) in mice with CKD induced by adenine diet, whereas mice with CKD induced by aristolochic acid demonstrated only phosphate-based crystals (*P<0.05, **P<0.01 by one-way ANOVA; n≥8 per group for all μCT analyses; scale bars=100 μm). (D–G) Both WT and Spp1−/− mice with CKD induced by adenine diet exhibited increased kidney gene expression for markers of inflammation and fibrosis compared with non-CKD mice of the same genotype, including Tnfα (3D), Il-1β (3E), Col1α1 (3F), and Adgre1 (F4/80; 3G). However, Spp1 deletion had no apparent effect on the relative gene expression for these targets compared with WT mice within the same group (CKD or non-CKD; **P<0.01, ***P<0.001 by one-way ANOVA; n≥5 per group for all gene analyses; data presented as mean±SD for all graphs).
Figure 5.
Figure 5.
Kidney OPN and its ASARM peptide sequence serve a critical function in preventing nephrocalcinosis in the setting of phosphaturia. Two separate phosphaturic murine models, Napi2a−/− and Hyp mice, exhibit increased kidney OPN expression. (A) NaPi-2a−/− mice demonstrate increased kidney Spp1 (OPN) gene expression compared with WT littermates as assessed by quantitative real-time PCR. Moreover, (B) IHC staining revealed increased tubular OPN protein expression (brown) in kidney sections from NaPi-2a−/− mice. (C) Quantification of total OPN expression from images of mid-kidney sagittal cross-sections stained by IHC validated these observations. Similarly, phosphaturic Hyp mice exhibited (D) increased kidney Spp1 (OPN) gene expression, and (E) and (F) increased expression of OPN protein by IHC staining (all histology scale bars=50 μm). (G) Neutralization of the mineral binding (ASARM) peptide sequence of OPN with SPR4 peptide in Hyp mice results in severe nephrocalcinosis, as demonstrated by representative μCT images of whole kidneys from Hyp mice treated with either vehicle or SPR4. (H) Quantification of kidney mineralized tissue volume relative to total kidney volume (MV/TV) for all Hyp mice treated with either vehicle or SPR4 (for all analyses, *P<0.05, **P<0.01, ***P<0.001 by Student’s t test; n≥3 per group; data presented as mean±SD).
Figure 6.
Figure 6.
Calcium-phosphate nanocrystals directly induce Spp1 (OPN) gene expression in tubular epithelial cells. Treatment of (A) mIMCD-3 cells, an immortalized mouse collecting duct cell line, or (B) RCTE cells, a novel human collecting duct cell line, with calcium-phosphate (hydroxyapatite) nanocrystals induced Spp1 gene expression compared with vehicle-treated control cells (*P<0.05, **P<0.01, ***P<0.001; data presented as mean±SD; a minimum of two replicates were included for each treatment group per experiment, and each experiment was run in triplicate).

Comment in

References

    1. Moe S, Drüeke T, Cunningham J, Goodman W, Martin K, Olgaard K, Ott S, Sprague S, Lameire N, Eknoyan G; Kidney Disease: Improving Global Outcomes (KDIGO) : Definition, evaluation, and classification of renal osteodystrophy: A position statement from Kidney Disease: Improving Global Outcomes (KDIGO). Kidney Int 69: 1945–1953, 2006. 10.1038/sj.ki.5000414 - DOI - PubMed
    1. Bank N, Su WS, Aynedjian HS: A micropuncture study of renal phosphate transport in rats with chronic renal failure and secondary hyperparathyroidism. J Clin Invest 61: 884–894, 1978. 10.1172/JCI109014 - DOI - PMC - PubMed
    1. Craver L, Marco MP, Martínez I, Rue M, Borràs M, Martín ML, Sarró F, Valdivielso JM, Fernández E: Mineral metabolism parameters throughout chronic kidney disease stages 1–5—Achievement of K/DOQI target ranges. Nephrol Dial Transplant 22: 1171–1176, 2007. 10.1093/ndt/gfl718 - DOI - PubMed
    1. Isakova T, Wahl P, Vargas GS, Gutiérrez OM, Scialla J, Xie H, Appleby D, Nessel L, Bellovich K, Chen J, Hamm L, Gadegbeku C, Horwitz E, Townsend RR, Anderson CA, Lash JP, Hsu CY, Leonard MB, Wolf M: Fibroblast growth factor 23 is elevated before parathyroid hormone and phosphate in chronic kidney disease. Kidney Int 79: 1370–1378, 2011. 10.1038/ki.2011.47 - DOI - PMC - PubMed
    1. Xie Y, Sakatsume M, Nishi S, Narita I, Arakawa M, Gejyo F: Expression, roles, receptors, and regulation of osteopontin in the kidney. Kidney Int 60: 1645–1657, 2001. 10.1046/j.1523-1755.2001.00032.x - DOI - PubMed

Publication types