Development of an Administrative Data-Based Frailty Index for Older Adults Receiving Dialysis
- PMID: 36245660
- PMCID: PMC9528369
- DOI: 10.34067/KID.0000032022
Development of an Administrative Data-Based Frailty Index for Older Adults Receiving Dialysis
Abstract
Background: Frailty is present in ≥50% of older adults receiving dialysis. Our objective was to a develop an administrative data-based frailty index and assess the frailty index's predictive validity for mortality and future hospitalizations.
Methods: We used United States Renal Data System data to establish two cohorts of adults aged ≥65 years, initiating dialysis in 2013 and in 2017. Using the 2013 cohort (development dataset), we applied the deficit accumulation index approach to develop a frailty index. Adjusting for age and sex, we assessed the extent to which the frailty index predicts the hazard of time until death and time until first hospitalization over 12 months. We assessed the Harrell's C-statistic of the frailty index, a comorbidity index, and jointly. The 2017 cohort was used as a validation dataset.
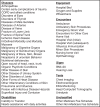
Results: Using the 2013 cohort (n=20,974), we identified 53 deficits for the frailty index across seven domains: disabilities, diseases, equipment, procedures, signs, tests, and unclassified. Among those with ≥1 deficit, the mean (SD) frailty index was 0.30 (0.13), range 0.02-0.72. Over 12 months, 18% (n=3842) died, and 55% (n=11,493) experienced a hospitalization. Adjusted hazard ratios for each 0.1-point increase in frailty index in models of time to death and time to first hospitalization were 1.41 (95% confidence interval, 1.37 to 1.44) and 1.33 (95% confidence interval, 1.31 to 1.35), respectively. For mortality, C-statistics for frailty index, comorbidity index, and both indices were 0.65, 0.65, and 0.66, respectively. For hospitalization, C-statistics for frailty index, comorbidity index, and both indices were 0.61, 0.60, and 0.61, respectively. Data from the 2017 cohort were similar.
Conclusions: We developed a novel frailty index for older adults receiving dialysis. Further studies are needed to improve on this frailty index and validate its use for clinical and research applications.
Keywords: United States Renal Data System; deficit accumulation index; geriatric and palliative nephrology; geriatric nephrology; hospitalization; mortality risk; renal dialysis.
Copyright © 2022 by the American Society of Nephrology.
Conflict of interest statement
C. Colón-Emeric reports having consultancy agreements and an advisory or leadership role with Amgen and Novartis; reports receiving research funding from UCB Pharma; and reports having patents or royalties as Co-inventor 2 use patents for bisphonate indication in cardiovascular diseases. D.H. Kim reports having consultancy agreements with Alosa Health and VillageMD. J.F. Pendergast reports receiving research funding from Dialysis Centers, Inc.; and reports receiving honoraria from the National Institutes of Health National Institute on Aging/National Institute of Mental Health Advanced Research Institute for training junior scholars to get their first R01 (US$2000 for 3 days of mentoring). J.J. Scialla reports having an advisory or leadership role as Deputy Editor, American Journal of Kidney Diseases. L.E. Boulware reports having an advisory or leadership role with the Association for Clinical and Translational Science, Journal of the American Medical Association Editorial Board, Journal of the American Medical Association Network Online Editorial Board, and the Robert Wood Johnson Clinical Scholars National Advisory Committee. P.L. Ephraim reports having consultancy agreements with Stony Run Consulting. R. Hall reports having consultancy agreements with Bayer, Reata Pharmaceuticals, Otsuka, Travere Pharmaceuticals, and United Health Group; and reports having an advisory or leadership role with the CJASN Editorial Board and the Journal of the American Geriatrics Society Editorial Board. All remaining authors have nothing to disclose.
Figures


References
-
- Hogan DB, Maxwell CJ, Afilalo J, Arora RC, Bagshaw SM, Basran J, Bergman H, Bronskill SE, Carter CA, Dixon E, Hemmelgarn B, Madden K, Mitnitski A, Rolfson D, Stelfox HT, Tam-Tham H, Wunsch H: A scoping review of frailty and acute care in middle-aged and older individuals with recommendations for future research. Can Geriatr J 20: 22–37, 2017. 10.5770/cgj.20.240 - DOI - PMC - PubMed
-
- Fried LP, Tangen CM, Walston J, Newman AB, Hirsch C, Gottdiener J, Seeman T, Tracy R, Kop WJ, Burke G, McBurnie MA; Cardiovascular Health Study Collaborative Research Group : Frailty in older adults: Evidence for a phenotype. J Gerontol A Biol Sci Med Sci 56: M146–M156, 2001. 10.1093/gerona/56.3.M146 - DOI - PubMed
Publication types
MeSH terms
Grants and funding
LinkOut - more resources
Full Text Sources

