

Longitudinal Evaluation of Visual Function Impairments in Early and Intermediate Age-Related Macular Degeneration Patients
- PMID: 36245764
- PMCID: PMC9559970
- DOI: 10.1016/j.xops.2022.100173
Longitudinal Evaluation of Visual Function Impairments in Early and Intermediate Age-Related Macular Degeneration Patients
Abstract
Purpose: To evaluate visual function (VF) changes in early and intermediate age-related macular degeneration (eAMD and iAMD) over 24 months.
Design: Prospective, observational natural history study.
Participants: Participants were enrolled at the Duke Eye Center.
Methods: A total of 101 subjects (33 with eAMD, 47 with iAMD, and 21 normal controls) were recruited. Visual function (VF) tests included best-corrected visual acuity (BCVA), low- luminance visual acuity (LLVA), microperimetry (MP), cone contrast tests (CCTs), and dark adaptation (DA). Mixed-effect model repeated measures based on absolute values and change from baseline identified VF tests differentiating AMD from controls and revealing longitudinal VF decline when controlling for covariates (baseline value, age, coronary artery disease, dry eye, and phakic status). Nine AMD genetic risk variants, combinations of these (genetic burden score), reticular pseudodrusen (RPD), and hyperreflective foci (HRF) were tested as predictors of diagnosis and VF performance.
Main outcome measures: Longitudinal changes in VF metrics over 24 months.
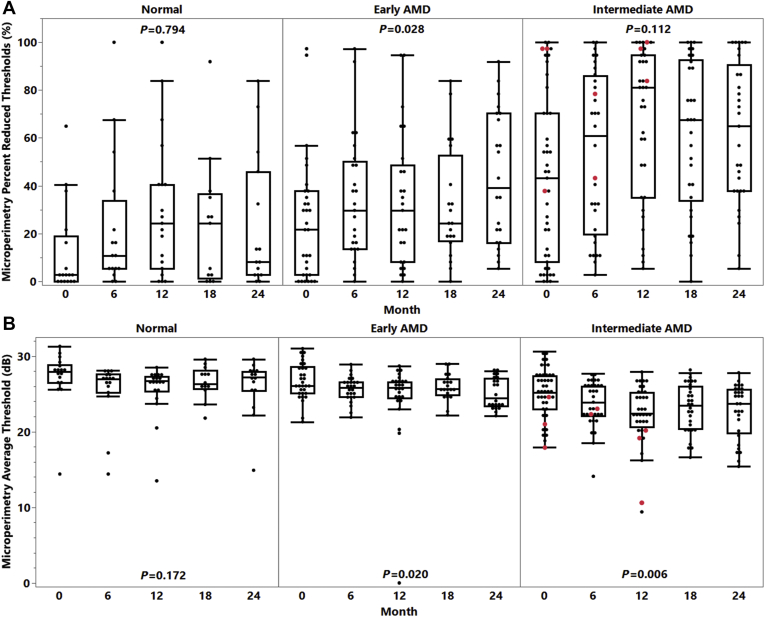
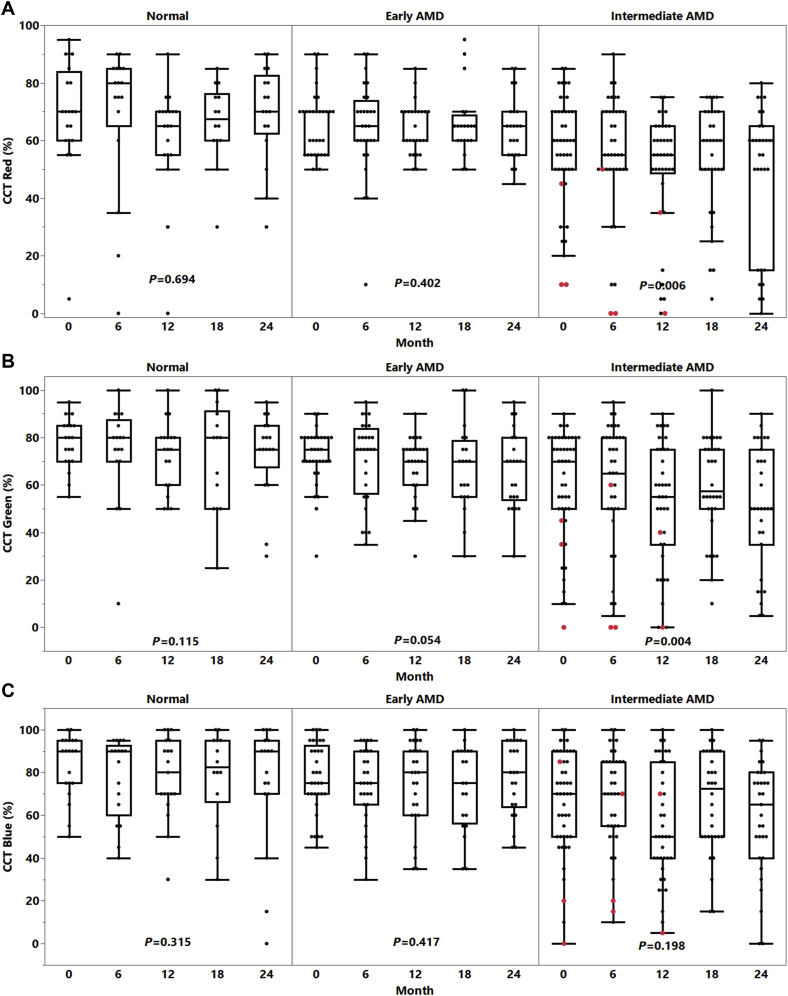
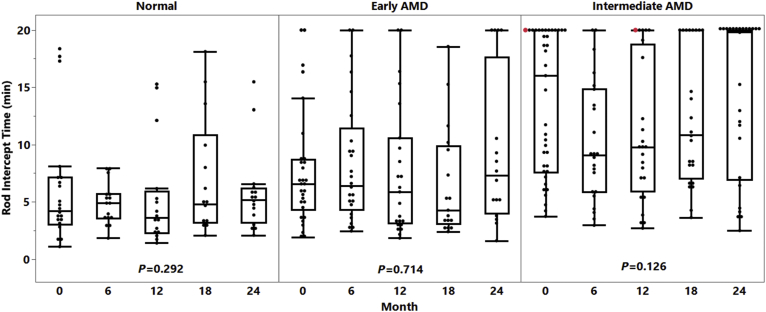
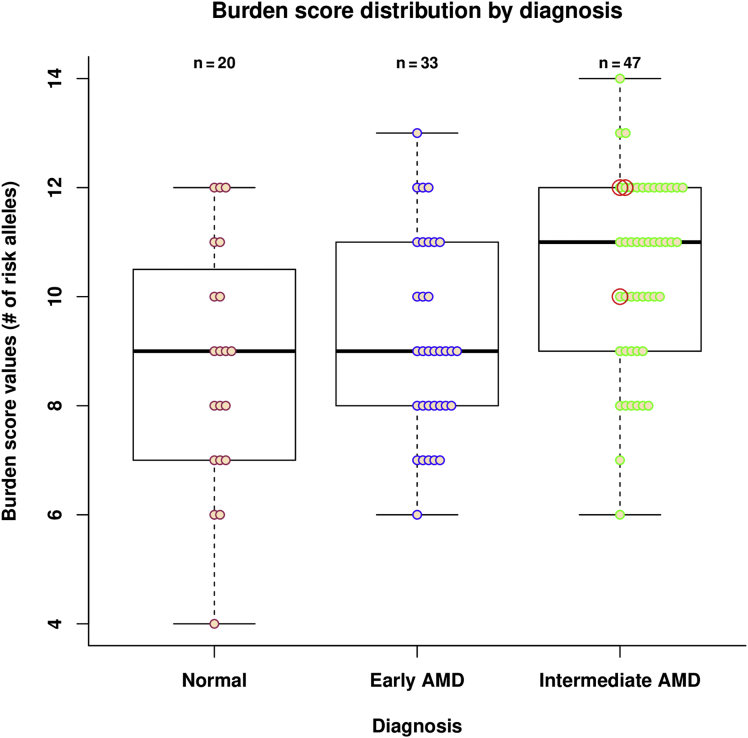
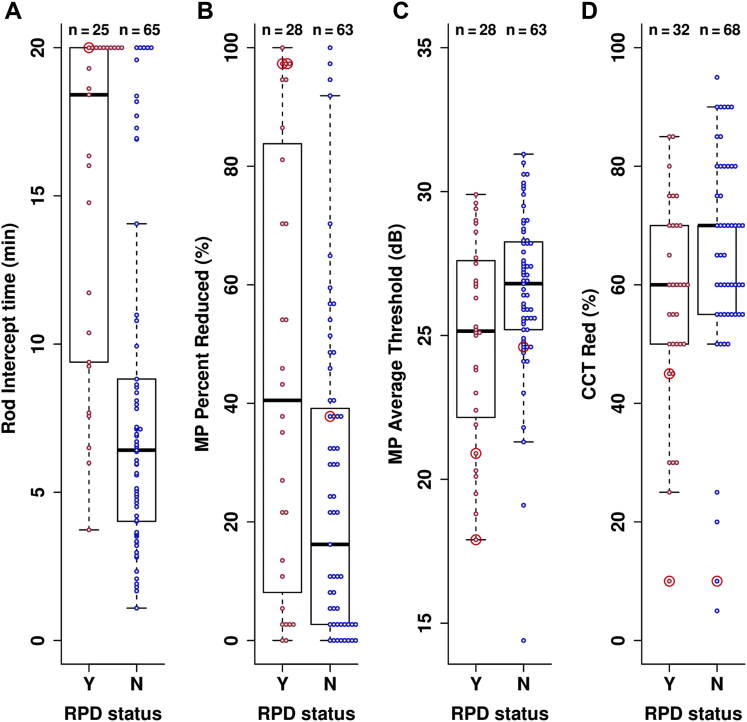
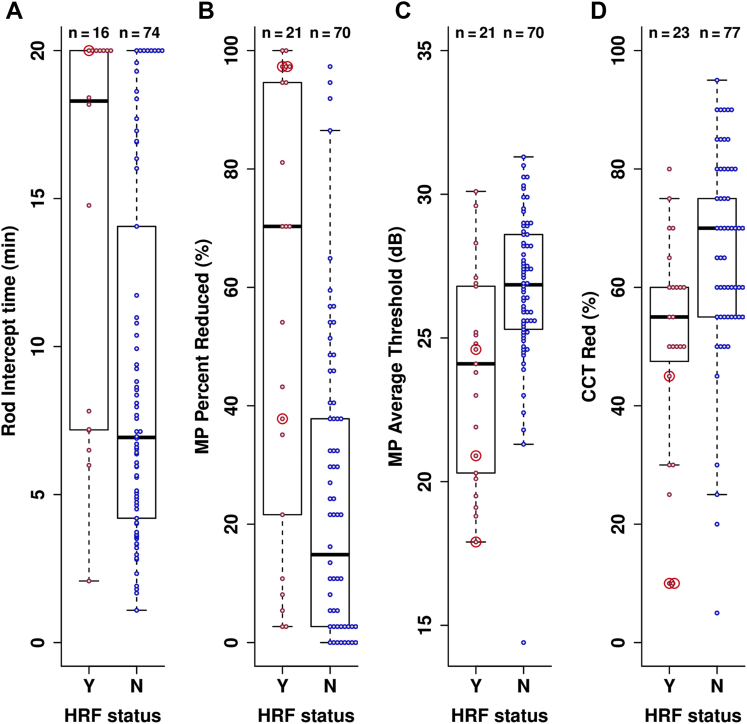
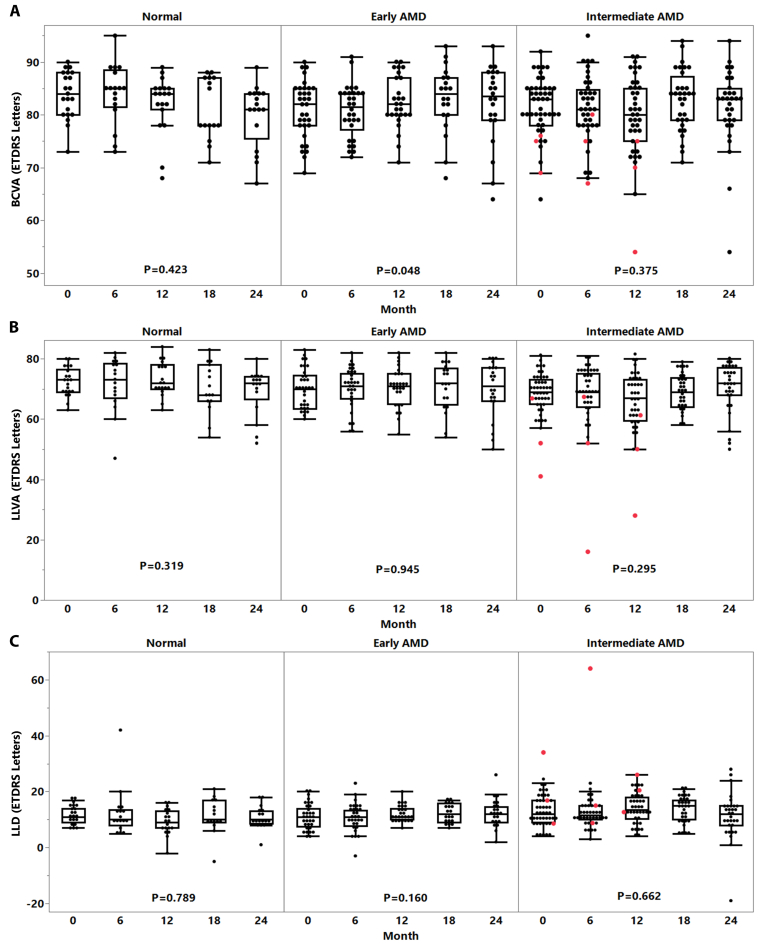
Results: A total of 70 subjects completed the 2-year visit (22 with eAMD, 31 with iAMD, and 17 controls). Percent reduced threshold (PRT) on MP and CCT red significantly distinguished iAMD versus controls after 12 and 24 months, respectively. Cone contrast test red, PRT, and absolute threshold (AT) on MP showed significant longitudinal deterioration of VF in iAMD versus baseline at 12 months and onward, however, with a reduced rate of worsening. The DA data confirmed a preexisting functional deficit in iAMD at baseline and revealed an increasing proportion of poorly performing iAMD subjects in DA over the study period. None of the other VF measures showed consistent significant changes among the normal, early, and intermediate groups or over time. The genetic burden score was significantly associated with AMD diagnosis (relative risk for iAMD = 1.64, P < 0.01) and DA (r = 0.42, P = 0.00005). Reticular pseudodrusen and HRF showed moderate associations with DA and weak to moderate associations with MP variables.
Conclusions: In iAMD, MP variables, CCT red, and DA revealed slow and nonlinear functional decline over 24 months. A structure-function relationship in eAMD and iAMD stages was demonstrated among HRF, RPD, and DA, possibly modified by genetic risk factors. These structural and functional features represent potential end points for clinical trials in iAMD.
Keywords: AMD, age-related macular degeneration; AREDS, Age-Related Eye Disease Study; AT, absolute threshold; BCVA, best-corrected visual acuity; CCT, cone contrast test; CFP, color fundus photography; DA, dark adaptation; Early AMD; HRF, hyperreflective foci; Intermediate AMD; LLD, low-luminance deficit; LLVA; LLVA, low-luminance visual acuity; MMRM, mixed-effect repeated measure; MP, microperimetry; Microperimetry; PRT, percent reduced threshold; RIT, rod intercept time; RPD, reticular pseudodrusen; RPE, retinal pigment epithelium; SD, standard deviation; SD-OCT, spectral domain OCT; SNP, single nucleotide polymorphism; VF, visual function; Visual function; dB, decibels; eAMD, early AMD; iAMD, intermediate AMD.
© 2022 by the American Academy of Ophthalmology.
Figures
Similar articles
-
Association of National Eye Institute Visual Function Questionnaire 39 Scores With Visual Function in Age-related Macular Degeneration Over 24 Months.Ophthalmic Surg Lasers Imaging Retina. 2025 Aug 11:1-8. doi: 10.3928/23258160-20250717-01. Online ahead of print. Ophthalmic Surg Lasers Imaging Retina. 2025. PMID: 40788856
-
Visual Function Metrics in Early and Intermediate Dry Age-related Macular Degeneration for Use as Clinical Trial Endpoints.Am J Ophthalmol. 2018 May;189:127-138. doi: 10.1016/j.ajo.2018.02.012. Epub 2018 Mar 15. Am J Ophthalmol. 2018. PMID: 29477964 Free PMC article.
-
Longitudinal Study of Visual Function in Dry Age-Related Macular Degeneration at 12 Months.Ophthalmol Retina. 2019 Aug;3(8):637-648. doi: 10.1016/j.oret.2019.03.010. Epub 2019 Mar 21. Ophthalmol Retina. 2019. PMID: 31060977 Free PMC article.
-
Biomarkers for the Progression of Intermediate Age-Related Macular Degeneration.Ophthalmol Ther. 2023 Dec;12(6):2917-2941. doi: 10.1007/s40123-023-00807-9. Epub 2023 Sep 29. Ophthalmol Ther. 2023. PMID: 37773477 Free PMC article. Review.
-
Dark Adaptation and Its Role in Age-Related Macular Degeneration.J Clin Med. 2022 Mar 1;11(5):1358. doi: 10.3390/jcm11051358. J Clin Med. 2022. PMID: 35268448 Free PMC article. Review.
Cited by
-
Test-Retest Variability and Discriminatory Power of Measurements From Microperimetry and Dark Adaptation Assessment in People With Intermediate Age-Related Macular Degeneration - A MACUSTAR Study Report.Transl Vis Sci Technol. 2023 Jul 3;12(7):19. doi: 10.1167/tvst.12.7.19. Transl Vis Sci Technol. 2023. PMID: 37477933 Free PMC article.
-
Repeatability of Rod-Mediated Dark Adaptation Testing in Normal Aging and Early and Intermediate Age-Related Macular Degeneration.Curr Eye Res. 2024 Jul;49(7):725-730. doi: 10.1080/02713683.2024.2326077. Epub 2024 Mar 4. Curr Eye Res. 2024. PMID: 38439539 Free PMC article.
-
Polygenic Risk Score Impact on Visual Function in Older Individuals with Healthy Macula: The Northern Ireland Sensory Ageing Study.Eye (Lond). 2025 Jun;39(8):1508-1516. doi: 10.1038/s41433-025-03642-3. Epub 2025 Feb 17. Eye (Lond). 2025. PMID: 39962206
-
Determinants of visual functions in patients with early and intermediate age-related macular degeneration: the PEONY study.Eye (Lond). 2025 Jul 21. doi: 10.1038/s41433-025-03931-x. Online ahead of print. Eye (Lond). 2025. PMID: 40691727
-
Delayed Rod-Mediated Dark Adaptation Is Associated with Incidence and Early Progression of Age-Related Macular Degeneration: Alabama Study on Early Age-Related Macular Degeneration 2.Ophthalmology. 2025 Jun 16:S0161-6420(25)00383-5. doi: 10.1016/j.ophtha.2025.06.013. Online ahead of print. Ophthalmology. 2025. PMID: 40532855
References
-
- Wong W.L., Su X., Li X., et al. Global prevalence of age-related macular degeneration and disease burden projection for 2020 and 2040: a systematic review and meta-analysis. Lancet Glob Health. 2014;2:e106–e116. - PubMed
-
- Phipps J.A., Guymer R.H., Vingrys A.J. Loss of cone function in age-related maculopathy. Invest Ophthalmol Vis Sci. 2003;44:2277–2283. - PubMed
-
- Downie L.E., Cheng A.S., Vingrys A.J. Color vision deficits in intermediate age-related macular degeneration. Optom Vis Sci. 2014;91:932–938. - PubMed
-
- Cheng A.S., Vingrys A.J. Visual losses in early age-related maculopathy. Optom Vis Sci. 1993;70:89–96. - PubMed
Grants and funding
LinkOut - more resources
Full Text Sources
Miscellaneous
