

Identification of the Novel Gene Markers Based on the Gene Profile among Different Severity of Obstructive Sleep Apnea
- PMID: 36245838
- PMCID: PMC9554663
- DOI: 10.1155/2022/6517965
Identification of the Novel Gene Markers Based on the Gene Profile among Different Severity of Obstructive Sleep Apnea
Abstract
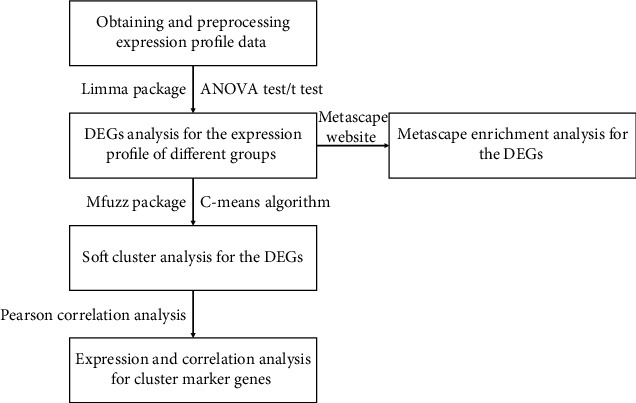
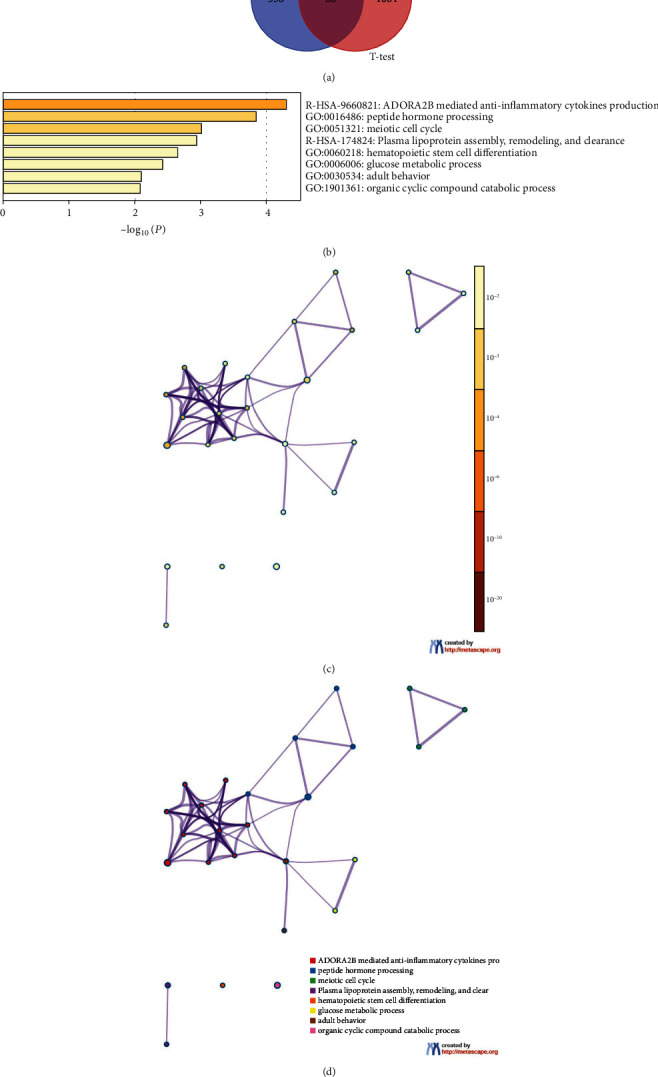
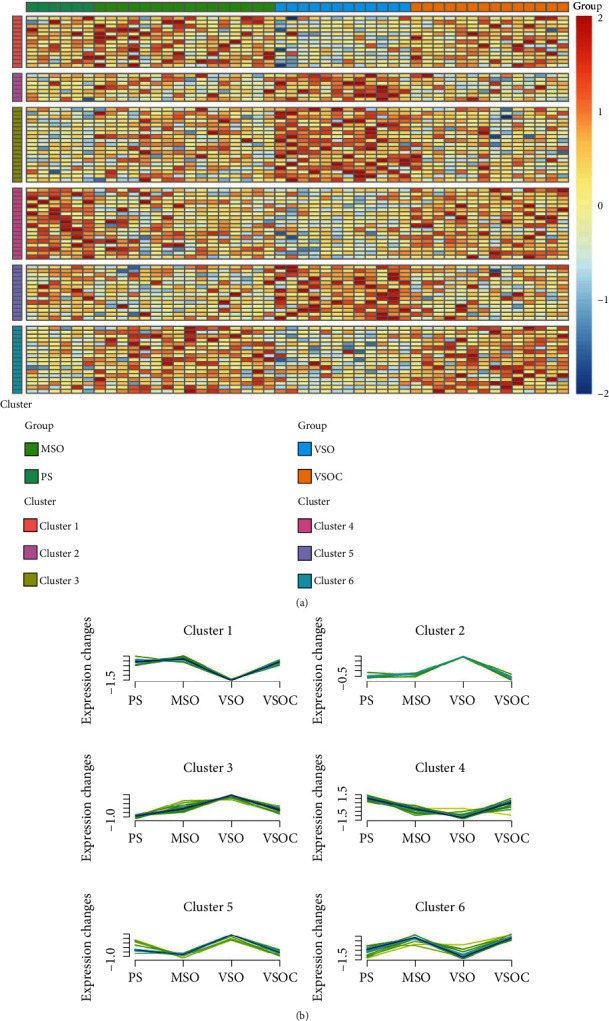
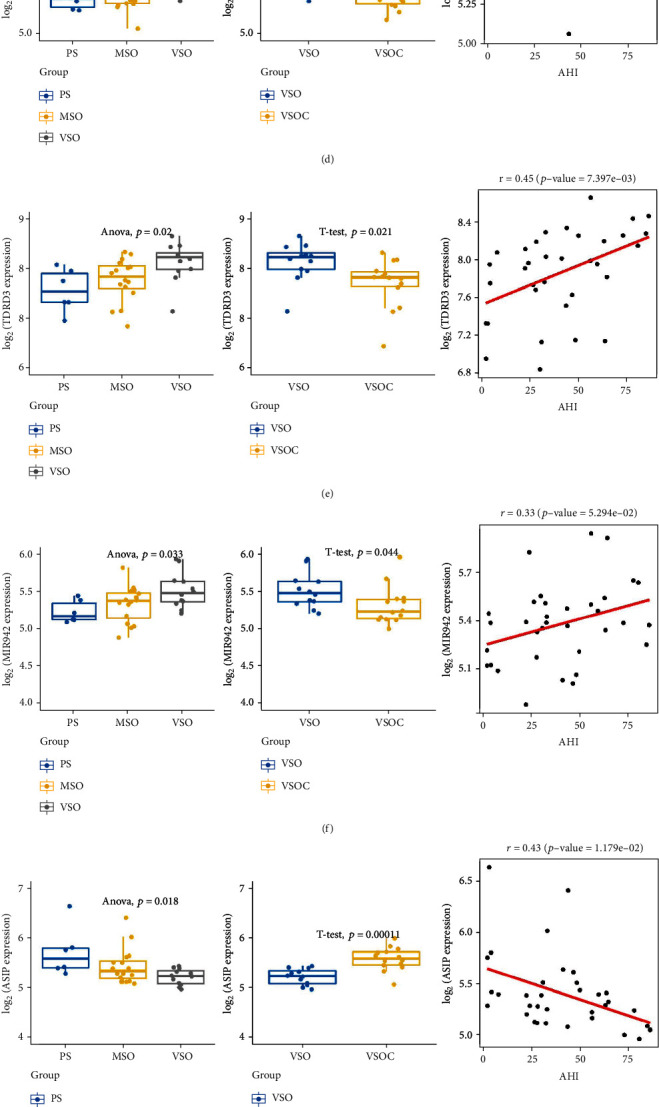
Obstructive sleep apnea (OSA) is caused by repeated blockage of the upper respiratory airways during sleep. The traditional evaluation methods for OSA severity are yet limited. This study aimed to screen gene signatures to effectively evaluate OSA severity. Expression profiles of peripheral blood mononuclear cells in the different severities of OSA patients were accessed from Gene Expression Omnibus (GEO) database. A total of 446 differentially expressed genes (DEGs) were screened among the varying severities of OSA samples by analysis of variance (ANOVA) test. A total of 1,152 DEGs were screened between the pre- and post-treatment OSA samples by using t test. Overlap of the two groups of DEGs was selected (88 DEGs) for Metascape enrichment analysis. Afterwards, Mfuzz package was used to perform soft clustering analysis on these 88 genes, by which 6 clusters were obtained. It was observed that the gene expression condition of the cluster 3 was positively associated with OSA severity degree; also, the gene expression condition in cluster 4 was negatively correlated with OSA severity. A total of 10 gene markers related to OSA progression were selected from cluster 3 and cluster 4. Their expression levels and correlation were analyzed. The marker genes in cluster 3 and cluster 4 were examined, finding that most genes were significantly correlated with apnea hypopnea index (AHI). An accurate and objective assessment of the severity of OSA is of great significance for formulating follow-up treatment strategies for patients with OSA. In this paper, a set of marker genes that can detect the severity of OSA were screened by bioinformatics methods, which could be jointly used with the traditional OSA diagnostic index to achieve a more reliable OSA severity evaluation.
Copyright © 2022 Yi Ren et al.
Conflict of interest statement
All authors confirm no conflicts of interest in this work.
Figures
Similar articles
-
Evaluation of obstructive sleep apnea: an analysis based on aberrant genes.Sleep Breath. 2023 Aug;27(4):1419-1431. doi: 10.1007/s11325-022-02749-1. Epub 2022 Nov 23. Sleep Breath. 2023. PMID: 36418734
-
Identification of novel biomarkers in obstructive sleep apnea via integrated bioinformatics analysis and experimental validation.PeerJ. 2023 Dec 4;11:e16608. doi: 10.7717/peerj.16608. eCollection 2023. PeerJ. 2023. PMID: 38077447 Free PMC article.
-
Implication of Apnea-Hypopnea Index, a Measure of Obstructive Sleep Apnea Severity, for Atrial Fibrillation in Patients With Hypertrophic Cardiomyopathy.J Am Heart Assoc. 2020 Apr 21;9(8):e015013. doi: 10.1161/JAHA.119.015013. Epub 2020 Apr 16. J Am Heart Assoc. 2020. PMID: 32297565 Free PMC article.
-
Craniofacial abnormalities in Chinese patients with obstructive and positional sleep apnea.Sleep Med. 2008 May;9(4):403-10. doi: 10.1016/j.sleep.2007.04.024. Epub 2007 Jul 19. Sleep Med. 2008. PMID: 17658296
-
Obstructive sleep apnea phenotypes in men based on characteristics of respiratory events during polysomnography.Sleep Breath. 2019 Dec;23(4):1087-1094. doi: 10.1007/s11325-019-01785-8. Epub 2019 Jan 29. Sleep Breath. 2019. PMID: 30693418
Cited by
-
Analysis of the role of PANoptosis in seizures via integrated bioinformatics analysis and experimental validation.Heliyon. 2024 Feb 14;10(4):e26219. doi: 10.1016/j.heliyon.2024.e26219. eCollection 2024 Feb 29. Heliyon. 2024. PMID: 38404827 Free PMC article.
References
-
- Kapur V. K. Obstructive sleep apnea: diagnosis, epidemiology, and economics. Respiratory Care . 2010;55(9):1155–1167. - PubMed
MeSH terms
Substances
LinkOut - more resources
Full Text Sources
