

Construction of Prognostic Risk Model for Small Cell Lung Cancer Based on Immune-Related Genes
- PMID: 36245844
- PMCID: PMC9554662
- DOI: 10.1155/2022/7116080
Construction of Prognostic Risk Model for Small Cell Lung Cancer Based on Immune-Related Genes
Abstract
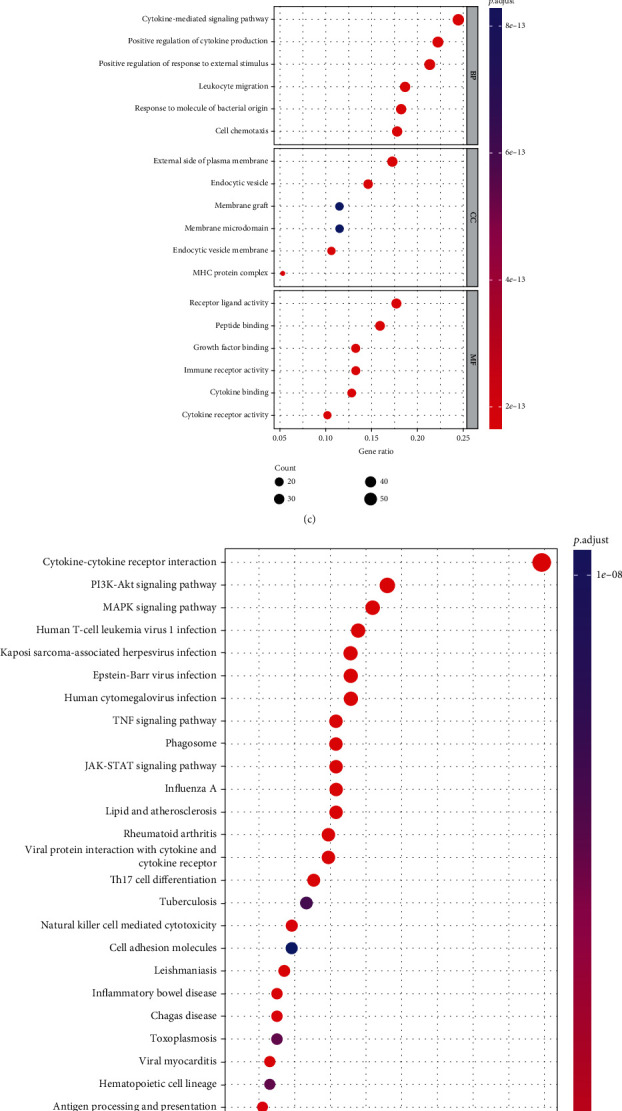
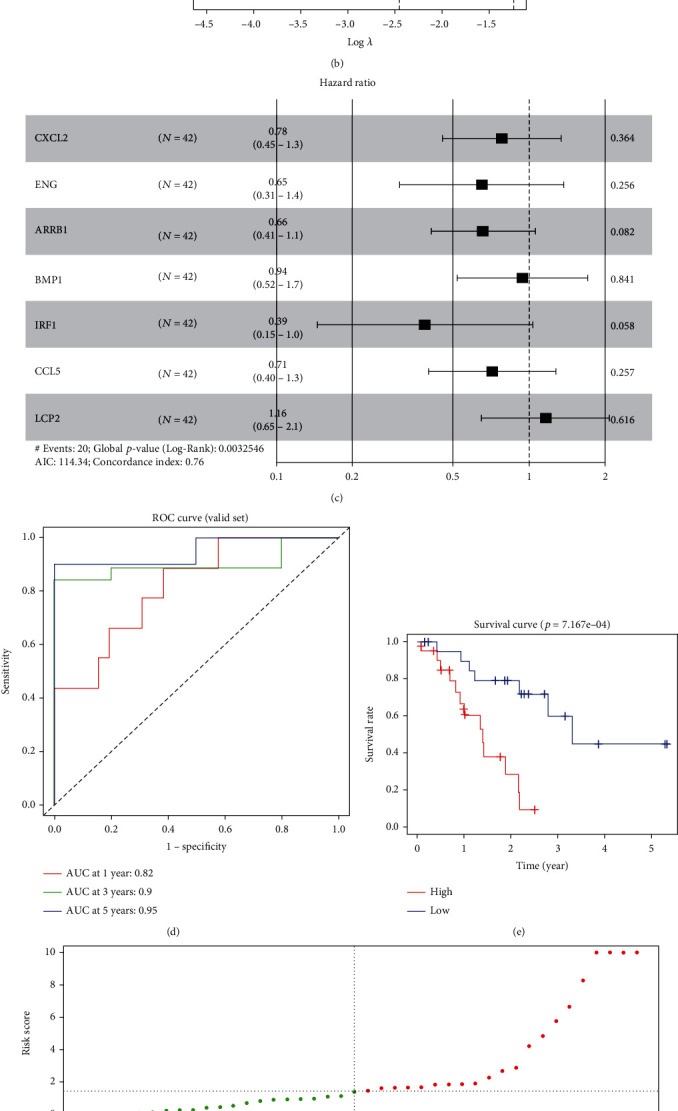
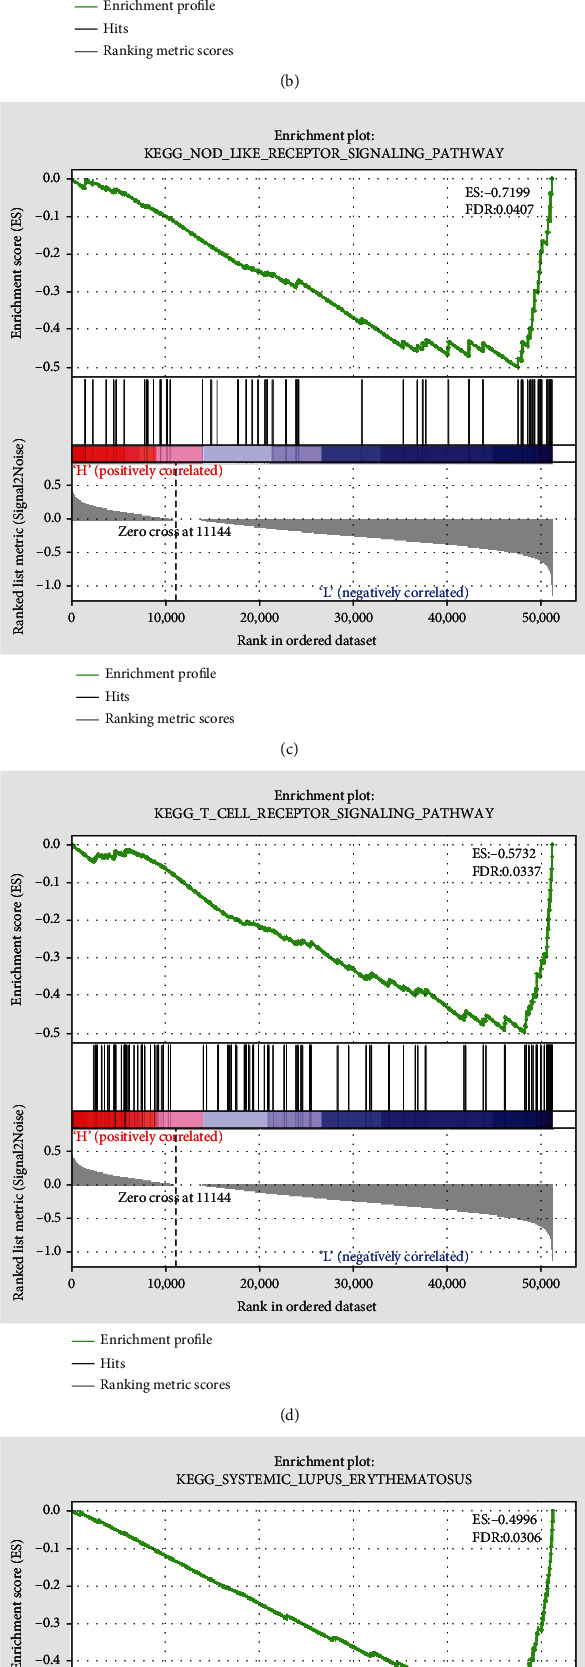
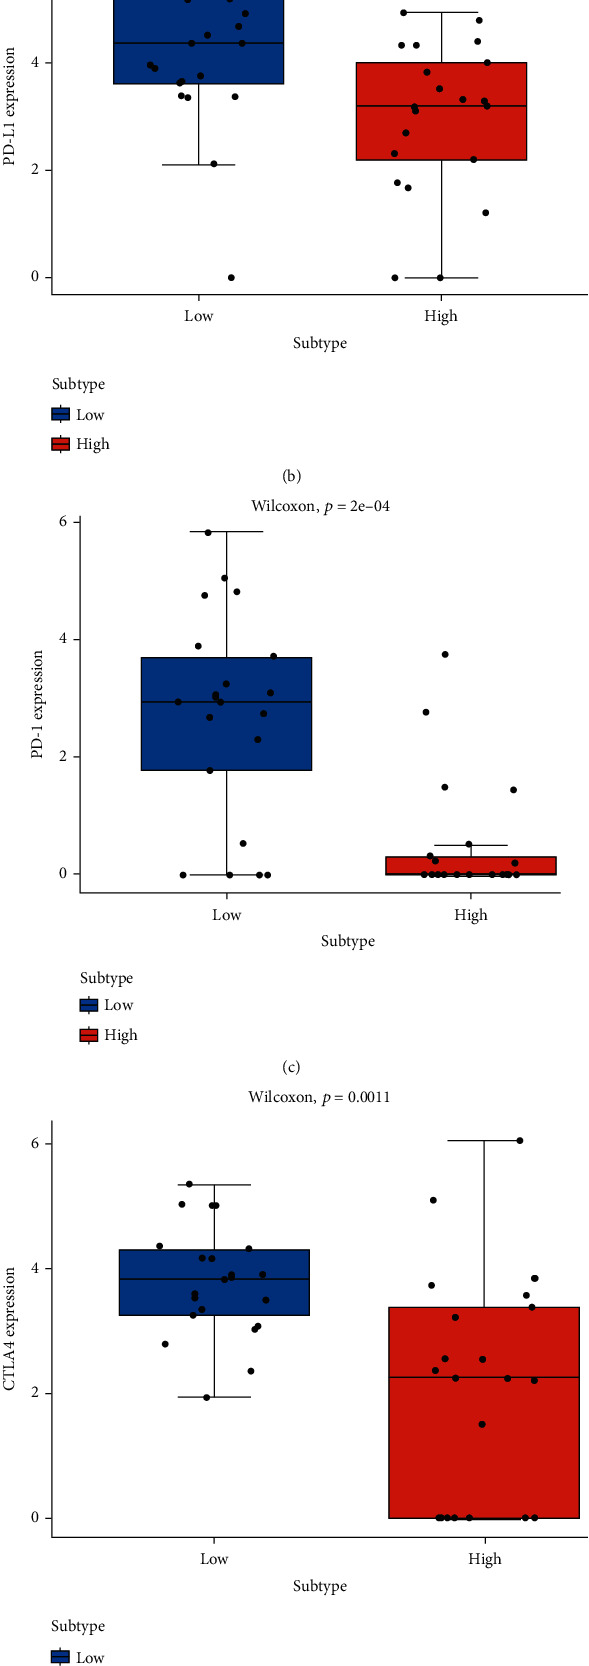
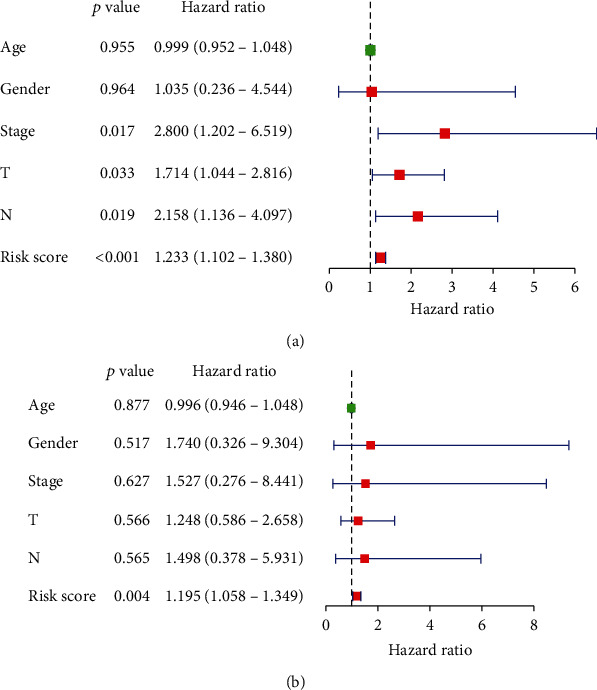
Small cell lung cancer (SCLC) is a highly invasive and fatal malignancy. Research at the present stage implied that the expression of immune-related genes is associated with the prognosis in SCLC. Accordingly, it is essential to explore effective immune-related molecular markers to judge prognosis and treat SCLC. Our research obtained SCLC dataset from Gene Expression Omnibus (GEO) and subjected mRNAs in it to differential expression analysis. Differentially expressed mRNAs (DEmRNAs) were intersected with immune-related genes to yield immune-related differentially expressed genes (DEGs). The functions of these DEGs were revealed by Gene Ontology (GO) and Kyoto Encyclopedia of Genes and Genomes (KEGG) enrichment analyses. Thereafter, we categorized 3 subtypes of immune-related DEGs via K-means clustering. Kaplan-Meier curves analyzed the effects of 3 subtypes on SCLC patients' survival. Single-sample gene set enrichment analysis (ssGSEA) and ESTIMATE validated that the activation of different immune gene subtypes differed significantly. Finally, an immune-related-7-gene assessment model was constructed by univariate-Lasso-multiple Cox regression analyses. Riskscores, Kaplan-Meier curves, receiver operating characteristic (ROC) curves, and independent prognostic analyses validated the prognostic value of the immune-related-7-gene assessment model. As suggested by GSEA, there was a prominent difference in cytokine-related pathways between high- and low-risk groups. As the analysis went further, we discovered a statistically significant difference in the expression of human leukocyte antigen (HLA) proteins and costimulatory molecules expressed on the surface of CD274, CD152, and T lymphocytes in different groups. In a word, we started with immune-related genes to construct the prognostic model for SCLC, which could effectively evaluate the clinical outcomes and offer guidance for the treatment and prognosis of SCLC patients.
Copyright © 2022 Feng Deng et al.
Conflict of interest statement
The authors report no conflict of interest.
Figures

Similar articles
-
The identification of a two-gene prognostic model based on cisplatin resistance-related ceRNA network in small cell lung cancer.BMC Med Genomics. 2023 May 15;16(1):103. doi: 10.1186/s12920-023-01536-5. BMC Med Genomics. 2023. PMID: 37189142 Free PMC article.
-
Identification of Six Novel Prognostic Gene Signatures as Potential Biomarkers in Small Cell Lung Cancer.Comb Chem High Throughput Screen. 2023;26(5):938-949. doi: 10.2174/1386207325666220427121619. Comb Chem High Throughput Screen. 2023. PMID: 35490316
-
Identification of candidate biomarkers and pathways associated with SCLC by bioinformatics analysis.Mol Med Rep. 2018 Aug;18(2):1538-1550. doi: 10.3892/mmr.2018.9095. Epub 2018 May 29. Mol Med Rep. 2018. PMID: 29845250 Free PMC article.
-
Construction of a prognostic model for lung squamous cell carcinoma based on immune-related genes.Carcinogenesis. 2023 May 26;44(2):143-152. doi: 10.1093/carcin/bgac098. Carcinogenesis. 2023. PMID: 36455238
-
Identification of Immune Infiltration and Prognostic Biomarkers in Small Cell Lung Cancer Based on Bioinformatic Methods from 3 Studies.Comb Chem High Throughput Screen. 2023;26(3):507-516. doi: 10.2174/1386207325666220408092925. Comb Chem High Throughput Screen. 2023. PMID: 35400336
Cited by
-
A 15-Gene-Based Risk Signature for Predicting Overall Survival in SCLC Patients Who Have Undergone Surgical Resection.Cancers (Basel). 2023 Oct 30;15(21):5219. doi: 10.3390/cancers15215219. Cancers (Basel). 2023. PMID: 37958393 Free PMC article.
-
Metabolic reprogramming signature predicts prognosis and immune landscape in small cell lung cancer: MOCS2 validation and implications for personalized therapy.Front Mol Biosci. 2025 May 16;12:1592888. doi: 10.3389/fmolb.2025.1592888. eCollection 2025. Front Mol Biosci. 2025. PMID: 40452920 Free PMC article.
References
MeSH terms
Substances
LinkOut - more resources
Full Text Sources
Medical
Research Materials
