

Measuring Competitiveness at NUTS3 Level and Territorial Partitioning of the Italian Provinces
- PMID: 36245938
- PMCID: PMC9540143
- DOI: 10.1007/s11205-021-02836-y
Measuring Competitiveness at NUTS3 Level and Territorial Partitioning of the Italian Provinces
Abstract
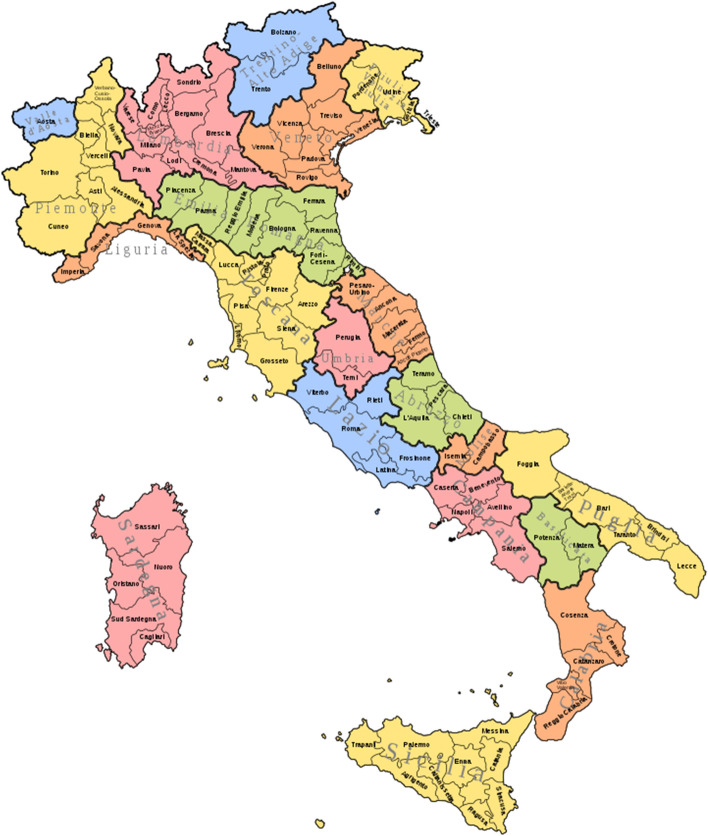
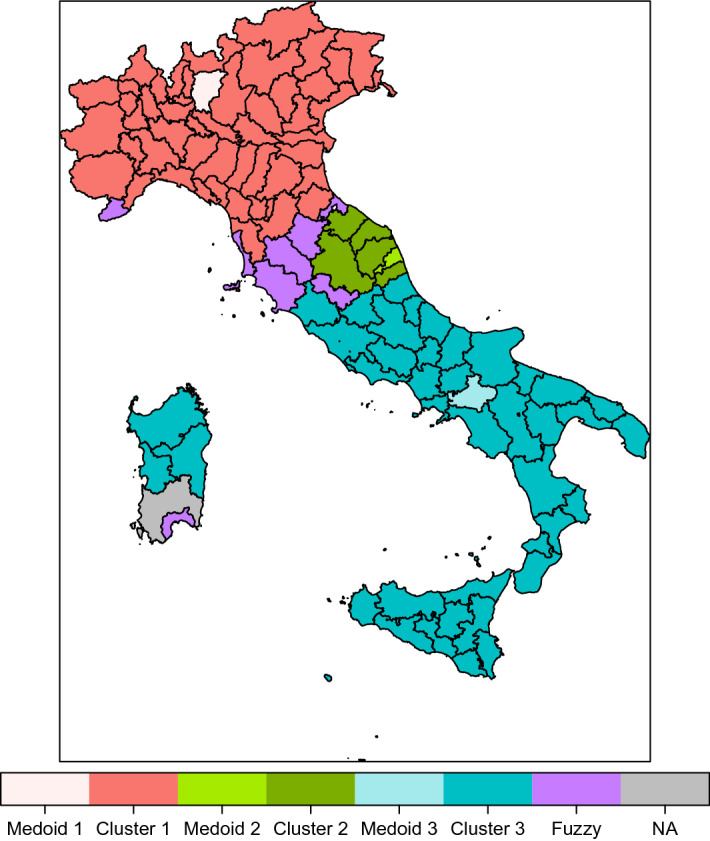
In this paper we propose a dashboard of indicators of territorial attractiveness at NUTS3 level in the framework of the EU Regional Competitiveness Index (RCI). Then, the Fuzzy C-Medoids Clustering model with multivariate data and contiguity constraints is applied for partitioning the Italian provinces (NUTS3). The novelty is the territorial level analized, and the identification of the elementary indicators at the basis of the construction of the eleven composite competitiveness pillars. The positioning of the Italian provinces is deeply analyzed. The clusters obtained with and without contraints are compared. The obtained partition may play an important role in the design of policies at the NUTS3 level, a route already considered by the Italian government. The analysis developed and the related set of indicators at NUTS3 level constitute an information base that could be effectively used for the implementation of the National Recovery and Resilience Plan (NRRP).
Keywords: Competitiveness; Fuzzy partitioning around medoids; NUTS3; Spatial constraints; Territorial attractiveness.
© The Author(s) 2022.
Figures


References
-
- Acemoglu D, Johnson S, Robinson J. The colonial origins of comparative development: An empirical investigation: Reply. American Economic Review. 2001;91:1369–1401. doi: 10.1257/aer.91.5.1369. - DOI
-
- Annoni P, Dijkstra L. The EU Regional Competitiveness Index 2019. Luxembourg: Publications Office of the European Union; 2019.
-
- Audretsch D, Feldman M. R-d spillovers and the geography of Innovation and production. American Economic Review. 1996;86:630–40.
-
- Cantwell, J. (2006). Innovation and competitiveness.
-
- Coleman JS. Social capital in the creation of human capital. American Journal of Sociology. 1988;94:S95–S120. doi: 10.1086/228943. - DOI
LinkOut - more resources
Full Text Sources