. 2022 Sep 19:2022:1022580.
doi: 10.1155/2022/1022580. eCollection 2022.

Prognostic Modeling of Lung Adenocarcinoma Based on Hypoxia and Ferroptosis-Related Genes

Affiliations

Prognostic Modeling of Lung Adenocarcinoma Based on Hypoxia and Ferroptosis-Related Genes

Chang Liu et al. J Oncol. .

Abstract

Background: It is well known that hypoxia and ferroptosis are intimately connected with tumor development. The purpose of this investigation was to identify whether they have a prognostic signature. To this end, genes related to hypoxia and ferroptosis scores were investigated using bioinformatics analysis to stratify the risk of lung adenocarcinoma.

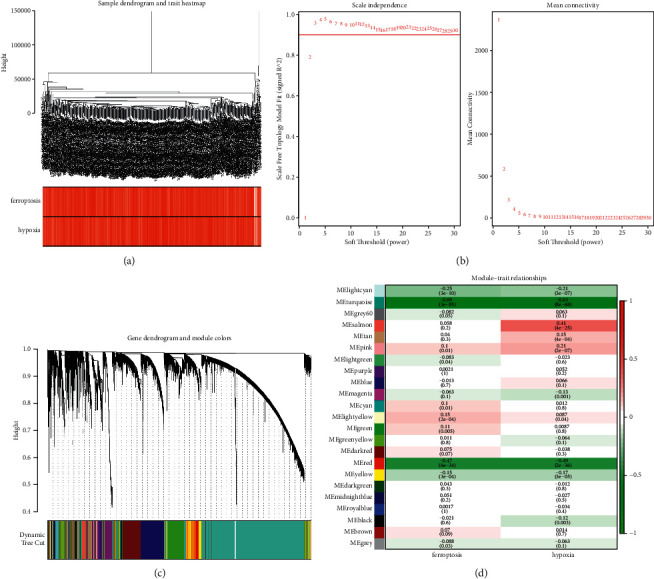
Methods: Hypoxia and ferroptosis scores were estimated using The Cancer Genome Atlas (TCGA) database-derived cohort transcriptome profiles via the single sample gene set enrichment analysis (ssGSEA) algorithm. The candidate genes associated with hypoxia and ferroptosis scores were identified using weighted correlation network analysis (WGCNA) and differential expression analysis. The prognostic genes in this study were discovered using the Cox regression (CR) model in conjunction with the LASSO method, which was then utilized to create a prognostic signature. The efficacy, accuracy, and clinical value of the prognostic model were evaluated using an independent validation cohort, Receiver Operator Characteristic (ROC) curve, and nomogram. The analysis of function and immune cell infiltration was also carried out.

Results: Here, we appraised 152 candidate genes expressed not the same, which were related to hypoxia and ferroptosis for prognostic modeling in The Cancer Genome Atlas Lung Adenocarcinoma (TCGA-LUAD) cohort, and these genes were further validated in the GSE31210 cohort. We found that the 14-gene-based prognostic model, utilizing MAPK4, TNS4, WFDC2, FSTL3, ITGA2, KLK11, PHLDB2, VGLL3, SNX30, KCNQ3, SMAD9, ANGPTL4, LAMA3, and STK32A, performed well in predicting the prognosis in lung adenocarcinoma. ROC and nomogram analyses showed that risk scores based on prognostic signatures provided desirable predictive accuracy and clinical utility. Moreover, gene set variance analysis showed differential enrichment of 33 hallmark gene sets between different risk groups. Additionally, our results indicated that a higher risk score will lead to more fibroblasts and activated CD4 T cells but fewer myeloid dendritic cells, endothelial cells, eosinophils, immature dendritic cells, and neutrophils.

Conclusion: Our research found a 14-gene signature and established a nomogram that accurately predicted the prognosis in patients with lung adenocarcinoma. Clinical decision-making and therapeutic customization may benefit from these results, which may serve as a valuable reference in the future.


Conflict of interest statement

The authors declared no potential conflicts of interest with respect to the research, authorship, and/or publication of this article.

Figures

Figure 1
Figure 1
(a) Sample-clustering dendrogram with feature heatmap. (b) Network topology analysis with different soft threshold power. (c) Cluster dendrograms of genes based on topological overlap of dissimilarities, and module colors were assigned. (d) Heatmap showing the relationship between gene modules and phenotypic traits. Each row and column correspond to a module e-gene and a trait. The correlation coefficient in each cell represents the same relationship with heatmap in decreasing magnitude from red to green. The number in parentheses in each cell represents the correlation P-value.
Figure 2
Figure 2
(a) Volcano map of significant DEGs. Red spots: upregulated genes; blue spots: downregulated genes; gray: genes with no change in expression. (b) Venn diagram showing the repetitious genes of DEGs and WGCNA. (c, d) Function analysis of DE-hypoxia and ferroptosis score-related genes using Metascape.
Figure 3
Figure 3
(a–c) The LCR was used to figure out the lowest criteria (a, b) and coefficients (c). (d) Allocations of risk scores (based on the hypoxia and ferroptosis score-related prognostic signature); (e) K-M survival curves. (f) Hypoxia and ferroptosis score-related signature can be utilized to predict OS in the TCGA training set according to ROC curves.
Figure 4
Figure 4
Heatmap of the relationship between the expression of 14 genes associated with hypoxia and ferroptosis scores and clinicopathological features in the (a) TCGA training, (b) TCGA test, and (c) GSE31210 dataset.
Figure 5
Figure 5
(a, d) Allocations of risk scores. (b), (e) The K-M survival curves showed that a high-risk score was related to less OS. Hypoxia and ferroptosis score-related signature can be utilized to predict OS in the (c) TCGA test and (d) GSE31210 dataset according to ROC curves.
Figure 6
Figure 6
Wilcoxon analysis of the differing risk score distributions among various (a) stages, (b) T  stages, and (c) N stages in the TCGA-LUAD cohort. The K-M survival curves of patients with different (d) stages, (e) T stages, and (f) N stages. P < 0.05, ∗∗P < 0.01, and ∗∗∗P < 0.001.
Figure 7
Figure 7
K-M survival analysis of the fourteen-gene risk score level in subgroups: (a) younger than 60 years old and older than 60 years old, (b) male and female, (c) stages I-II and stages III-IV, (d) T1 2 stage and T3-4 stage, (e) N0 stage and N+ stage, and (f) M0 stage and M1 stage.
Figure 8
Figure 8
(a) Forrest plot of UCR analysis in LUAD. (b) Forrest plot of MCR analysis in LUAD. (c) A prognostic nomogram predicting OS of LUAD. (d) Calibration plots of the nomogram for predicting the OS in the TCGA-LUAD dataset.
Figure 9
Figure 9
Gene set variation analysis. Differences in hallmark gene set activities scored by GSVA between two groups. T values are figured out using a linear model and the |t| > 2 as a cutoff value.
Figure 10
Figure 10
(a, b) Heatmap illustrating the distributions of immune cell subsets, fibroblasts, and endothelial cells assessed via MCP-counter (a) and ssGSEA (b) algorithms in the TCGA-LUAD cohort. (c, d) Wilcoxon analysis of the differing TME subtype distributions between two groups in the TCGA-LUAD cohort. P < 0.05, ∗∗P < 0.01, and ∗∗∗P < 0.001.
Figure 11
Figure 11
The high expression of TNS4 (a), WFDC2 (b), and ITGA2 (c) and the low expression of MAPK4 (d), SMAD9 (e), KLK11 (f), and LAMA3 (g) in LUAD tissues were confirmed compared to the paracancerous tissues.

References

    1. DeSantis C. E., Miller K. D., Goding Sauer A., Jemal A., Siegel R. L. Cancer statistics for African Americans, 2019. CA: A Cancer Journal for Clinicians . 2019;69(3):211–233. doi: 10.3322/caac.21555. - DOI - PubMed
    1. Li Q., Ma W., Chen S., et al. High integrin α3 expression is associated with poor prognosis in patients with non-small cell lung cancer. Translational Lung Cancer Research . 2020;9(4):1361–1378. doi: 10.21037/tlcr-19-633. - DOI - PMC - PubMed
    1. Herbst R. S., Morgensztern D., Boshoff C. The biology and management of non-small cell lung cancer. Nature . 2018;553(7689):446–454. doi: 10.1038/nature25183. - DOI - PubMed
    1. Bender E. Epidemiology: the dominant malignancy. Nature . 2014;513(7517):S2–S3. doi: 10.1038/513s2a. - DOI - PubMed
    1. Shukla S., Evans J. R., Malik R., et al. Development of a RNA-seq based prognostic signature in lung adenocarcinoma. Journal of the National Cancer Institute . 2017;109(1) doi: 10.1093/jnci/djw200.djw200 - DOI - PMC - PubMed