. 2022 Sep 29:13:971757.
doi: 10.3389/fphys.2022.971757. eCollection 2022.

Hydration status during commercial saturation diving measured by bioimpedance and urine specific gravity

Affiliations

Hydration status during commercial saturation diving measured by bioimpedance and urine specific gravity

Stian Lande Wekre et al. Front Physiol. .

Abstract

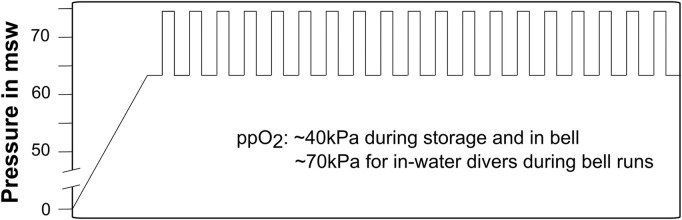
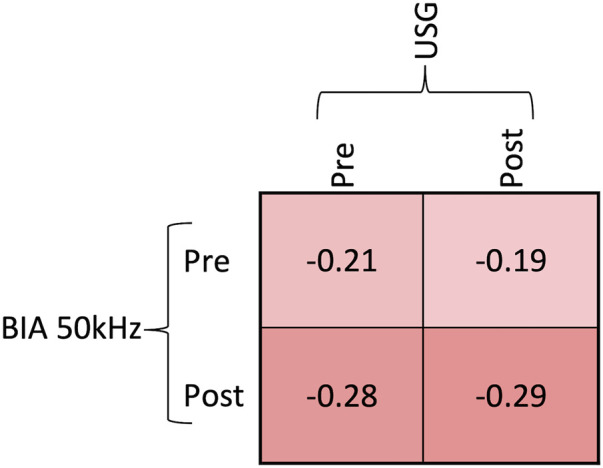
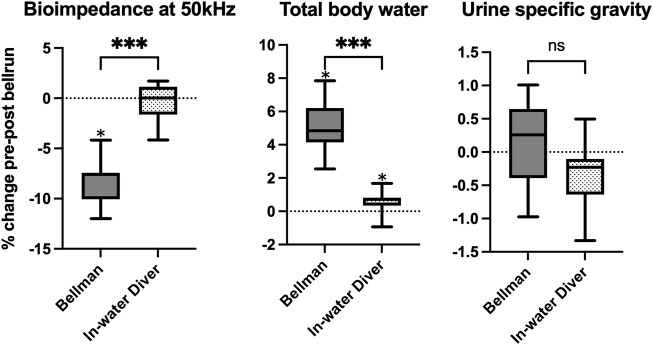
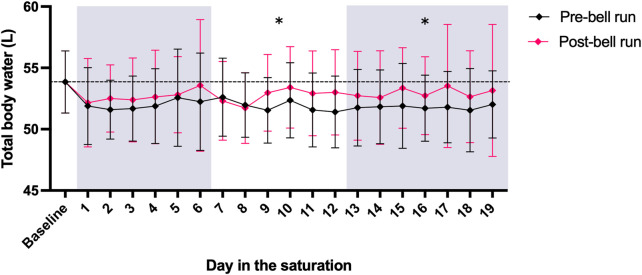
Excessive fluid loss triggered by hyperbaric pressure, water immersion and hot water suits causes saturation divers to be at risk of dehydration. Dehydration is associated with reductions in mental and physical performance, resulting in less effective work and an increased risk of work-related accidents. In this study we examined the hydration status of 11 male divers over 19 days of a commercial saturation diving campaign to a working depth of 74 m, using two non-invasive methods: Bioelectrical impedance analysis (BIA) and urine specific gravity (USG). Measurements were made daily before and after bell runs, and the BIA data was used to calculated total body water (TBW). We found that BIA and USG were weakly negatively correlated, probably reflecting differences in what they measure. TBW was significantly increased after bell runs for all divers, but more so for bellmen than for in-water divers. There were no progressing changes in TBW over the 19-day study period, indicating that the divers' routines were sufficient for maintaining their hydration levels on short and long term.

Keywords: bioimpedance (BIA); decompression; hydration; hyperbaric saturation; saturation diving; total body water; underwater work.


Conflict of interest statement

Author JI was employed by the company Divetech. The remaining authors declare that the research was conducted in the absence of any commercial or financial relationships that could be construed as a potential conflict of interest.

Figures

FIGURE 1
FIGURE 1
Heliox saturation dive profile. Vertical bars indicate bell runs. The storage depth was kept at 63 msw, and the maximum working depth was 74 msw. Partial pressure of oxygen was kept close to 40 kPa during storage, and raised during bell runs to 60–80 kPa for the in-water divers and 40–50 kPa for the bellmen.
FIGURE 2
FIGURE 2
The relationship between pre- and post-bell run values of USG and BIA at 50 kHz analyzed by Spearman correlation coefficients. All coefficients were statistically significant (p < 0,02), implying that there was a negative correlation between USG and BIA.
FIGURE 3
FIGURE 3
Boxplot showing the % change in hydration markers during bell runs, for bellmen and in-water divers. Box edges represent 25th and 75th percentiles. Whiskers are minimum and maximum values. Calculation of differences were done using a paired t-test for urine specific gravity and Wilcoxon matched pairs test for bioimpedance and total body water. *median different from zero (p ≤ 0,05). *** significant difference between bellmen and in-water divers (p ≤ 0,001). “ns” no significant difference between bellmen and in-water divers.
FIGURE 4
FIGURE 4
TBW calculated from BIA data collected pre- and post-bell runs from 11 saturation divers Diamonds and whiskers are means ± SD. The mean pre-saturation TBW baseline is shown as a horizontal stapled line. Panel shading indicates the three periods for which data were pooled to analyze progressing changes in TBW. “*” indicates that the mean of pre-bell run TBW for the period was significantly below the pre-saturation baseline. There were no differences in post-bell run TBW compared to baseline (p < 0.05).

References

    1. Armstrong L. E., Maresh C. M., Castellani J. W., Bergeron M. F., Kenefick R. W., LaGasse K. E., et al. (1994). Urinary indices of hydration status. Int. J. Sport Nutr. 4 (3), 265–279. 10.1123/ijsn.4.3.265 - DOI - PubMed
    1. Barr S. I. (1999). Effects of dehydration on exercise performance. Can. J. Appl. Physiol. 24 (2), 164–172. 10.1139/h99-014 - DOI - PubMed
    1. Björklund S., Ruzgas T., Nowacka A., Dahi I., Topgaard D., Sparr E., et al. (2013). Skin membrane electrical impedance properties under the influence of a varying water gradient. Biophys. J. 104 (12), 2639–2650. 10.1016/j.bpj.2013.05.008 - DOI - PMC - PubMed
    1. Brubakk A. O., Ross J. A. S., Thom S. R. (2014). Saturation diving; physiology and pathophysiology. Compr. Physiol. 4 (3), 1229–1272. 10.1002/cphy.c130048 - DOI - PubMed
    1. Cian C., Koulmann N., Barraud P., Raphel C., Jimenez C., Melin B. (2000). Influences of variations in body hydration on cognitive function: Effect of hyperhydration, heat stress, and exercise-induced dehydration. J. Psychophysiol. 14 (1), 29–36. 10.1027//0269-8803.14.1.29 - DOI

LinkOut - more resources