

Rheumatoid arthritis, psoriatic arthritis, and axial spondyloarthritis epidemiology in England from 2004 to 2020: An observational study using primary care electronic health record data
- PMID: 36246147
- PMCID: PMC9557034
- DOI: 10.1016/j.lanepe.2022.100519
Rheumatoid arthritis, psoriatic arthritis, and axial spondyloarthritis epidemiology in England from 2004 to 2020: An observational study using primary care electronic health record data
Abstract
Background: Contemporary data on rheumatoid arthritis (RA), psoriatic arthritis (PsA) and axial spondyloarthritits (SpA) epidemiology in England are lacking. This knowledge is crucial to planning healthcare services. We updated algorithms defining patients with diagnoses of RA, PsA, and axial SpA in primary care and applied them to describe their incidence and prevalence in the Clinical Practice Research Datalink Aurum, an electronic health record (EHR) database covering ∼20% of England.
Methods: Algorithms for ascertaining patients with RA, axial SpA, and PsA diagnoses validated in primary care EHR databases using Read codes were updated (to account for the English NHS change to SNOMED CT diagnosis coding) and applied. Updated diagnosis and synthetic disease-modifying anti-rheumatic drug code lists were devised by rheumatologists and general practitioners. Annual incidence/point-prevalence of RA, PsA, and axial SpA diagnoses were calculated from 2004 to 2020 and stratified by age/sex.
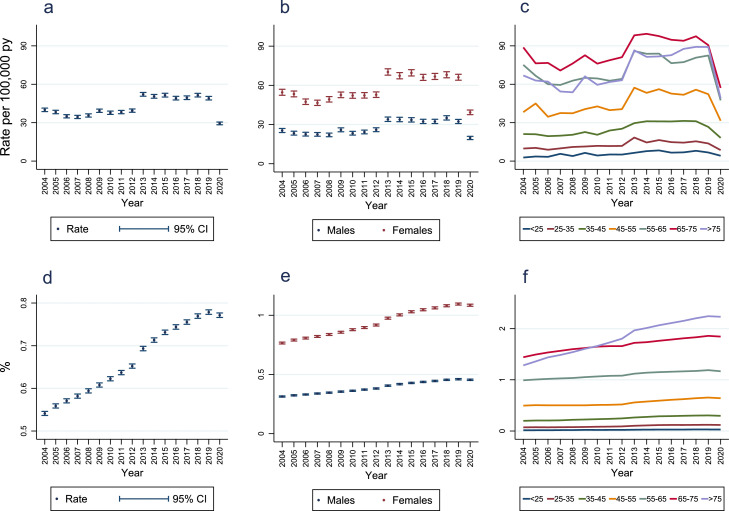
Findings: Point-prevalence of RA/PsA diagnoses increased annually, peaking in 2019 (RA 0·779% [95% confidence interval (CI) 0·773, 0·784]; PsA 0·287% [95% CI 0·284, 0·291]) then falling slightly. Point-prevalence of axial SpA diagnoses increased annually (except in 2018/2019), peaking in 2020 (0·113% [95% CI 0·111, 0·115]). RA diagnosis annual incidence was higher between 2013-2019 (after inclusion in the Quality and Outcomes Framework, range 49·1 [95% CI 47·7, 50·5] to 52·1 [95% CI 50·6, 53·6]/100,000 person-years) than 2004-2012 (range 34·5 [95% CI 33·2, 35·7] to 40·0 [95% CI 38·6, 41·4]/100,000 person-years). Increases in the annual incidence of PsA/axial SpA diagnosis occurred following new classification criteria publication. Annual incidence of RA, PsA and axial SpA diagnoses fell by 40·1%, 67·4%, and 38·1%, respectively between 2019 and 2020, likely reflecting the COVID-19 pandemic's impact on their diagnosis.
Interpretation: Recorded RA, PsA, and axial SpA diagnoses are increasingly prevalent in England, underlining the importance of organising healthcare services to provide timely, treat-to-target care to optimise the health of >1% of adults in England.
Funding: National Institute for Health and Care Research (NIHR300826).
Keywords: Axial spondyloarthritis; Incidence; Prevalence; Psoriatic arthritis; Rheumatoid arthritis.
© 2022 The Authors.
Conflict of interest statement
Relevant to the present manuscript: access to CPRD data and ICS's salary was funded by an NIHR Advanced Research Fellowship award; CDM's salary is funded by the NIHR School for Primary Care Research and NIHR Applied Research Collaboration; KPJ's salary is partly funded by the NIHR Applied Research Collaboration; SM's salary is partly funded by the NIHR Applied Research Collaboration. In the last three years: ICS has received grant funding from the British Society for Rheumatology and received support for attendance at a conference from the NIHR; Keele University have received funding for CDM's salary from the MRC, AHRC, Versus Arthritis, NIHR, and BMS.
Figures


References
-
- Strand V, Singh JA. Patient burden of axial spondyloarthritis. JCR J Clin Rheumatol. 2017;23 https://journals.lww.com/jclinrheum/Fulltext/2017/10000/Patient_Burden_o... - PMC - PubMed
-
- Strand V, Wright GC, Bergman MJ, Tambiah J, Taylor PC. Patient expectations and perceptions of goal-setting strategies for disease management in rheumatoid arthritis. J Rheumatol. 2015;42:2046–2054. - PubMed
-
- National Audit Office. Services for people with rheumatoid arthritis. Available at: https://www.nao.org.uk/report/services-for-people-with-rheumatoid-arthri.... https://www.nao.org.uk/wp-content/uploads/2009/07/0809823es.pdf. Accessed 27 March 2019.
-
- Almutairi K, Nossent J, Preen D, Keen H, Inderjeeth C. The global prevalence of rheumatoid arthritis: a meta-analysis based on a systematic review. Rheumatol Int. 2021;41:863–877. - PubMed
LinkOut - more resources
Full Text Sources
Research Materials
Miscellaneous
