

Integrative analysis of the mouse fecal microbiome and metabolome reveal dynamic phenotypes in the development of colorectal cancer
- PMID: 36246263
- PMCID: PMC9554438
- DOI: 10.3389/fmicb.2022.1021325
Integrative analysis of the mouse fecal microbiome and metabolome reveal dynamic phenotypes in the development of colorectal cancer
Abstract
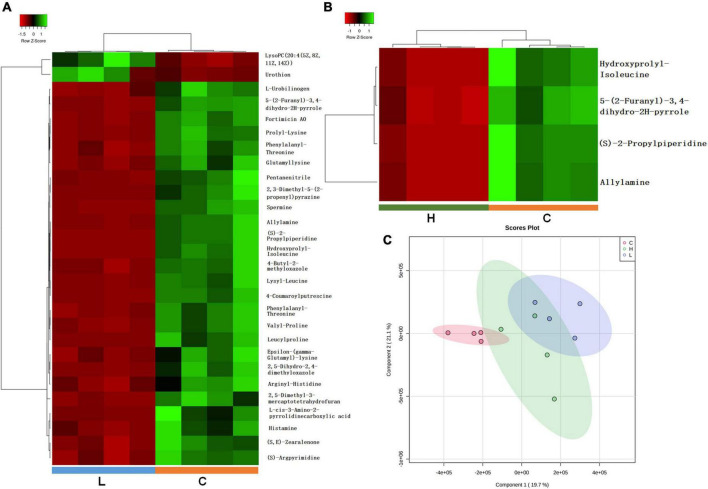
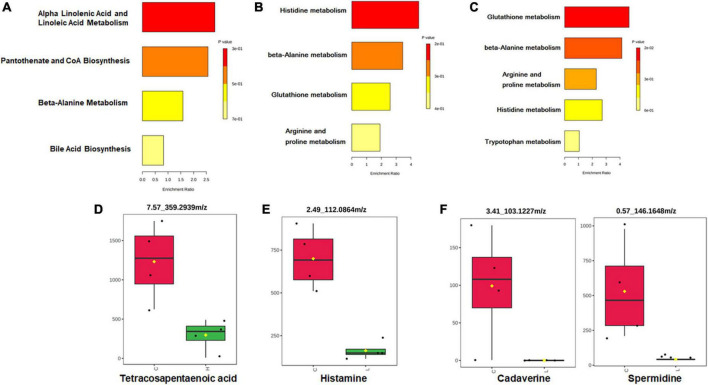
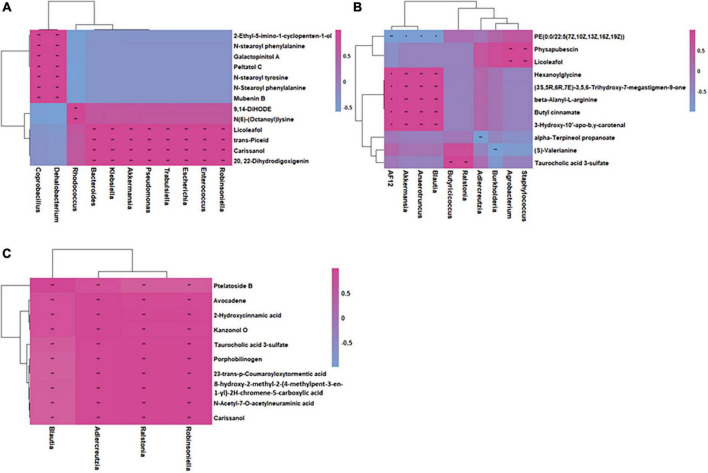
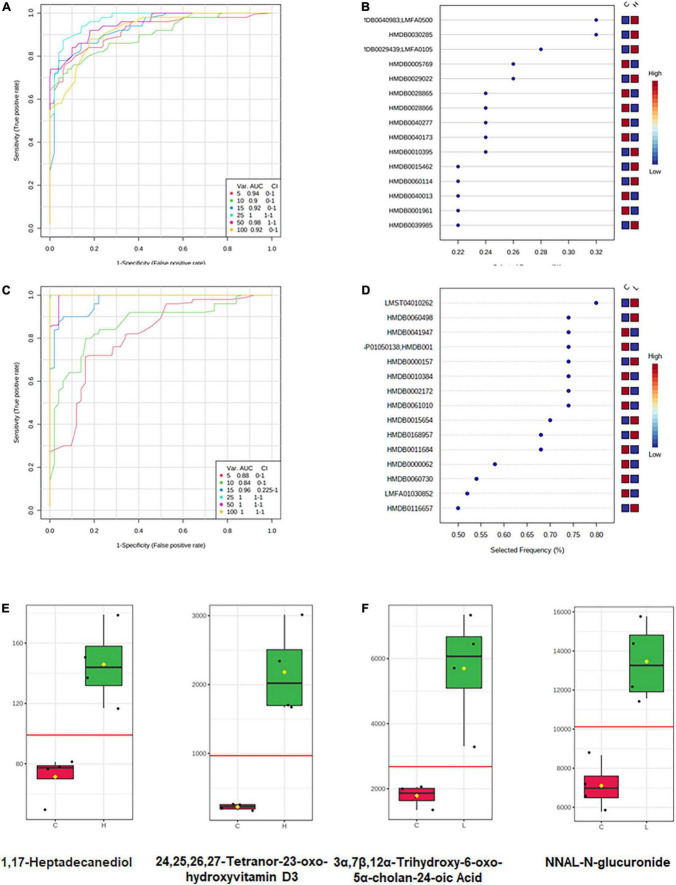
The gut microbiome and its interaction with host have been implicated as the causes and regulators of colorectal cancer (CRC) pathogenesis. However, few studies comprehensively investigate the compositions of gut bacteria and their interactions with host at the early inflammatory and cancerous stages of CRC. In this study, mouse fecal samples collected at inflammation and CRC were subjected to microbiome and metabolome analyses. The datasets were analyzed individually and integratedly using various bioinformatics approaches. Great variations in gut microbiota abundance and composition were observed in inflammation and CRC. The abundances of Bacteroides, S24-7_group_unidifineted, and Allobaculum were significantly changed in inflammation and CRC. The abundances of Bacteroides and Allobaculum were significantly different between inflammation and CRC. Furthermore, strong excluding and appealing microbial interactions were found in the gut microbiota. CRC and inflammation presented specific fecal metabolome profiling. Fecal metabolomic analysis led to the identification and quantification of 1,138 metabolites with 32 metabolites significantly changed in CRC and inflammation. 1,17-Heptadecanediol and 24,25,26,27-Tetranor-23-oxo-hydroxyvitamin D3 were potential biomarkers for CRC. 3α,7β,12α-Trihydroxy-6-oxo-5α-cholan-24-oic Acid and NNAL-N-glucuronide were potential biomarkers for inflammation. The significantly changed bacterial species and metabolites contribute to inflammation and CRC diagnosis. Integrated microbiome and metabolomic analysis correlated microbes with host metabolites, and the variated microbe-metabolite association in inflammation and CRC suggest that microbes facilitate tumorigenesis of CRC through interfering host metabolism.
Keywords: colorectal cancer; gut microbiota; inflammation; metabolome; microbiome.
Copyright © 2022 Liu, Qi, Qiu, Wang, Xie, Zhao, Wu and Song.
Conflict of interest statement
Authors JL, FW, and SX were employed by the Jiangsu Simcere Pharmaceutical Co., Ltd. The remaining authors declare that the research was conducted in the absence of any commercial or financial relationships that could be construed as a potential conflict of interest.
Figures
Similar articles
-
Integrated microbiome and metabolome analysis reveals a novel interplay between commensal bacteria and metabolites in colorectal cancer.Theranostics. 2019 May 31;9(14):4101-4114. doi: 10.7150/thno.35186. eCollection 2019. Theranostics. 2019. PMID: 31281534 Free PMC article.
-
Fecal Metabolomic Signatures in Colorectal Adenoma Patients Are Associated with Gut Microbiota and Early Events of Colorectal Cancer Pathogenesis.mBio. 2020 Feb 18;11(1):e03186-19. doi: 10.1128/mBio.03186-19. mBio. 2020. PMID: 32071266 Free PMC article.
-
Alterations of the Gut Microbiome and Fecal Metabolome in Colorectal Cancer: Implication of Intestinal Metabolism for Tumorigenesis.Front Physiol. 2022 May 4;13:854545. doi: 10.3389/fphys.2022.854545. eCollection 2022. Front Physiol. 2022. PMID: 35600308 Free PMC article.
-
Progress of gut microbiome and its metabolomics in early screening of colorectal cancer.Clin Transl Oncol. 2023 Jul;25(7):1949-1962. doi: 10.1007/s12094-023-03097-6. Epub 2023 Feb 15. Clin Transl Oncol. 2023. PMID: 36790675 Review.
-
Significance of the gut microbiome in multistep colorectal carcinogenesis.Cancer Sci. 2020 Mar;111(3):766-773. doi: 10.1111/cas.14298. Epub 2020 Feb 3. Cancer Sci. 2020. PMID: 31910311 Free PMC article. Review.
Cited by
-
Lactobacillus plantarum Zhang-LL Inhibits Colitis-Related Tumorigenesis by Regulating Arachidonic Acid Metabolism and CD22-Mediated B-Cell Receptor Regulation.Nutrients. 2023 Oct 25;15(21):4512. doi: 10.3390/nu15214512. Nutrients. 2023. PMID: 37960165 Free PMC article.
-
Research progress on the correlation between intestinal flora and colorectal cancer.Front Oncol. 2024 Jul 17;14:1416806. doi: 10.3389/fonc.2024.1416806. eCollection 2024. Front Oncol. 2024. PMID: 39087025 Free PMC article. Review.
-
Chronic binge drinking-induced susceptibility to colonic inflammation is microbiome-dependent.Gut Microbes. 2024 Jan-Dec;16(1):2392874. doi: 10.1080/19490976.2024.2392874. Epub 2024 Aug 20. Gut Microbes. 2024. PMID: 39163515 Free PMC article.
-
Investigation of trends in gut microbiome associated with colorectal cancer using machine learning.Front Oncol. 2023 Mar 1;13:1077922. doi: 10.3389/fonc.2023.1077922. eCollection 2023. Front Oncol. 2023. PMID: 36937384 Free PMC article.
References
-
- Bao J., Lv Y., Liu C., Li S., Yin Z., Yu Y., et al. (2022). Performance evaluation of rhamnolipids addition for the biodegradation and bioutilization of petroleum pollutants during the composting of organic wastes with waste heavy oil. iScience 25:104403. 10.1016/j.isci.2022.104403 - DOI - PMC - PubMed
-
- Chen F., Dai X., Zhou C. C., Li K. X., Zhang Y. J., Lou X. Y., et al. (2022). Integrated analysis of the faecal metagenome and serum metabolome reveals the role of gut microbiome-associated metabolites in the detection of colorectal cancer and adenoma. Gut 71 1315–1325. 10.1136/gutjnl-2020-323476 - DOI - PMC - PubMed
LinkOut - more resources
Full Text Sources