Review
. 2021 Jul 3:2:100017.
doi: 10.1016/j.crneur.2021.100017. eCollection 2021.

The role of transcranial magnetic stimulation in understanding attention-related networks in single subjects

Affiliations
Review

The role of transcranial magnetic stimulation in understanding attention-related networks in single subjects

B E Yeager et al. Curr Res Neurobiol. .

Abstract

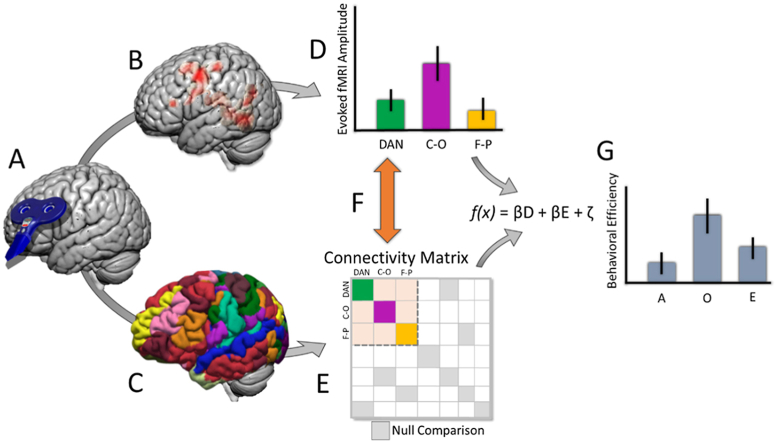
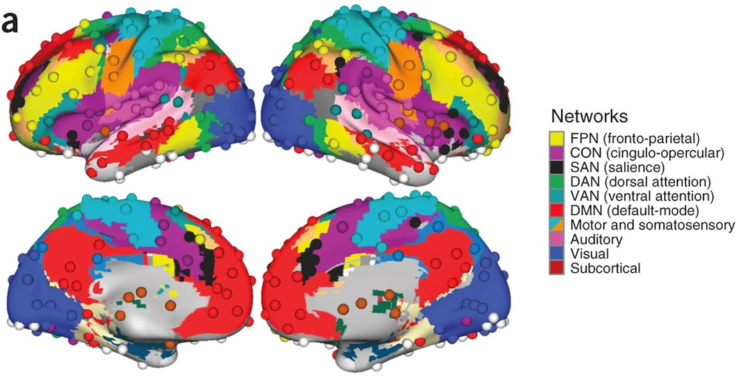
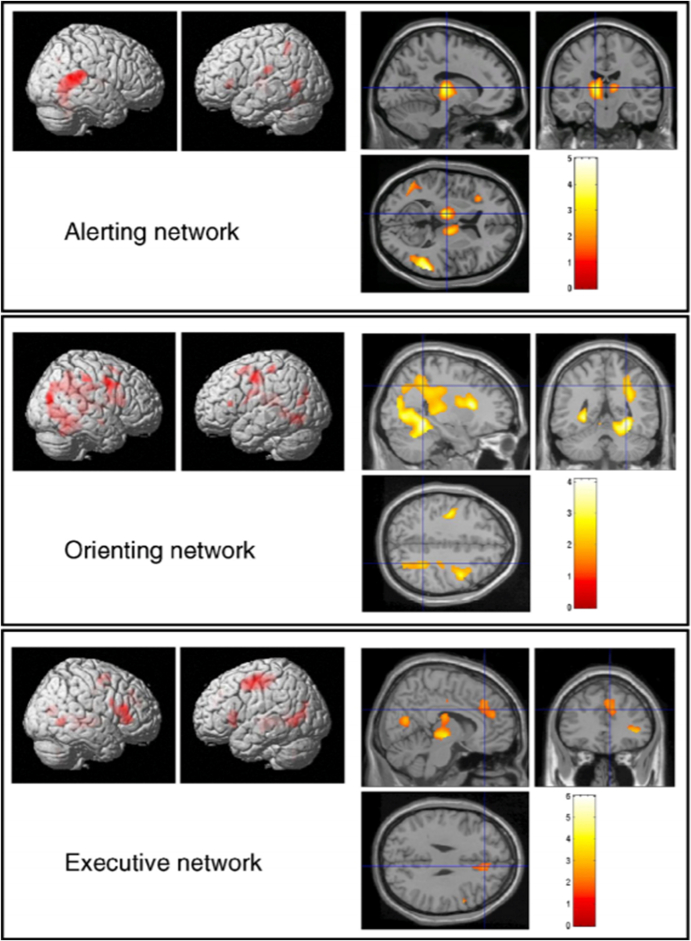
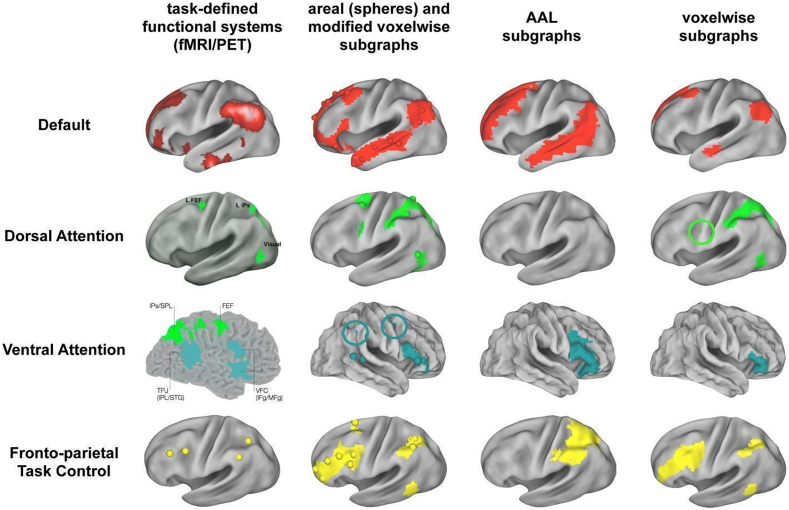
Attention is a cognitive mechanism that has been studied through several methodological viewpoints, including animal models, MRI in stroke patients, and fMRI in healthy subjects. Activation-based fMRI research has also pointed to specific networks that activate during attention tasks. Most recently, network neuroscience has been used to study the functional connectivity of large-scale networks for attention to reveal how strongly correlated networks are to each other when engaged in specific behaviors. While neuroimaging has revealed important information about the neural correlates of attention, it is crucial to better understand how these processes are organized and executed in the brain in single subjects to guide theories and treatments for attention. Noninvasive brain stimulation is an effective tool to causally manipulate neural activity to detect the causal roles of circuits in behavior. We describe how combining transcranial magnetic stimulation (TMS) with modern precision network analysis in single-subject neuroimaging could test the roles of regions, circuits, and networks in regulating attention as a pathway to improve treatment effect magnitudes and specificity.

Keywords: Attention; Network neuroscience; Network parcellation; Neuromodulation; Personalized neuromodulation; TMS.


Conflict of interest statement

The authors declare that they have no known competing financial interests or personal relationships that could have appeared to influence the work reported in this paper.

Figures

Image 1
Graphical abstract
Fig. 1
Fig. 1
Network partition of 264 putative functional regions described previously. The ten major networks (node communities) are labeled on the right. Figure reproduced with permission (Cole et al., 2016).
Fig. 2
Fig. 2
Event-related fMRI results indicating cortical activation of the three attention networks. The alerting network view displays activation of the frontoparietal network and thalamus. The orienting network view displays activation of the parietal network. The executive network view displays activation of the anterior cingulate cortex. Figure reproduced with permission (Fan et al., 2005).
Fig. 3
Fig. 3
Graph Definition Dictates Fidelity to Functional Brain Organization. At left, the task-defined locations of four established functional systems. The next three columns display, for the main cohort, the single subgraph that best corresponds to each functional system under the four graph definitions. Circles are placed around small portions of subgraphs that might otherwise be overlooked. Caption and figure reproduced with permission (Power et al., 2011).
Fig. 4
Fig. 4
Distinct frontoparietal and cingulo-opercular control networks. (a) The network structure of human control networks is displayed in a two-dimensional graph layout. Black lines indicate strong resting state functional connections between brain regions. The thickness of the lines indicates the relative connection strength (r). A spring-embedding algorithm (Net-Draw) was used to generate the 2D graph layout (Kamada and Kawai, 1989). This algorithm treats each connection as a spring; thus, brain regions with similar patterns of connections are brought closer together in 2D space. This method arranges the nodes of a graph in ‘connection space’ rather than anatomical space. Regions sharing connections are placed close together, whereas minimally connected regions are spatially distant. For example, the left and right IPS have similar connectivity profiles and are therefore positioned closely adjacent in the network graph. For each region (circle), the central color indicates which network it belongs to (black = cingulo-opercular; blue = cerebellar and yellow = frontoparietal). The outer color indicates the predominant control signal type of each region (red = set-maintenance; blue = error-related and yellow = start cue-related). At the displayed correlation threshold (r ≥ 0.15), the cingulo-opercular and frontoparietal networks are not directly connected to each other, but each network is connected to the cerebellar error-network through regions that also carry error information (the thalamus, dlPFC and IPL). This architecture suggests that both networks might be communicating error signals (or codes) to and from the cerebellum, in parallel. (b) Distinct cingulo-opercular (black) and frontoparietal (yellow) control networks, in addition to cerebellar regions (blue circles) are shown on an inflated surface rendering of the human brain. Caption and figure reproduced with permission (Dosenbach et al., 2008).
Fig. 5
Fig. 5
Distribution of the E-field's magnitude induced during TMS. The figure shows an E-field's magnitude in the GM volume using a common figure-eight style coil. Figure and caption reproduced with permission (Salvador et al., 2015).
Fig. 6
Fig. 6
A comprehensive figure depicting the effects of cTBS, iTBS, and rTMS on the three sub-components of attention: alerting, orienting, and executive control. Xs indicate that there was no significant change in performance of the sub-function of attention as compared to the sham condition. An arrow pointing down indicates a deficit in performance for that sub-function. An arrow pointing up indicates an improvement in performance for that subfunction. Inhibitory stimulation to left hemispheric regions and excitatory stimulation to right hemispheric regions improve attention-related behaviors.
Fig. 7
Fig. 7
Parcellating the functional networks in an individual subject's brain using an iterative adjusting approach. The technique includes the following steps: 1) A population-based functional brain atlas was registered onto the individual subject's cortical surface using FreeSurfer. The individual subject's BOLD signal time courses were then averaged across the vertices that fall within each network. These atlas-based network time courses were used as the “reference signals” for the subsequent optimization procedure. 2) The individual subject's BOLD signal at each vertex was then correlated to the 18 “reference signals”. Each vertex was reassigned to one of the 18 networks according to its maximal correlation to the “reference signals”. A confidence value was also computed as the ratio between the largest and the second largest correlation values. After each vertex was reassigned, the BOLD signals of the high confidence vertices (e.g., >1.1) in each network were then averaged and termed the “core signal”. 3) For each network, the “core signal” derived from Step 2 and the original “reference signals” derived from Step 1 were averaged in a weighted manner. Specifically, the “core signal” was multiplied by the weighting parameters derived from inter-subject variability and SNR, as well as the number of iterations. The averaged signal was used as the new “reference signal” for the next iteration. Using these new “reference signals”, the brain vertices were further reassigned to one of the 18 networks. 4) Steps 2 & 3 were repeated until the algorithm reached a pre-defined stopping criterion. Figure and caption adapted with permission (Wang et al., 2015).
Fig. 8
Fig. 8
Two brains run through a parcellation method to create individualized network maps. The various colors in the top-most photos represent the same networks in two different subjects. However, their expression is clearly not the same. The bottom-most photos display two distinct brain networks between brains. The lime green bullseye refers to a target for stimulation of the red network. The pink bullseye refers to a target for stimulation of the blue network. It is clear that these networks and their targets are not in the same location between subjects which corroborates the idea that group-level targeting is not optimal nor accurate.
Fig. 9
Fig. 9
Integrating methods for precision modulation and cognitive discovery. (A) Neuromodulation can be applied to modulate brain activity by stimulating brain networks (B) Brain stimulation can increase or decrease brain activity in specific regions. (C) The brain can be parcellated into distinct neural networks to reveal an individual's network organization. This parcellation can show where specific networks are within subjects. (D) Evoked amplitude can be measured across specific brain networks, here specifically the dorsal attention network (DAN), cingulo-opercular network (C–O), and frontoparietal network (F–P), to understand how networks activate during a task. (E) Functional connectivity of networks can be measured to understand how networks temporally activate during a task or at rest. This connectivity matrix reveals how strongly a network is connected to itself or other networks (e.g., as the sum of connectivity weights such as correlation or coherence within and between networks). Here, the functional connectivity of the same networks described in (D) could be more strongly predictive of behavior and activation than other networks. This hypothesis can be tested with models trained using data from equally sized network connectivity values from other networks. (F) Connectivity could predict functional activation within networks. (G) Attention-related behavior can be predicted based on the (D) activation-based research or the (E) connectivity-based research as a combined weighting of the activation and connectivity data. The bars representing behavioral efficiency are in grey because it is not known in advance whether one single network is responsible for one sub-function of attention; instead, it may be a combination of networks that impact behavioral performance. This defines the frontier of discovery for TMS-fMRI paradigms for attention.

Similar articles

Cited by

References

    1. Ahdab R., Ayache S.S., Brugieres P., Goujon C., Lefaucheur J.P. Comparison of “standard” and “navigated” procedures of TMS coil positioning over motor, premotor and prefrontal targets in patients with chronic pain and depression. Neurophysiologie Clinique/Clin. Neurophysiol. 2010;40(1):27–36. - PubMed
    1. Anderson M.L. Neural reuse: a fundamental organizational principle of the brain. Behav. Brain Sci. 2010;33(4):245–266. - PubMed
    1. Andrews-Hanna J.R. The brain's default network and its adaptive role in internal mentation. Neuroscientist. 2012;18(3):251–270. - PMC - PubMed
    1. Aston-Jones G., Cohen J.D. An integrative theory of locus coeruleus-norepinephrine function: adaptive gain and optimal performance. Annu. Rev. Neurosci. 2005;28:403–450. - PubMed
    1. Baluch F., Itti L. Mechanisms of top-down attention. Trends Neurosci. 2011;34(4):210–224. - PubMed

LinkOut - more resources