

Unnecessary reliance on multilevel modelling to analyse nested data in neuroscience: When a traditional summary-statistics approach suffices
- PMID: 36246511
- PMCID: PMC9559079
- DOI: 10.1016/j.crneur.2021.100024
Unnecessary reliance on multilevel modelling to analyse nested data in neuroscience: When a traditional summary-statistics approach suffices
Abstract
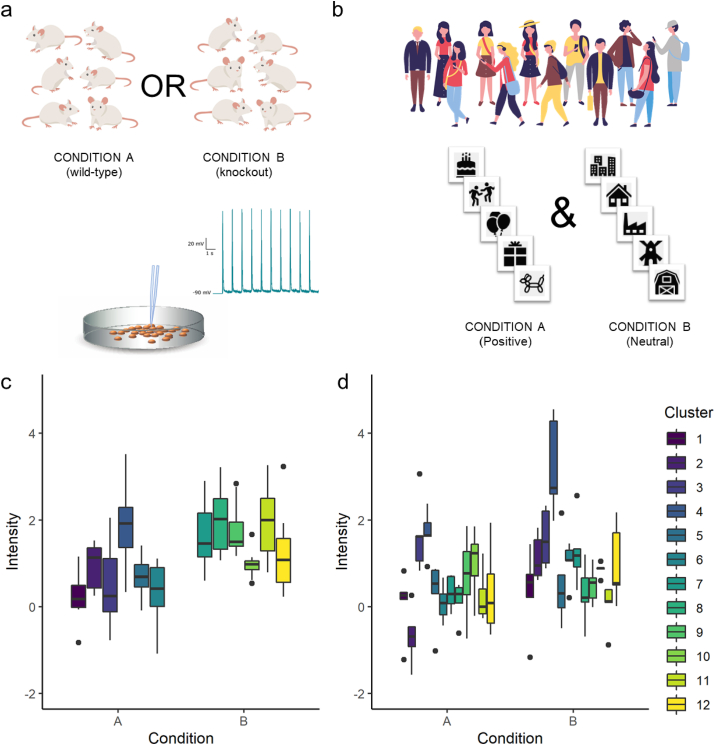
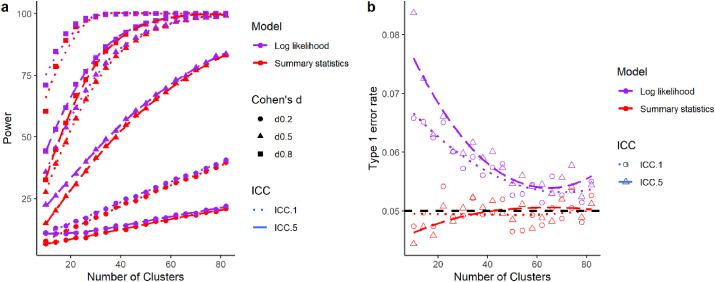
Nested data structures create statistical dependence that influences the effective sample size and statistical power of a study. Several methods are available for dealing with nested data, including the summary-statistics approach and multilevel modelling (MLM). Recent publications have heralded MLM as the best method for analysing nested data, claiming benefits in power over summary-statistics approaches (e.g., the t-test). However, when cluster size is equal, these approaches are mathematically equivalent. We conducted statistical simulations demonstrating equivalence of MLM and summary-statistics approaches for analysing nested data and provide supportive cases for the utility of the conventional summary-statistics approach in nested experiments. Using statistical simulations, we demonstrate that losses in power in the summary-statistics approach discussed in the previous literature are unsubstantiated. We also show that MLM sometimes suffers from frequent singular fit errors, especially when intraclass correlation is low. There are indeed many situations in which MLM is more appropriate and desirable, but researchers should be aware of the possibility that simpler analysis (i.e., summary-statistics approach) does an equally good or even better job in some situations.
Keywords: Clustering; Hierarchical linear model; Mixed model; t-test.
© 2021 The Authors.
Conflict of interest statement
The authors declare that they have no known competing financial interests or personal relationships that could have appeared to influence the work reported in this paper.
Figures


Similar articles
-
Commentary on Unnecessary reliance on multilevel modelling to analyse nested data in neuroscience: When a traditional summary-statistics approach suffices.Curr Res Neurobiol. 2022 May 20;3:100041. doi: 10.1016/j.crneur.2022.100041. eCollection 2022. Curr Res Neurobiol. 2022. PMID: 36685767 Free PMC article. Review. No abstract available.
-
Multilevel modeling myths.Sch Psychol Q. 2018 Sep;33(3):492-499. doi: 10.1037/spq0000272. Epub 2018 Aug 2. Sch Psychol Q. 2018. PMID: 30070555
-
Summary-statistics-based power analysis: A new and practical method to determine sample size for mixed-effects modeling.Psychol Methods. 2022 Dec;27(6):1014-1038. doi: 10.1037/met0000330. Epub 2022 Jan 31. Psychol Methods. 2022. PMID: 35099237
-
The relationship between multilevel models and non-parametric multilevel mixture models: Discrete approximation of intraclass correlation, random coefficient distributions, and residual heteroscedasticity.Br J Math Stat Psychol. 2016 Nov;69(3):316-343. doi: 10.1111/bmsp.12073. Br J Math Stat Psychol. 2016. PMID: 27458827
-
Bridging the gap between multilevel modeling and economic methods.Soc Sci Res. 2022 May;104:102689. doi: 10.1016/j.ssresearch.2021.102689. Epub 2022 Jan 29. Soc Sci Res. 2022. PMID: 35400392 Review.
Cited by
-
Estradiol protects against pain-facilitated fentanyl use via suppression of opioid-evoked dopamine activity in males.Neuron. 2025 May 7;113(9):1413-1429.e5. doi: 10.1016/j.neuron.2025.02.013. Epub 2025 Mar 10. Neuron. 2025. PMID: 40068677
-
Organization-Level Factors Associated with Changes in the Delivery of the Five A's for Smoking Cessation following the Implementation of a Comprehensive Tobacco-Free Workplace Program within Substance Use Treatment Centers.Int J Environ Res Public Health. 2022 Sep 20;19(19):11850. doi: 10.3390/ijerph191911850. Int J Environ Res Public Health. 2022. PMID: 36231153 Free PMC article.
-
Determining how many cells to average for statistical testing of microscopy experiments.J Cell Biol. 2024 Aug 5;223(8):e202401074. doi: 10.1083/jcb.202401074. Epub 2024 Jun 26. J Cell Biol. 2024. PMID: 38922298 Free PMC article.
-
To see or not to see: the parallel processing of self-relevance and facial expressions.Cogn Res Princ Implic. 2023 Nov 22;8(1):70. doi: 10.1186/s41235-023-00524-8. Cogn Res Princ Implic. 2023. PMID: 37991559 Free PMC article.
-
Commentary on Unnecessary reliance on multilevel modelling to analyse nested data in neuroscience: When a traditional summary-statistics approach suffices.Curr Res Neurobiol. 2022 May 20;3:100041. doi: 10.1016/j.crneur.2022.100041. eCollection 2022. Curr Res Neurobiol. 2022. PMID: 36685767 Free PMC article. Review. No abstract available.
References
-
- Aarts E., Verhage M., Veenvliet J.V., Dolan C.V., Van Der Sluis S. A solution to dependency: using multilevel analysis to accommodate nested data. Nat. Neurosci. 2014;17:491. - PubMed
-
- Achen C.H. Two-step hierarchical estimation: beyond regression analysis. Polit. Anal. 2005;13:447–456.
-
- Baayen R.H., Davidson D.J., Bates D.M. Mixed-effects modeling with crossed random effects for subjects and items. J. Mem. Lang. 2008;59:390–412.
LinkOut - more resources
Full Text Sources
