. 2022 Jul;20(7):373-386.
doi: 10.1002/lom3.10494. Epub 2022 May 24.

A method for tracking the Brownian motion to estimate the size distribution of submicron particles in seawater

Affiliations

A method for tracking the Brownian motion to estimate the size distribution of submicron particles in seawater

Yuanheng Xiong et al. Limnol Oceanogr Methods. 2022 Jul.

Abstract

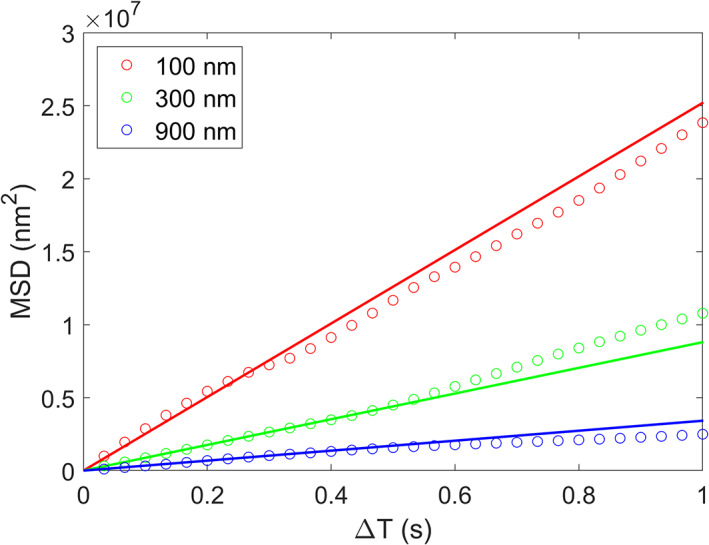
Because the diffusivity of particles undergoing the Brownian motion is inversely proportional to their sizes, the size distribution of submicron particles can be estimated by tracking their movement. This particle tracking analysis (PTA) has been applied in various fields, but mainly focused on resolving monodispersed particle populations and is rarely used for measuring oceanic particles that are naturally polydispersed. We demonstrated using Monte Carlo simulation that, in principle, PTA can be used to size natural, oceanic particles. We conducted a series of lab experiments using microbeads of NIST-traceable sizes to evaluate the performance of ViewSizer 3000, a PTA-based commercial instrument, and found two major uncertainties: (1) the sample volume varies with the size of particles and (2) the signal-to-noise ratio for particles of sizes < 200-250 nm was reduced and hence their concentration was underestimated with the presence of larger particles. After applying the volume correction, we found the instrument can resolve oceanic submicron particles of sizes greater than 250 nm with a mean absolute error of 3.9% in size and 38% in concentration.


Figures

Fig. 1
Fig. 1
The Brownian motion simulated for 10 s with a 1/30 s interval for 3 particles of sizes 100, 300, and 900 nm. The darker curves are the particle trajectories in three‐dimension and the brighter curves are their two‐dimensional projections onto XY, YZ, and ZX planes.
Fig. 2
Fig. 2
The MSDs calculated for three particles shown in Fig. 1 with different ΔT values. The solid lines have slopes of values = 4D (Eq. 3).
Fig. 3
Fig. 3
(a) Comparison of PSDs between the input values (black lines) and those derived from PTA (colored curves) using four different approaches: Three‐dimension direct estimate with ΔT = 1/30 s, two‐dimension direct estimate with ΔT = 1/30 s, two‐dimension direct estimate with ΔT = 1/6 s, and two‐dimension regression over ΔT = 1/30–1/6 s. See text for details. (b) The coefficients of variation estimated for the derived PSDs.
Fig. 4
Fig. 4
Same as Fig. 3a but for input PSDs of normal distribution.
Fig. 5
Fig. 5
Same as Fig.  3a but for input PSDs of power‐law distribution with slopes = −3 (a), −4 (b), and −5 (c).
Fig. 6
Fig. 6
Picture of a ViewSizer 3000 (left) showing the approximate location of the cuvette with a black insert inside (middle). Three laser beams (450, 520, and 650 nm) illuminate the sample inside the insert simultaneously and an imaging system record the scattered light at 90° relative to the incident light. The black diagram on the right shows the location and dimension of the focal plane, which has an area of 288 μm × 162 μm. The depth of field varies slightly with the size of particles, averaging 52 μm.
Fig. 7
Fig. 7
PSDs of four ultrapure water samples (gray curves) measured by ViewSizer 3000. Their 5‐point smoothed mean values (black curve) serve as the blank. For comparison, the PSDs measured for two monodispersed beads of sizes 152 and 600 nm and their blank‐subtracted values are also shown.
Fig. 8
Fig. 8
Comparison of PSDs between calculated based on the specification (black curves) and measured by ViewSizer 3000 (dotted red curves) for beads of different diameters. The measured PSDs were further (1) fitted to a normal distribution (solid red curves) and (2) scaled by the volume correction factor (solid blue curves).
Fig. 9
Fig. 9
Evaluation of monodispersed bead populations measured by ViewSizer 3000. (a) Comparison of mean diameters of the beads between measured and specified values. (b) The ratio of measured to prepared concentration of the beads as a function of the mean bead diameter.
Fig. 10
Fig. 10
Examples of PSDs measured for four polydispersed bead solutions: (a) 152/400/903 nm, (b) 152/303/400/600/702/903 nm, (c and d) 100/152/203/303/400/600/702/903 nm with different concentration for each size. In each panel, the blue curve and shaded area are the average and standard deviation of six repeated measurements after applying the volume correction factor; the black curve is PSD constructed from the measurements of monodispersed bead solutions.
Fig. 11
Fig. 11
Measured beads concentrations for sizes > 200 nm with (blue) and without (red) applying the volume correction factor are compared with prepared concentrations for the polydispersed beads samples. A 1:1 black line is shown for reference.
Fig. 12
Fig. 12
Histogram of signals and backgrounds of 100, 203, and 903 nm beads in monodispersed solutions recorded in the red, green and blue bands of ViewSizer 3000. For each bead, a 60 × 60 pixel section (black frame) was extracted from each band of the recorded video. The signal was then extracted from the color frame that contains the bead and the background was extracted from the white frame away from the bead.
Fig. 13
Fig. 13
PSDs measured by ViewSizer 3000 after applying the volume correction and by the Coulter Counter during the EXPORTS‐2018 cruise (gray curves). The darker gray curves represent the PSDs measured by ViewSizer 3000 after applying both the volume correction and discarding data at sizes < 250 nm. Blue and red curves represent one example of the PSDs of the same water sample measured by the two instruments. The dotted black line represents the extrapolation of the Coulter Counter data (red curve) from 2 to 20 μm fitted to a power‐law distribution. The dotted blue curve represents the PSD corresponding to the blue curve but before applying the volume correction.

Similar articles

Cited by

References

    1. Ackleson, S. G. , and Spinrad R. W.. 1988. Size and refractive index of individual marine particulates: A flow cytometric approach. Appl. Optics 27: 1270–1277. doi:10.1364/AO.27.001270 - DOI - PubMed
    1. Agagliate, J. , Röttgers R., Twardowski M. S., and McKee D.. 2018. Evaluation of a flow cytometry method to determine size and real refractive index distributions in natural marine particle populations. Appl. Optics 57: 1705–1716. doi:10.1364/AO.57.001705 - DOI - PubMed
    1. Anderson, W. , Kozak D., Coleman V. A., Jämting Å. K., and Trauac M.. 2013. A comparative study of submicron particle sizing platforms: Accuracy, precision and resolution analysis of polydisperse particle size distributions. J. Colloid Interface Sci. 405: 322–330. doi:10.1016/j.jcis.2013.02.030 - DOI - PubMed
    1. Anger, C. D. , and Prescott J. R.. 1970. A Monte Carlo simulation of Brownian motion in the freshman laboratory. Am. J. Phys. 38: 716–719. doi:10.1119/1.1976442 - DOI
    1. Baalousha, M. , Stolpe B., and Lead J. R.. 2011. Flow field‐flow fractionation for the analysis and characterization of natural colloids and manufactured nanoparticles in environmental systems: A critical review. J. Chromatogr. 1218: 4078–4103. doi:10.1016/j.chroma.2011.04.063 - DOI - PubMed

LinkOut - more resources