

Comparative analysis of the chloroplast genomes of eight Piper species and insights into the utilization of structural variation in phylogenetic analysis
- PMID: 36246585
- PMCID: PMC9556897
- DOI: 10.3389/fgene.2022.925252
Comparative analysis of the chloroplast genomes of eight Piper species and insights into the utilization of structural variation in phylogenetic analysis
Abstract
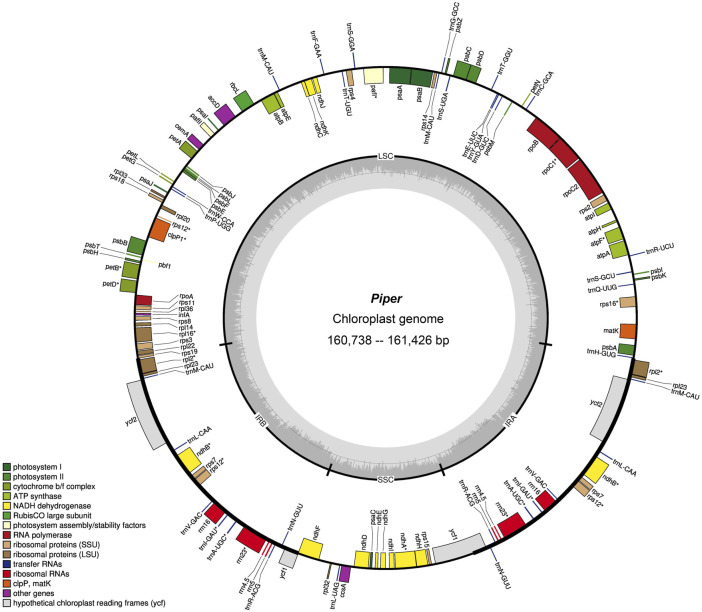
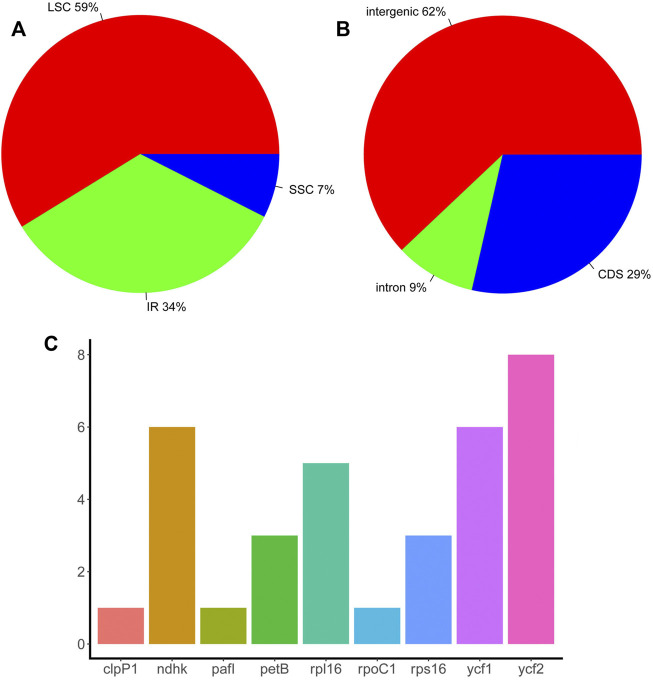
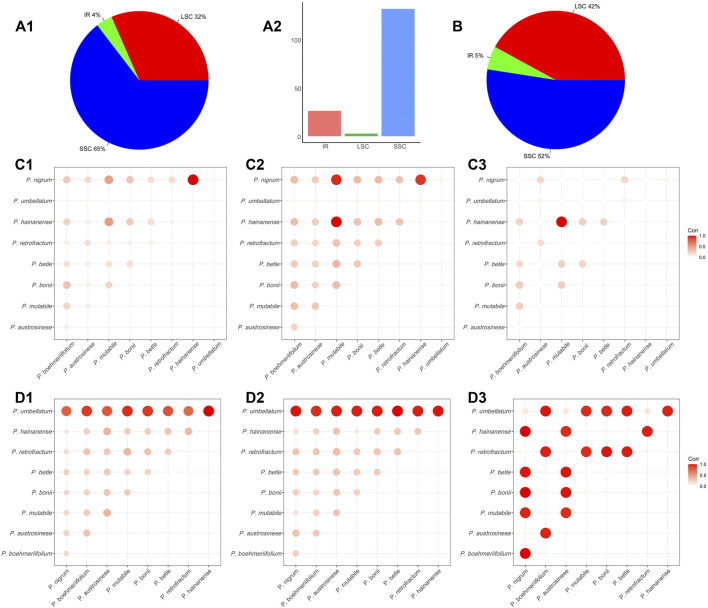
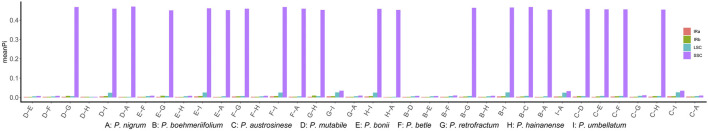
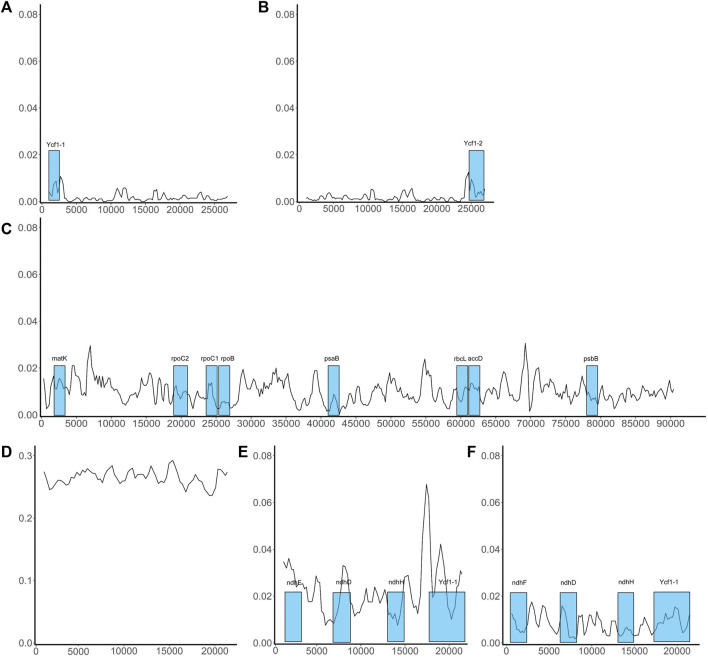
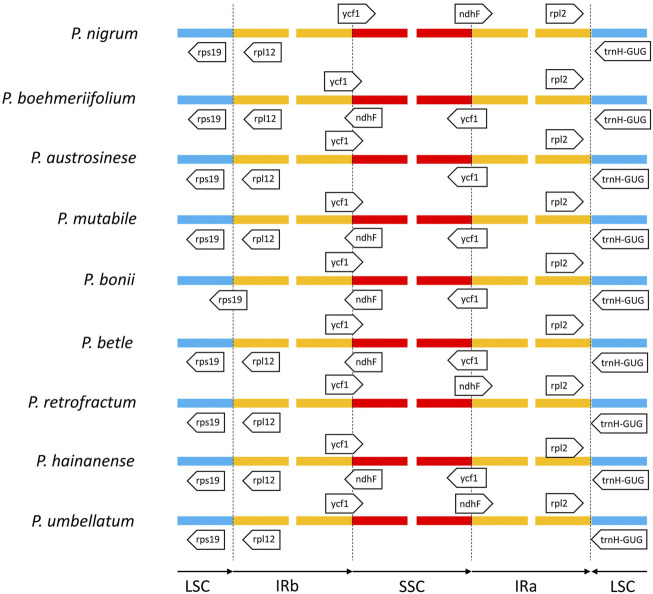
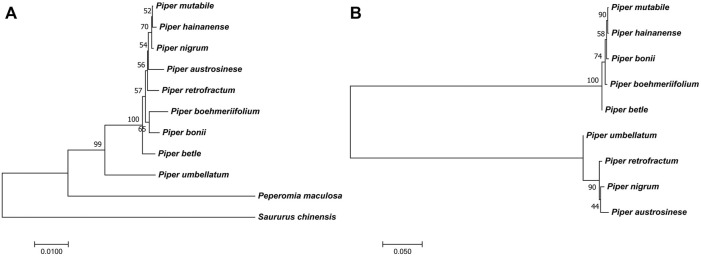
With more than 2000 species, Piper is regarded as having high medicinal, cosmetic, and edible value. There also remain some taxonomic and evolutionary uncertainties about the genus. This study performed chloroplast genome sequencing of eight poorly studied Piper species and a comparative analysis with black pepper (Piper nigrum). All examined species were highly similar in gene content, with 79 protein-coding genes, 24 tRNAs, and four rRNAs. They also harbored significant structural differences: The number of SSRs ranged from 63 to 87, over 10,000 SNPs were detected, and over 1,000 indels were found. The spatial distribution of structural differences was uneven, with the IR and LSC being relatively more conserved and the SSC region highly variable. Such structural variations of the chloroplast genome can help in evaluating the phylogenetic relationships between species, deciding some hard-to-distinguish evolutionary relationships, or eliminating improper markers. The SSC region may be evolving at high speed, and some species showed a high degree of sequence variation in the SSC region, which seriously affected marker sequence detection. Conversely, CDS sequences tended to lack variation, and some CDSs can serve as ideal markers for phylogenetic reconstruction. All told, this study provides an effective strategy for selecting chloroplast markers, analyzing difficult-to-distinguish phylogenetic relationships and avoiding the taxonomic errors caused by high degree of sequence variations.
Keywords: DNA barcode; chloroplast genome; high degree of sequence variations; phylogenetic relationships; piper.
Copyright © 2022 Li, Fan, Xu, Hu, Su and Hao.
Conflict of interest statement
The authors declare that the research was conducted in the absence of any commercial or financial relationships that could be construed as a potential conflict of interest.
Figures

Similar articles
-
The chloroplast genome of black pepper (Piper nigrum L.) and its comparative analysis with related Piper species.Front Plant Sci. 2023 Jan 12;13:1095781. doi: 10.3389/fpls.2022.1095781. eCollection 2022. Front Plant Sci. 2023. PMID: 36714762 Free PMC article.
-
Comparative analysis of complete chloroplast genome sequences of four major Amorphophallus species.Sci Rep. 2019 Jan 28;9(1):809. doi: 10.1038/s41598-018-37456-z. Sci Rep. 2019. PMID: 30692573 Free PMC article.
-
Comparative Analysis of Chloroplast Genome Structure and Phylogenetic Relationships Among Six Taxa Within the Genus Catalpa (Bignoniaceae).Front Genet. 2022 Mar 16;13:845619. doi: 10.3389/fgene.2022.845619. eCollection 2022. Front Genet. 2022. PMID: 35368674 Free PMC article.
-
The comparative studies of complete chloroplast genomes in Actinidia (Actinidiaceae): novel insights into heterogenous variation, clpP gene annotation and phylogenetic relationships.Mol Genet Genomics. 2022 Mar;297(2):535-551. doi: 10.1007/s00438-022-01868-4. Epub 2022 Feb 17. Mol Genet Genomics. 2022. PMID: 35175427
-
A systematic comparison of eight new plastome sequences from Ipomoea L.PeerJ. 2019 Mar 11;7:e6563. doi: 10.7717/peerj.6563. eCollection 2019. PeerJ. 2019. PMID: 30881765 Free PMC article.
Cited by
-
Comparative and phylogenetic analysis of the complete chloroplast genome sequences of Melanoseris cyanea group.Sci Rep. 2025 Mar 27;15(1):10566. doi: 10.1038/s41598-025-95325-y. Sci Rep. 2025. PMID: 40148540 Free PMC article.
-
A comprehensive review on genomic resources in medicinally and industrially important major spices for future breeding programs: Status, utility and challenges.Curr Res Food Sci. 2023 Aug 29;7:100579. doi: 10.1016/j.crfs.2023.100579. eCollection 2023. Curr Res Food Sci. 2023. PMID: 37701635 Free PMC article. Review.
-
The chloroplast genome of black pepper (Piper nigrum L.) and its comparative analysis with related Piper species.Front Plant Sci. 2023 Jan 12;13:1095781. doi: 10.3389/fpls.2022.1095781. eCollection 2022. Front Plant Sci. 2023. PMID: 36714762 Free PMC article.
References
-
- Asmarayani R. (2018). Phylogenetic relationships in malesian–pacific piper (Piperaceae) and their implications for systematics. TAXON 67, 693–724. 10.12705/674.2 - DOI
LinkOut - more resources
Full Text Sources