. 2022 Sep 30:13:984615.
doi: 10.3389/fgene.2022.984615. eCollection 2022.

Critical role of guanylate binding protein 5 in tumor immune microenvironment and predictive value of immunotherapy response

Affiliations

Critical role of guanylate binding protein 5 in tumor immune microenvironment and predictive value of immunotherapy response

Xiang Li et al. Front Genet. .

Abstract

Background: The guanylate-binding proteins (GBPs) are the latest potential targets of immunotherapy. However, the role of GBP5 in pan-cancer, including colorectal cancer (CRC), remains unclear. This study aims to explore the effect of GBP5 on immunity in pan-cancer. Methods: Based on the RNA sequencing data of 33 cancers obtained from The Cancer Genome Atlas, we analyzed the clinical significance of GBPs and focused on the correlation between GBP5 and tumor microenvironment (TME). Immunotherapy cohort IMvigor210 was used to explore the relationship between treatment response and GBPs. Then, we further analyzed the expression of GBP5 in immune cells using single-cell transcriptome cohort GSE146771 and GSE132465 from the Gene Expression Omnibus database. Finally, a prognostic model based on GBP5 expression was established and validated. Results: We found that the expression of GBP3/4/5 is higher in colorectal cancer than in normal tissues, and GBP5 is a better predictor of good treatment response to immune checkpoint blockade than other GBPs. In most other cancers, GBP5 is also elevated in tumors compared with normal tissues and is associated with a better prognosis. As for TME, GBP5 is generally positively correlated with immune score, the level of tumor-infiltrating immune cells and immune-related genes. Single-cell analysis showed that GBP5 was mainly expressed in myeloid cells and T cells. The GBP5-related prognostic model we constructed in CRC can predict the survival of patients and propose some genes for subsequent research. Conclusion: This study revealed a strong correlation between GBP5 and immunity in generalized cancer and provided evidence that CRC may be a suitable cancer type for anti-GBP5 therapy.

Keywords: colorectal cancer; guanylate binding protein 5; immunotherapy; pan-cancer; prognosis; tumor immune microenvironment.


Conflict of interest statement

The authors declare that the research was conducted in the absence of any commercial or financial relationships that could be construed as a potential conflict of interest.

Figures

FIGURE 1
FIGURE 1
Flow chart of this study (A) Data sources of this work. (B) The correlation between GBPs (guanylate-binding proteins) and the effect of immunotherapy (C) Correlation between GBP5 and TME (tumor microenvironment) in pan-cancer (D) Single-cell analysis of GBP5 in CRC (colorectal cancer). (E) Construction of a GBP5-related prognostic model in CRC.
FIGURE 2
FIGURE 2
Differential expression of GBPs and prediction of ICB (immune checkpoint blockade) response (A) GBPs expression difference between tumor and normal tissues in COAD (Colon adenocarcinoma) by GEPIA2. The expressions of GBP1 and GBP2 in normal tissues are significantly higher than those in tumor tissues. The expressions of GBP3, GBP4, and GBP5 in tumor tissues are significantly higher than those in normal tissues. “*” indicates p < 0.05 (B) Differences of GBP3 expression between groups with different responses to immunotherapy in the IMvigor210 cohort. GBP3 expression is 4.451806 ± 1.031910 in PD group, 4.613511 ± 1.052200 in SD group, 4.669342 ± 1.065907 in PR group and 4.679646 ± 1.037475 in CR group. (C) Differences of GBP4 expression between groups with different responses to immunotherapy in the IMvigor210 cohort. GBP4 expression is 3.039644 ± 0.9899737 in PD group, 3.232032 ± 1.0081706 in SD group, 3.205698 ± 1.0478816 in PR group and 3.886223 ± 1.1831482 in CR group. (D) Differences of GBP5 expression between groups with different responses to immunotherapy in the IMvigor210 cohort. GBP5 expression is 2.544213 ± 1.364970 in PD group, 3.044128 ± 1.554900 in SD group, 2.697051 ± 1.501733 in PR group and 3.842866 ± 1.478431 in CR group. PD: progressed disease; SD: stable disease; PR: partial response; CR: complete response.
FIGURE 3
FIGURE 3
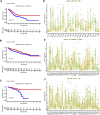
Clinical characteristics of GBP5 in pan-cancer (A–C) In STAD (Stomach adenocarcinoma), COAD (Colon adenocarcinoma), and READ (Rectum adenocarcinoma), the samples are divided into two groups according to the optimum cut-off value. Kaplan-Meier curves show that the high GBP5 expression group had a better short-term prognosis than the low GBP5 expression group. (D–F) Differences of GBP5 expression in different M stage groups, sexgroups, and age groups. The Wilcoxon test is used for the significance test. “*” indicates p < 0.05, “**” indicates p < 0.01 and “***” indicates p < 0.001.
FIGURE 4
FIGURE 4
Correlation between GBP5 and TME in pan-cancer (A) Correlation between GBP5 and ESTIMATE score. (B) Correlation between GBP5 and the infiltration level of TIICs (tumor-infiltrating immune cells) by CIBERSORT (C) Differences of the fraction of TIICs by GSEA (gene set enrichment analysis) between GBP5 high and low expression groups in CRC (D) The expression correlation between GBP5 and immune-related genes. Sorted by correlation values in COAD, the top ten genes were PDCD1LG2 (R = 0.881840593), CD274 (R = 0.865101814), CD86 (R = 0.84128397), TIGIT (R = 0.838645959), HAVCR2 (R = 0.815956551), TNFRSF9 (R = 0.813663547), LAIR1 (R = 0.788751933), CD80 (R = 0.787116939), ICOS (R = 0.767427362), and CTLA4 (R = 0.760401416). “*” indicates p < 0.05, “**” indicates p < 0.01 and “***” indicates p < 0.001.
FIGURE 5
FIGURE 5
Explanation of GBP5 immunogenicity (A) Correlation between GBP5 and TMB (tumor mutation burden) in pan-cancer. Respectively, the correlation number and p-value are 0.15 and 0.0024 in BLCA (Bladder urothelial carcinoma), 0.2 and 5.3e-10 in BRCA (Breast invasive carcinoma), 0.27 and 5.2e-06 in CESC (Cervical squamous cell carcinoma and endocervical adenocarcinoma), 0.28 and 8.3e-09 in COAD, 0.46 and 0.00012 in LAML (Acute myeloid leukemia), 0.24 and 3.7e-08 in LGG (Brain lower grade glioma), 0.18 and 4.9e-05 in LUAD (Lung adenocarcinoma), 0.16 and 0.01 in OV (Ovarian serous cystadenocarcinoma), 0.18 and 0.0045 in SARC (Sarcoma), 0.57 and 1.3e-11 in THYM (Thymoma), 0.32 and 1.2e-13 in UCEC (Uterine corpus endometrial carcinoma) (B) Correlation between GBP5 and MSI (microsatellite instability) in pan-cancer. Respectively, the correlation number and p-value are 0.34 and 5.3e-13 in COAD, 0.16 and 0.049 in READ, 0.17 and 0.00011 in UCEC. (C) Differences of GBP5 expression between hot and cold tumors in CRC. The Wilcoxon test is used for the significance test. “*” indicates p < 0.05, “**” indicates p < 0.01 and “***” indicates p < 0.001.
FIGURE 6
FIGURE 6
Single cell analysis of GBP5 expression in CRC (A) PCA (Principal component analysis) shows no significant separation of CRC samples (B) According to the composition of marker genes, the 20 cell clusters are annotated by singleR and CellMarker. (C) Expression of GBP5 at single cell level in CRC (D) The expression of GBP5, FOXP3, IL2RA and CD274 (PD-L1) in 20 cell clusters.
FIGURE 7
FIGURE 7
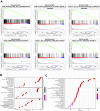
Functional analysis of GBP5 in CRC (A) GSEA identifies different gene sets between high and low expression groups of GBP5. The mononuclear cell differentiation (NES = 2.68, p-val = 0.00, FDR q-val = 0.00), the positive regulation of innate immune response (NES = 2.60, p-val = 0.00, FDR q-val = 0.00), the T cell activation involved in immune response (NES = 2.58, p-val = 0.00, FDR q-val = 0.00), the chemokine signaling pathway (NES = 2.53, p-val = 0.00, FDR q-val = 0.00), the T cell receptor signaling pathway (NES = 2.55, p-val = 0.00, FDR q-val = 0.00), and the JAK STAT signaling pathway (NES = 2.53, p-val = 0.00, FDR q-val = 0.00) are enriched in the GBP5 high expression group (B,C) GO (Gene Ontology) and KEGG (Kyoto Encyclopedia of Genes and Genomes) analysis of DEGs (differentially expressed genes) between GBP5 high and low expression groups.
FIGURE 8
FIGURE 8
Construction and validation of GBP5 related prognostic models in CRC (A) Forest plot in multivariate Cox analysis. (B,C) Kaplan-Meier curves of high- and low-risk score groups in training and test sets (D,E) ROC curves in training and test sets. (F) Risk plot of high- and low-risk score groups.

References

    1. Aran D., Looney A. P., Liu L., Wu E., Fong V., Hsu A., et al. (2019). Reference-based analysis of lung single-cell sequencing reveals a transitional profibrotic macrophage. Nat. Immunol. 20, 163–172. 10.1038/s41590-018-0276-y - DOI - PMC - PubMed
    1. Bonneville R., Krook M. A., Kautto E. A., Miya J., Wing M. R., Chen H. Z., et al. (2017). Landscape of microsatellite instability across 39 cancer types. JCO Precis. Oncol., 1–15. 10.1200/PO.17.00073 - DOI - PMC - PubMed
    1. Butler A., Hoffman P., Smibert P., Papalexi E., Satija R. (2018). Integrating single-cell transcriptomic data across different conditions, technologies, and species. Nat. Biotechnol. 36, 411–420. 10.1038/nbt.4096 - DOI - PMC - PubMed
    1. Chan T. A., Yarchoan M., Jaffee E., Swanton C., Quezada S. A., Stenzinger A., et al. (2019). Development of tumor mutation burden as an immunotherapy biomarker: Utility for the oncology clinic. Ann. Oncol. 30, 44–56. 10.1093/annonc/mdy495 - DOI - PMC - PubMed
    1. Charoentong P., Finotello F., Angelova M., Mayer C., Efremova M., Rieder D., et al. (2017). Pan-cancer immunogenomic analyses reveal genotype-immunophenotype relationships and predictors of response to checkpoint blockade. Cell Rep. 18, 248–262. 10.1016/j.celrep.2016.12.019 - DOI - PubMed