. 2022 Sep 30:13:1034567.
doi: 10.3389/fgene.2022.1034567. eCollection 2022.

A new CCCH-type zinc finger-related lncRNA signature predicts the prognosis of clear cell renal cell carcinoma patients

Affiliations

A new CCCH-type zinc finger-related lncRNA signature predicts the prognosis of clear cell renal cell carcinoma patients

Cheng Shen et al. Front Genet. .

Abstract

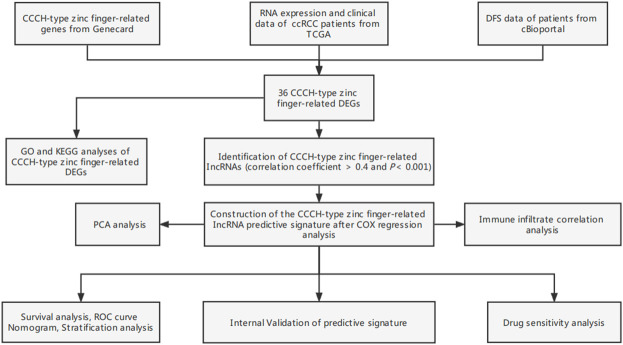
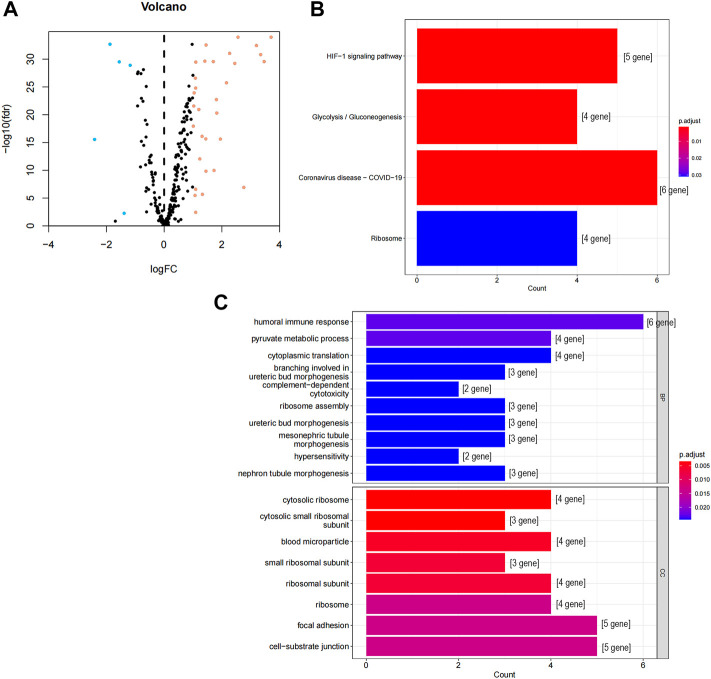
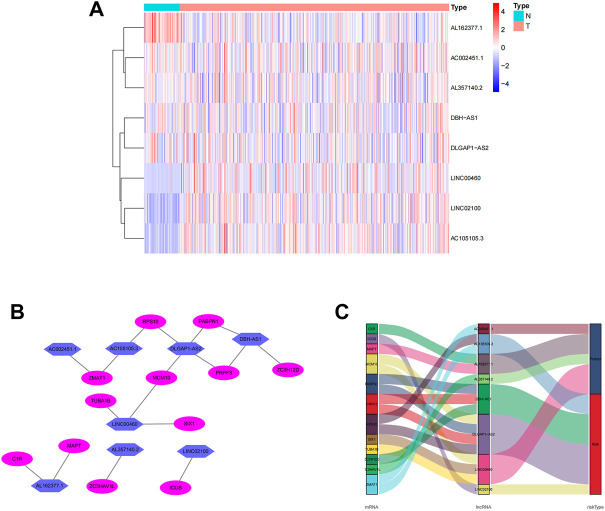
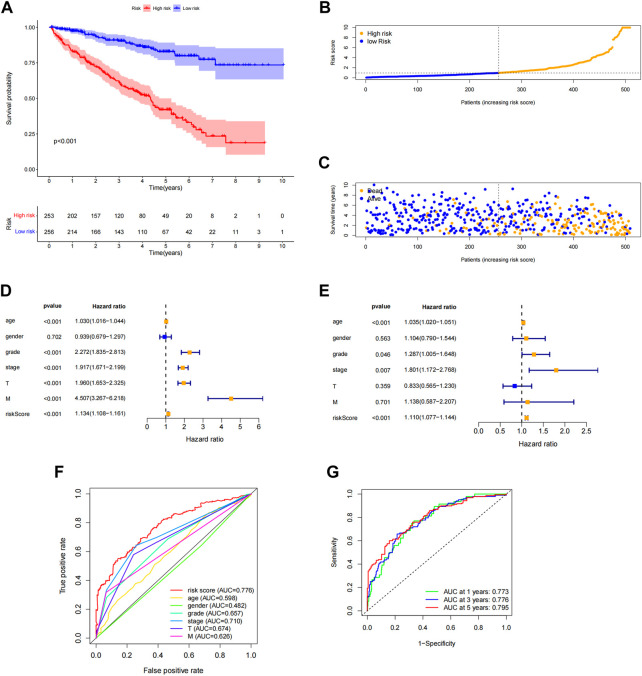
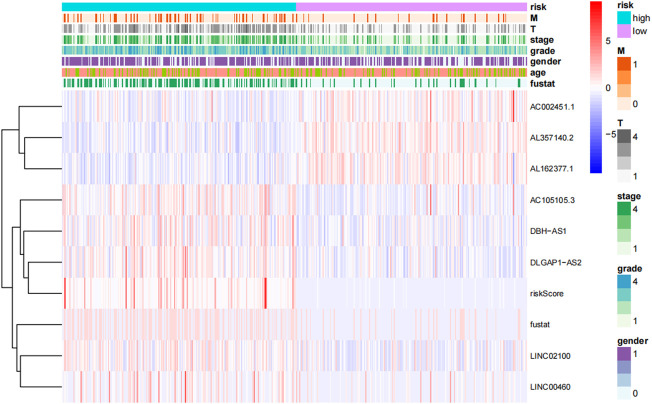
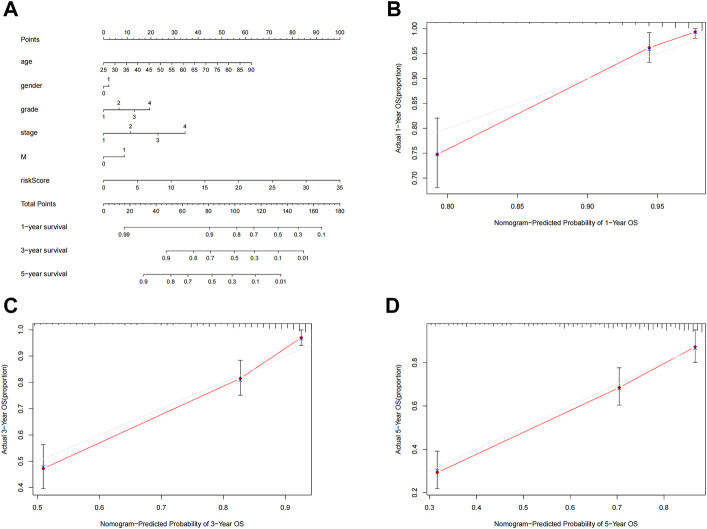
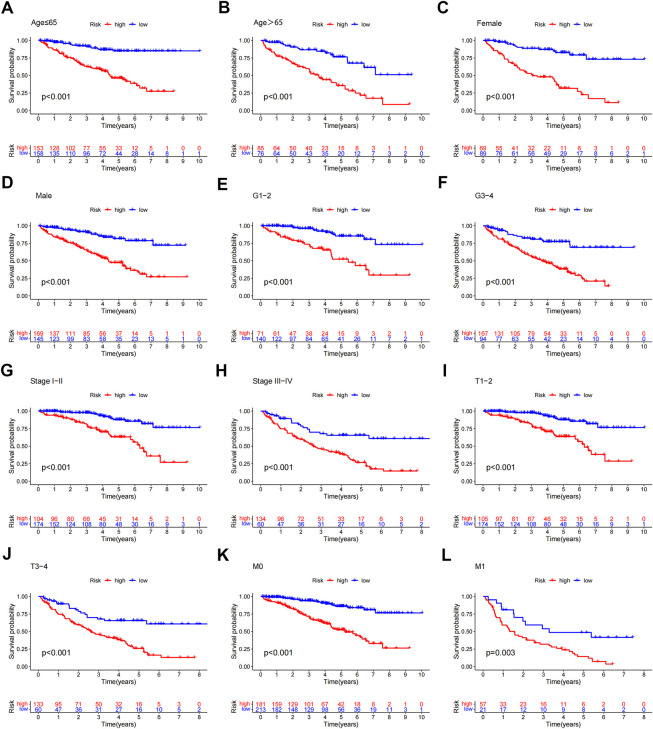
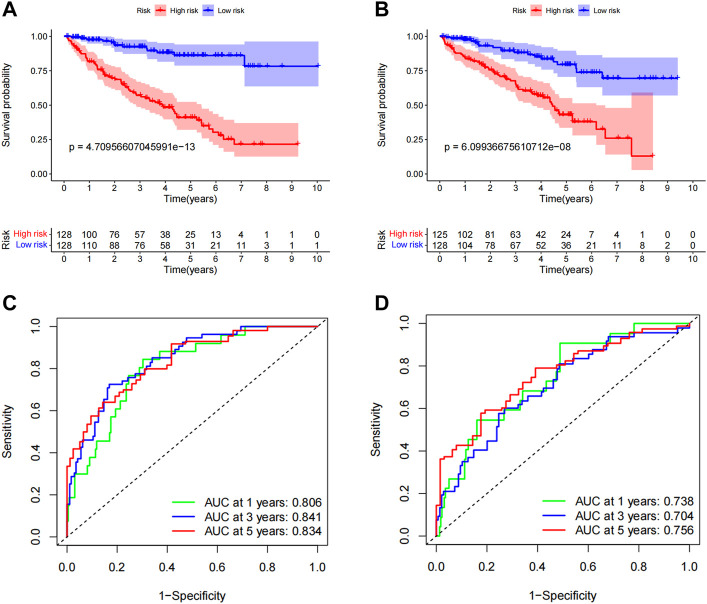
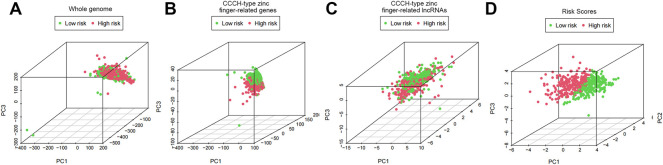
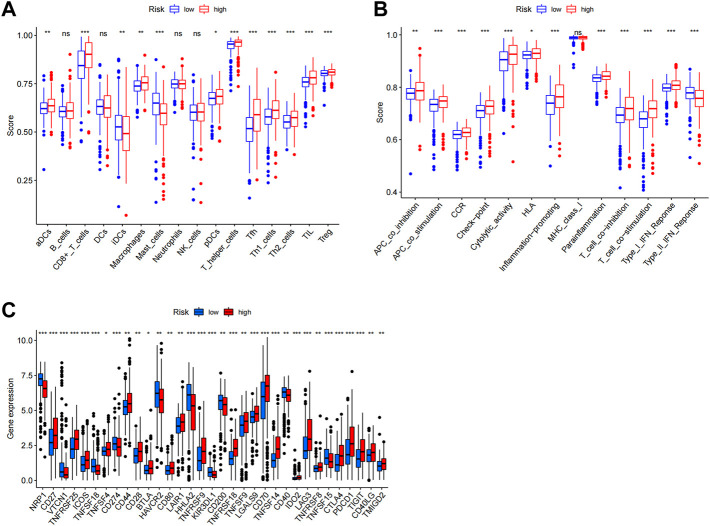
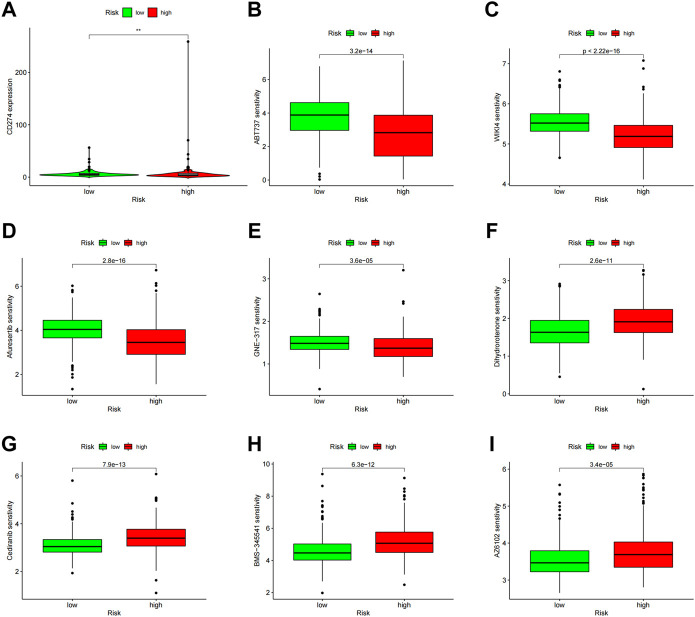
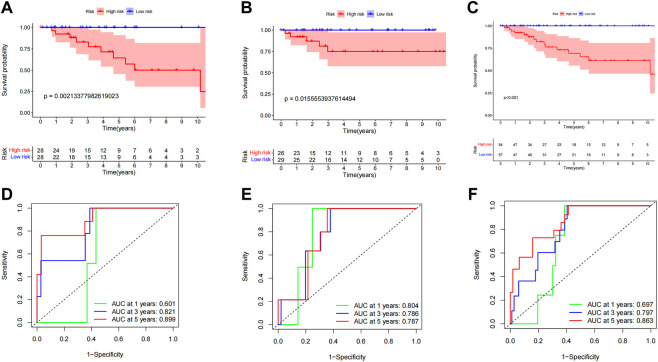
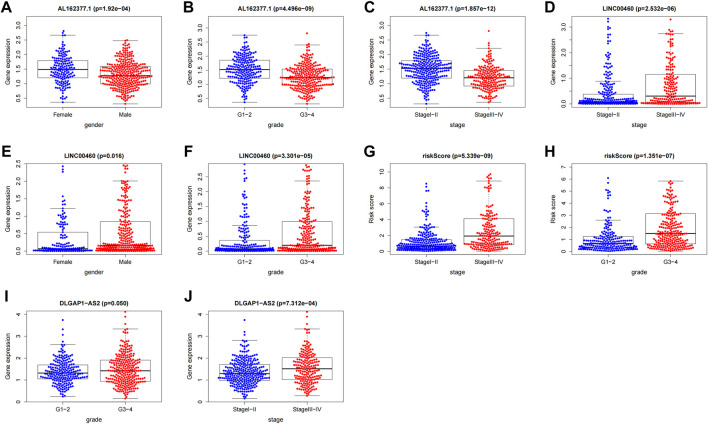
Background: Clear cell renal cell carcinoma (ccRCC) is the main component of renal cell carcinoma (RCC), and advanced ccRCC frequently indicates a poor prognosis. The significance of the CCCH-type zinc finger (CTZF) gene in cancer has been increasingly demonstrated during the past few years. According to studies, targeted radical therapy for cancer treatment may be a revolutionary therapeutic approach. Both lncRNAs and CCCH-type zinc finger genes are essential in ccRCC. However, the predictive role of long non-coding RNA (lncRNA) associated with the CCCH-type zinc finger gene in ccRCC needs further elucidation. This study aims to predict patient prognosis and investigate the immunological profile of ccRCC patients using CCCH-type zinc finger-associated lncRNAs (CTZFLs). Methods: From the Cancer Genome Atlas database, RNA-seq and corresponding clinical and prognostic data of ccRCC patients were downloaded. Univariate and multivariate Cox regression analyses were conducted to acquire CTZFLs for constructing prediction models. The risk model was verified using receiver operating characteristic curve analysis. The Kaplan-Meier method was used to analyze the overall survival (OS) of high-risk and low-risk groups. Multivariate Cox and stratified analyses were used to assess the prognostic value of the predictive feature in the entire cohort and different subgroups. In addition, the relationship between risk scores, immunological status, and treatment response was studied. Results: We constructed a signature consisting of eight CTZFLs (LINC02100, AC002451.1, DBH-AS1, AC105105.3, AL357140.2, LINC00460, DLGAP1-AS2, AL162377.1). The results demonstrated that the prognosis of ccRCC patients was independently predicted by CTZFLs signature and that the prognosis of high-risk groups was poorer than that of the lower group. CTZFLs markers had the highest diagnostic adequacy compared to single clinicopathologic factors, and their AUC (area under the receiver operating characteristic curve) was 0.806. The overall survival of high-risk groups was shorter than that of low-risk groups when patients were divided into groups based on several clinicopathologic factors. There were substantial differences in immunological function, immune cell score, and immune checkpoint expression between high- and low-risk groups. Additionally, Four agents, including ABT737, WIKI4, afuresertib, and GNE 317, were more sensitive in the high-risk group. Conclusion: The Eight-CTZFLs prognostic signature may be a helpful prognostic indicator and may help with medication selection for clear cell renal cell carcinoma.

Keywords: CCCH-type zinc finger; clear cell renal cell carcinoma; drug therapy; immune infiltration; lncRNAs.


Conflict of interest statement

The authors declare that the research was conducted in the absence of any commercial or financial relationships that could be construed as a potential conflict of interest.

Figures

FIGURE 1
FIGURE 1
Study flow chart. ccRCC, clear cell renal cell carcinoma; TCGA, Cancer Genome Atlas; DFS, disease-free survival; DEGs, differentially expressed genes; GO, gene ontology; KEGG, Kyoto Encyclopedia of Genes and Genomes; lncRNAs, long-chain non-coding RNA; ROC, receiver operating characteristic; GSEA, gene enrichment analysis; ssGSEA, single-sample gene set enrichment analysis.
FIGURE 2
FIGURE 2
GO and KEGG analysis of CCCH-type zinc finger-related DEGs in cancer and adjacent tissues. (A) 262 CCCH-type zinc finger-related genes in ccRCC. Yellow dots indicate up-regulated genes and blue dots indicate down-regulated genes. (B) KEGG analysis of CCCH-type zinc finger-related DEGs. (C) GO analysis of CCCH-type zinc finger-related DEGs. GO, gene ontology; KEGG, Kyoto Encyclopedia of Genes and Genomes; DEGs, differentially expressed genes; FC, fold changes; fdr: false discovery rate; BP, biological process; CC, cellular composition.
FIGURE 3
FIGURE 3
Expression levels of eight CCCH-type zinc finger-associated lncRNA and lncRNA-mRNA networks in predicted signals. (A) Expression levels of eight CCCH-type zinc finger-associated lncRNA in ccRCC and normal tissues. (B) Co-expression networks of prognostic CCCH-type zinc finger-associated lncRNAs. (C) Multinograms of prognostic CCCH-type zinc finger-associated lncrna. LncRNAs, long-chain non-coding RNAs; ccRCC, renal clear cell carcinoma; N, normal; T, tumor.
FIGURE 4
FIGURE 4
Association of predictive features with prognosis in ccRCC patients. (A) Kaplan-Meier analysis of OS rates in the high- and low-risk groups of ccRCC patients. (B) Distribution of risk scores in ccRCC patients. (C) Number of deaths and surviving patients with different risk scores. Blue blot indicates the number of survivors and yellow blot indicates the number of deaths. (D) Forest plot of univariate Cox regression analysis. (E) Multivariate Cox regression analysis forest plot. (F) ROC curve of risk score and clinicopathological variables. (G) ROC curve and AUCs of predictive characteristics of 1-year, 3-year and 5-year survival rates. ccRCC, renal clear cell carcinoma; OS, survival rate; ROC, receiver operating characteristics; AUC, area under the curve; T, tumor.
FIGURE 5
FIGURE 5
Heat map of the distribution of eight prognosis-related lncrna and clinicopathological variables in the high-risk and low-risk groups. lncRNAs, long-chain non-coding RNAs; M, metastasis; T, tumor.
FIGURE 6
FIGURE 6
Nomogram construction and validation. (A) Nomogram survival combined with clinicopathological factors and risk score predicts 1-year, 3-year, and 5-year survival in ccRCC patients. (B–D) Calibration curve tests the consistency between actual OS rate and 1-year, 3-year and 5-year predicted survival. OS, overall survival; ccRCC, renal clear cell carcinoma.
FIGURE 7
FIGURE 7
Kaplan-Meier survival curves for patients divided into high- and low-risk groups according to the ranking of different clinicopathological variables. (A–B) Age. (C–D) Gender. (E–F) Grade. (G–H) Stage. (I–J) T Stage. (K–L) M Stage. T, tumor; M, distant metastasis.
FIGURE 8
FIGURE 8
Internal validation of OS prediction signatures based on the TCGA dataset. (A) Kaplan-Meier survival curves for the training group. (B) Kaplan-Meier survival curves for the testing group. (C) ROC curves and AUCs for 1-, 3-, and 5-year survival rates for the training group. (D) ROC curves and AUCs for 1-, 3-, and 5-year survival rates for patients in the testing group. ROC, receiver operating characteristic; AUC, area under the curve; OS, overall survival; TCGA, Cancer Genome Atlas.
FIGURE 9
FIGURE 9
PCA profiles showed patient distribution based on (A) Whole genome; (B) CCCH-type zinc finger-related genes; (C) CCCH-type zinc finger-related lncRNAs; and (D) Risk Scores. In the high and low risk groups, red and green dots were more strongly separated.
FIGURE 10
FIGURE 10
Immune infiltration analysis. ssGSEA score results. A, B Results for ssGSEA scores [immune cells scores (A) and immune functions scores (B)] between high and low-risk groups in boxplots. (C) Expression of immune checkpoints among high and low-risk groups. ns not significant; *p < 0.05; **p < 0.01.
FIGURE 11
FIGURE 11
Comparison of treatment drug sensitivity between high- and low-risk groups. (A) PD-L1 expression in high and low-risk groups. (B–E) Predicted sensitivity of ABT737, WIKI4, Afuresertib, and GNE-317, which were candidate chemotherapeutic agents for high-risk patients. (F–I) Predicted sensitivity of Dihydrorotenone, Cediranib, BMS-345541 and AZ6102, which were candidate potent drug options for low-risk patients. PD-L1, programmed cell death ligand 1.
FIGURE 12
FIGURE 12
Evaluate the predictive value of CCCH-type zinc finger-associated lncRNA signaling for DFS. (A) Kaplan-Meier survival curves for the entire dataset. (B) Kaplan Meier survival curves for the first cohort of patients. (C) Kaplan-Meier survival curves for the second cohort. (D) ROC curves and AUCs for the 1-, 3-, and 5-year survival rates of the entire dataset. (E) ROC curves and AUCs for the 1-, 3-, and 5-year survival rates of the first cohort of patients. (F) ROC curves and AUCs for the 1-, 3-, and 5-year survival rates of the second cohort of patients. lncRNAs, long-chain non-coding RNAs; DFS, disease-free survival; ROC: receiver operating characteristic; AUC, area under the curve.
FIGURE 13
FIGURE 13
Correlation analysis between CTZFLs and clinical characteristics. (A–C) Correlation between AL162377.1 expression level and gender, grade and stage. (D–F) Relationship between LINC00460 expression level and gender, stage and grade. (G–H) Relationship between risk score and tumor grade and stage. (I–J) Relationship between DLGAP1-AS2 expression level and tumor grade and stage. CTZFLs, CCCH-type zinc finger protein-associated lncRNAs.

Similar articles

Cited by

References

    1. Ahmed A. A., Abedalthagafi M. (2016). Cancer diagnostics: The journey from histomorphology to molecular profiling. Oncotarget 7, 58696–58708. 10.18632/oncotarget.11061 - DOI - PMC - PubMed
    1. Al-Souhibani N., Al-Ahmadi W., Hesketh J. E., Blackshear P. J., Khabar K. S. A. (2010). The RNA-binding zinc-finger protein tristetraprolin regulates AU-rich mRNAs involved in breast cancer-related processes. Oncogene 29, 4205–4215. 10.1038/onc.2010.168 - DOI - PMC - PubMed
    1. Ashburner M., Ball C. A., Blake J. A., Botstein D., Butler H., Cherry J. M., et al. (2000). Gene ontology: Tool for the unification of biology. The gene ontology consortium. Nat. Genet. 25, 25–29. 10.1038/75556 - DOI - PMC - PubMed
    1. Barata P. C., Rini B. I. (2017). Treatment of renal cell carcinoma: Current status and future directions. Ca. Cancer J. Clin. 67, 507–524. 10.3322/caac.21411 - DOI - PubMed
    1. Bergers G., Hanahan D. (2008). Modes of resistance to anti-angiogenic therapy. Nat. Rev. Cancer 8, 592–603. 10.1038/nrc2442 - DOI - PMC - PubMed

Publication types