

A new GEE method to account for heteroscedasticity using asymmetric least-square regressions
- PMID: 36246864
- PMCID: PMC9559327
- DOI: 10.1080/02664763.2021.1957789
A new GEE method to account for heteroscedasticity using asymmetric least-square regressions
Abstract
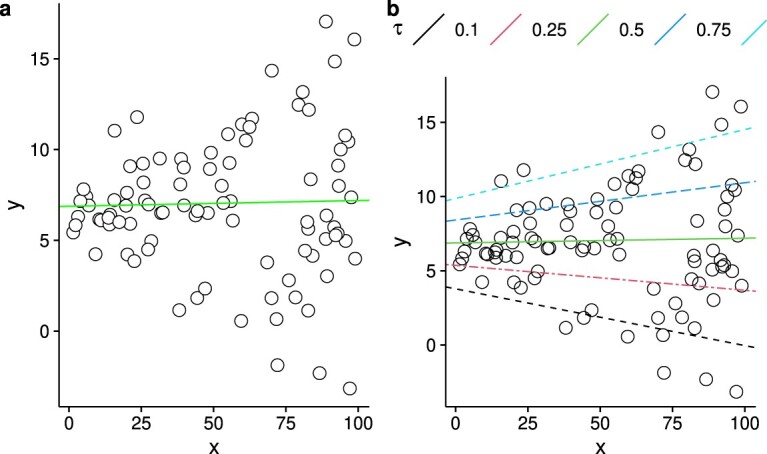
Generalized estimating equations are widely used to analyze longitudinal data; however, they are not appropriate for heteroscedastic data, because they only estimate regressor effects on the mean response - and therefore do not account for data heterogeneity. Here, we combine the with the asymmetric least squares (expectile) regression to derive a new class of estimators, which we call generalized expectile estimating equations . The model estimates regressor effects on the expectiles of the response distribution, which provides a detailed view of regressor effects on the entire response distribution. In addition to capturing data heteroscedasticity, the GEEE extends the various working correlation structures to account for within-subject dependence. We derive the asymptotic properties of the estimators and propose a robust estimator of its covariance matrix for inference (see our R package, github.com/AmBarry/expectgee). Our simulations show that the GEEE estimator is non-biased and efficient, and our real data analysis shows it captures heteroscedasticity.
Keywords: Expectile regression; GEE working correlation; cluster data; longitudinal data; quantile regression.
© 2021 Informa UK Limited, trading as Taylor & Francis Group.
Conflict of interest statement
No potential conflict of interest was reported by the author(s).
Figures


References
-
- Aigner D., Amemiya T., and Poirier D., On the estimation of production frontiers: Maximum likelihood estimation of the parameters of a discontinuous density function, Int. Econ. Rev. 17 (1976), pp. 377.
-
- Balan R.M. and Schiopu-Kratina I., Asymptotic results with generalized estimating equations for longitudinal data, Ann. Stat. 33 (2005), pp. 522–541.
-
- Barry A., Bhagwat N., Misic B., Poline J.-B., and Greenwood C.M.T., Asymmetric influence measure for high dimensional regression, Commun. Stat. – Theory Methods (2020), pp. 1–27.
-
- Burrus C.S., Barreto J.A., and Selesnick I.W., Iterative reweighted least-squares design of FIR filters, IEEE Trans. Signal Process. 42 (1994), pp. 2926–2936.
-
- Chatterjee S. and Hadi A.S., Influential observations, high leverage points, and outliers in linear regression, Stat. Sci. 1 (1986), pp. 379–393.
LinkOut - more resources
Full Text Sources
Other Literature Sources
Miscellaneous