

Prognosis-related genes participate in immunotherapy of renal clear cell carcinoma possibly by targeting dendritic cells
- PMID: 36247009
- PMCID: PMC9557226
- DOI: 10.3389/fcell.2022.892616
Prognosis-related genes participate in immunotherapy of renal clear cell carcinoma possibly by targeting dendritic cells
Abstract
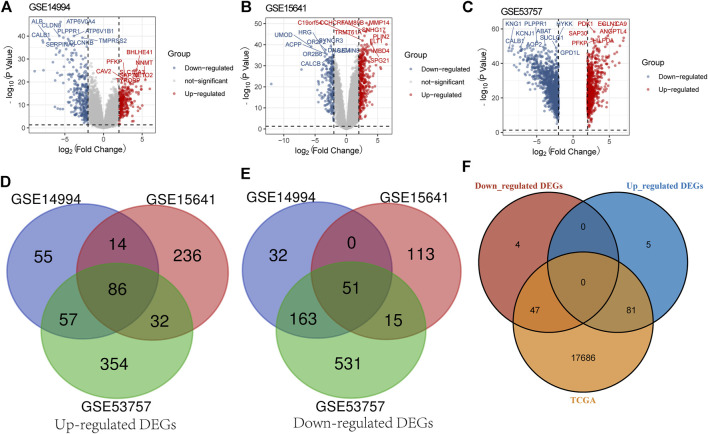
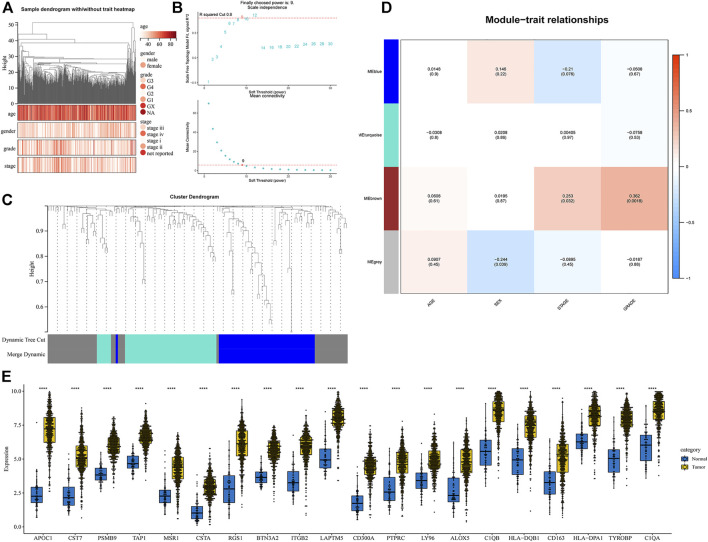
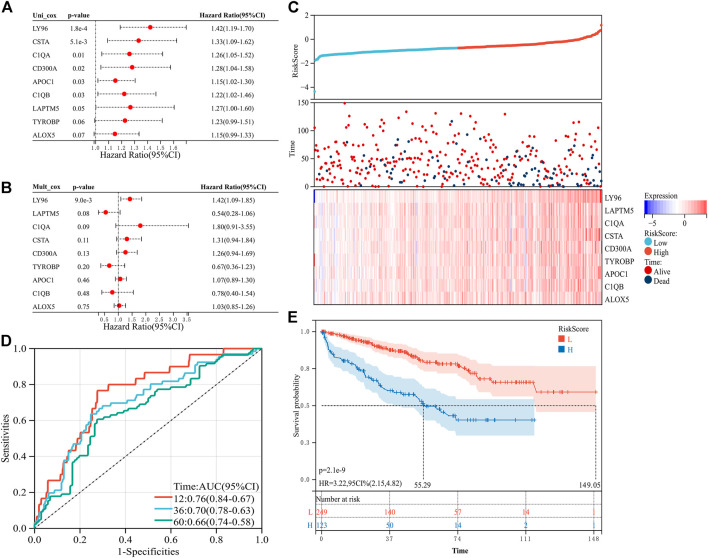
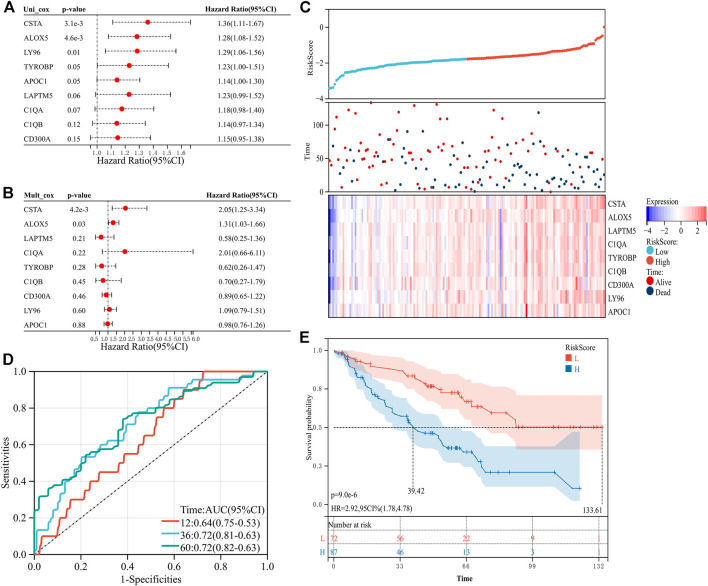
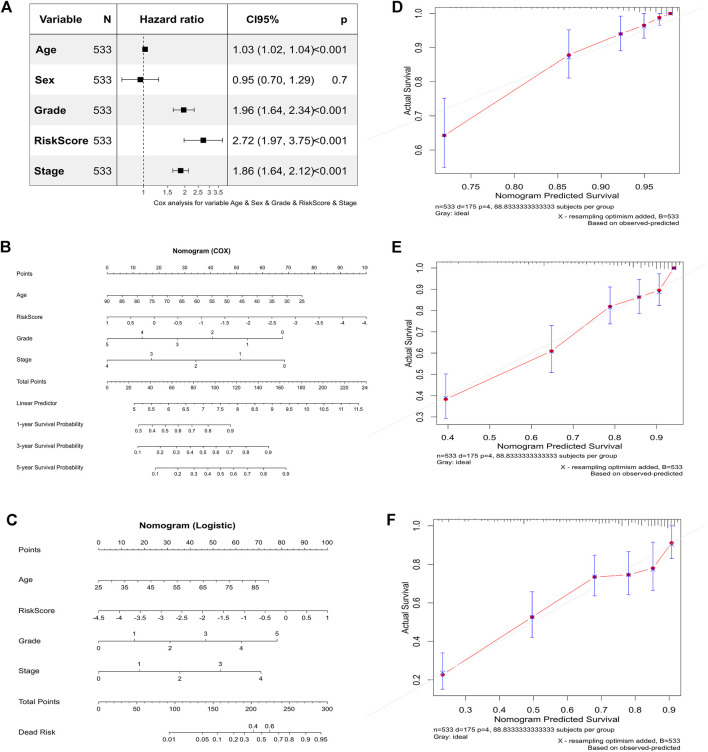
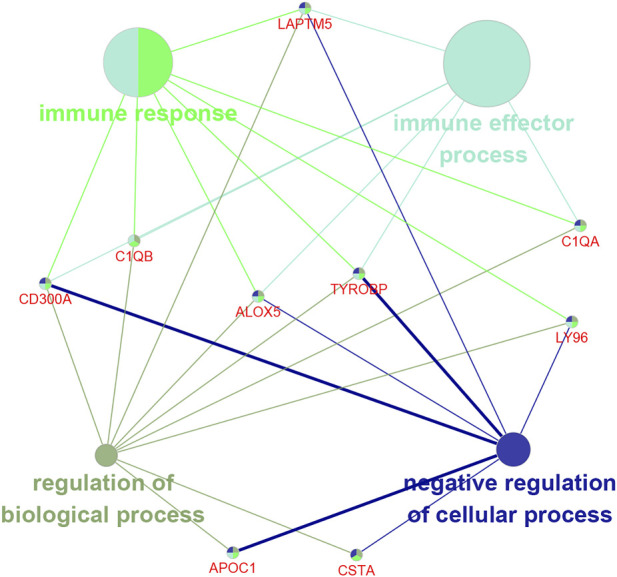
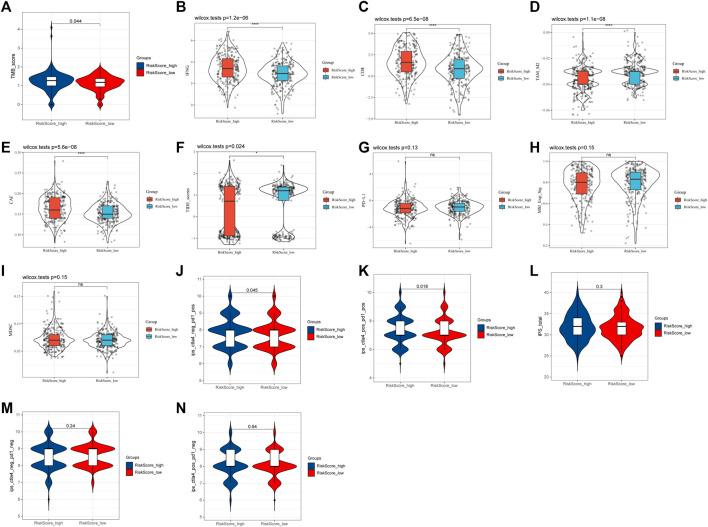
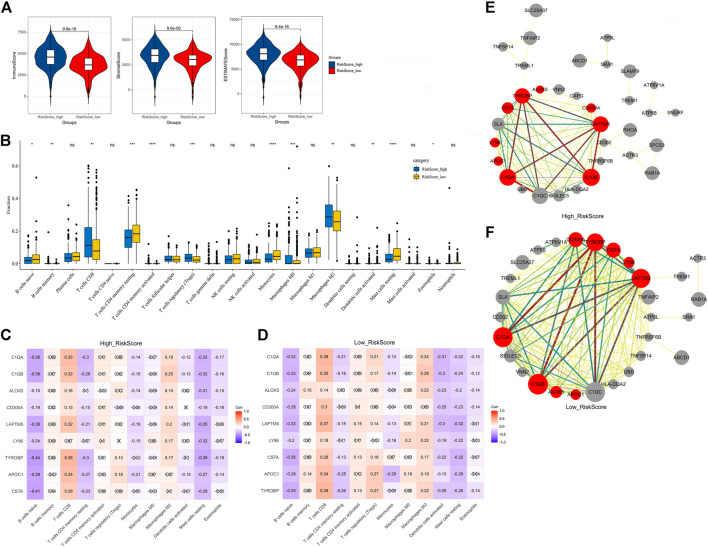
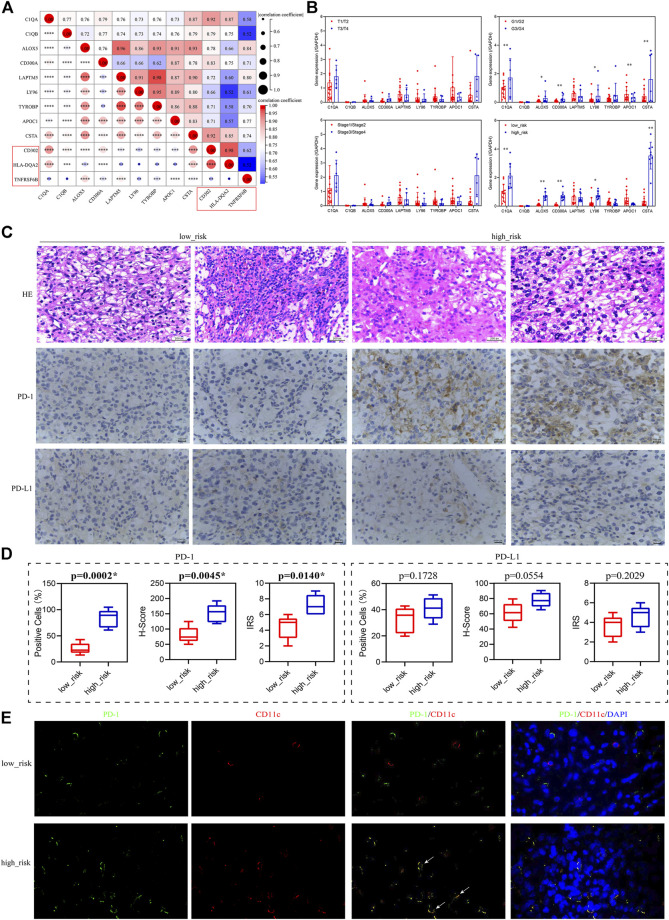
Tumor immunotherapy has become one of the most promising approaches to tumor treatment. This study aimed to screen genes involved in the response of clear cell renal cell carcinoma (ccRCC) to immunotherapy and analyze their function. Based on the Gene Expression Omnibus and The Cancer Genome Atlas datasets, we screened out nine differentially expressed genes (TYROBP, APOC1, CSTA, LY96, LAPTM5, CD300A, ALOX5, C1QA, and C1QB) associated with clinical traits and prognosis. A risk signature constructed by these nine genes could predict the survival probability for patients at 1 year, 3 years, and 5 years. The immune checkpoint blockade response rate in the high-risk group was significantly higher than in the low-risk group (49.25% vs. 24.72%, p ≤ 0.001). The nine prognosis-related genes were negatively correlated with activated dendritic cells in the low-risk group but not in the high-risk group. qRT-PCR, immunohistochemistry, and immunofluorescence showed that the nine prognosis-related genes were associated with dendritic cell activity and the PD-1 positive staining rate. In conclusion, the nine prognosis-related genes have a high prognostic value. The patients in the high-risk group were more likely to benefit from immunotherapy, and the mechanism might be related to the release of dendritic cell-mediated immunosuppression.
Keywords: clear cell renal cell carcinoma; dendritic cell; immunotherapy; prognosis; risk score.
Copyright © 2022 Fang and Wang.
Conflict of interest statement
The authors declare that the research was conducted in the absence of any commercial or financial relationships that could be construed as a potential conflict of interest.
Figures
Similar articles
-
Development and Validation of a Prognostic Gene Signature Correlated With M2 Macrophage Infiltration in Esophageal Squamous Cell Carcinoma.Front Oncol. 2021 Dec 3;11:769727. doi: 10.3389/fonc.2021.769727. eCollection 2021. Front Oncol. 2021. PMID: 34926275 Free PMC article.
-
Computational construction of TME-related lncRNAs signature for predicting prognosis and immunotherapy response in clear cell renal cell carcinoma.J Clin Lab Anal. 2022 Aug;36(8):e24582. doi: 10.1002/jcla.24582. Epub 2022 Jul 8. J Clin Lab Anal. 2022. PMID: 35808868 Free PMC article.
-
Immune-Associated Gene Signatures Serve as a Promising Biomarker of Immunotherapeutic Prognosis for Renal Clear Cell Carcinoma.Front Immunol. 2022 May 24;13:890150. doi: 10.3389/fimmu.2022.890150. eCollection 2022. Front Immunol. 2022. PMID: 35686121 Free PMC article.
-
Identification of a Methylation-Regulating Genes Prognostic Signature to Predict the Prognosis and Aid Immunotherapy of Clear Cell Renal Cell Carcinoma.Front Cell Dev Biol. 2022 Mar 2;10:832803. doi: 10.3389/fcell.2022.832803. eCollection 2022. Front Cell Dev Biol. 2022. PMID: 35309925 Free PMC article.
-
A new CCCH-type zinc finger-related lncRNA signature predicts the prognosis of clear cell renal cell carcinoma patients.Front Genet. 2022 Sep 30;13:1034567. doi: 10.3389/fgene.2022.1034567. eCollection 2022. Front Genet. 2022. PMID: 36246657 Free PMC article.
Cited by
-
Single-Cell RNA-Seq Analysis Reveals Ferroptosis in the Tumor Microenvironment of Clear Cell Renal Cell Carcinoma.Int J Mol Sci. 2023 May 22;24(10):9092. doi: 10.3390/ijms24109092. Int J Mol Sci. 2023. PMID: 37240436 Free PMC article.
-
Prognostic Role of SETDB2 in Clear Cell Renal Cell Carcinoma: Linking Immune Infiltration, Cuproptosis, and Tumor Suppression.Cancer Manag Res. 2025 Mar 27;17:675-692. doi: 10.2147/CMAR.S499771. eCollection 2025. Cancer Manag Res. 2025. PMID: 40166493 Free PMC article.
-
Comprehensive analyses for the coagulation and macrophage-related genes to reveal their joint roles in the prognosis and immunotherapy of lung adenocarcinoma patients.Front Immunol. 2023 Oct 31;14:1273422. doi: 10.3389/fimmu.2023.1273422. eCollection 2023. Front Immunol. 2023. PMID: 38022584 Free PMC article.
-
PD1/PD-L1 blockade in clear cell renal cell carcinoma: mechanistic insights, clinical efficacy, and future perspectives.Mol Cancer. 2024 Jul 16;23(1):146. doi: 10.1186/s12943-024-02059-y. Mol Cancer. 2024. PMID: 39014460 Free PMC article. Review.
-
ZKSCAN5 activates LAPTM5 expression by recruiting SETD7 to promote metastasis in pancreatic ductal adenocarcinoma.Histol Histopathol. 2024 Jun;39(6):747-760. doi: 10.14670/HH-18-678. Epub 2023 Nov 22. Histol Histopathol. 2024. PMID: 38018874
References
LinkOut - more resources
Full Text Sources
Research Materials
Miscellaneous