. 2022 Aug;127(8):e2022JA030334.
doi: 10.1029/2022JA030334. Epub 2022 Aug 22.

Jupiter's Low-Altitude Auroral Zones: Fields, Particles, Plasma Waves, and Density Depletions

Affiliations

Jupiter's Low-Altitude Auroral Zones: Fields, Particles, Plasma Waves, and Density Depletions

A H Sulaiman et al. J Geophys Res Space Phys. 2022 Aug.

Abstract

The Juno spacecraft's polar orbits have enabled direct sampling of Jupiter's low-altitude auroral field lines. While various data sets have identified unique features over Jupiter's main aurora, they are yet to be analyzed altogether to determine how they can be reconciled and fit into the bigger picture of Jupiter's auroral generation mechanisms. Jupiter's main aurora has been classified into distinct "zones", based on repeatable signatures found in energetic electron and proton spectra. We combine fields, particles, and plasma wave data sets to analyze Zone-I and Zone-II, which are suggested to carry upward and downward field-aligned currents, respectively. We find Zone-I to have well-defined boundaries across all data sets. H+ and/or H3 + cyclotron waves are commonly observed in Zone-I in the presence of energetic upward H+ beams and downward energetic electron beams. Zone-II, on the other hand, does not have a clear poleward boundary with the polar cap, and its signatures are more sporadic. Large-amplitude solitary waves, which are reminiscent of those ubiquitous in Earth's downward current region, are a key feature of Zone-II. Alfvénic fluctuations are most prominent in the diffuse aurora and are repeatedly found to diminish in Zone-I and Zone-II, likely due to dissipation, at higher altitudes, to energize auroral electrons. Finally, we identify significant electron density depletions, by up to 2 orders of magnitude, in Zone-I, and discuss their important implications for the development of parallel potentials, Alfvénic dissipation, and radio wave generation.

Keywords: Juno; Jupiter; aurora.


Figures

Figure 1
Figure 1
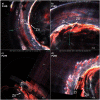
Orthographic projections of ultraviolet images of Jupiter's aurora in false color for each event presented in Figures 2, 3, 4, 5. Overlaid are magnetic footprint tracks of Juno separated by 1 min. Colorbar can be found in Figure S1 of Supporting Information S1.
Figure 2
Figure 2
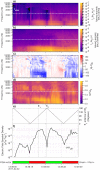
Plasma waves, magnetic field, and charged particles when Juno was magnetically connected to Jupiter's southern auroral zone near its fourth perijove (PJ4S). (a, b) Electric and magnetic field frequency‐time spectrogram, respectively, measured by Waves. Overlaid onto each are the H+ and H3 + cyclotron frequencies, f cH+ fcH3+ , as white dashed lines. The electron plasma frequency, f pe , is digitized as the lower frequency cutoff of the Ordinary mode and shown as a white dotted line. The y‐axis on the right converts f pe in Hz to electron number density, n e , in cm−3. (c) Transverse magnetic field fluctuations measured by the magnetometer. Overlaid is the perturbation in the azimuthal magnetic field, δB φ , as a white solid line. (d) Electron energy fluxes measured by Jovian Auroral Distributions Experiment (JADE) (light colors) and Jupiter Energetic‐particle Detector Instrument (JEDI) (dark colors) over the energy ranges 3–30 keV and 50–1,000 keV, respectively. Black/gray and red/pink correspond to upward and downward populations, respectively. (e) Proton energy fluxes measured by JADE (light colors) and JEDI (dark colors) over the energy ranges 0.5–50 keV and 50–2,600 keV, respectively. Black/gray and red/pink correspond to upward and downward populations, respectively.
Figure 3
Figure 3
Same as Figure 2 but for Jupiter's southern auroral zone near its sixth perijove (PJ6S) and annotated.
Figure 4
Figure 4
Same as Figure 2 but for Jupiter's northern auroral zone near its seventh perijove (PJ7N).
Figure 5
Figure 5
Same as Figure 2 but for Jupiter's southern auroral zone near its ninth perijove (PJ9S).
Figure 6
Figure 6
Poynting vector analysis during PJ4S. (a, b) Electric and magnetic field frequency time spectrograms, respectively. (c, d) Phase difference and coherence between measured electric and magnetic fields, respectively. (e, f) Angle between electric field antenna and background magnetic field correlated against the electric field spectral density at ¼ f cH+ .
Figure 7
Figure 7
(a) Electron number density plotted against M‐shell and color‐coded with Juno's altitude above Jupiter's one‐bar level. The circled data points are when Juno was magnetically connected to Zone‐I. (b) f pe /f ce plotted against M‐shell, same format as (a). The M‐shell was calculated using the JRM09 internal field model (Connerney et al., 2018) + an external current sheet model (Connerney et al., 1981). This is likely overestimating the true M‐shell.
Figure 8
Figure 8
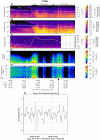
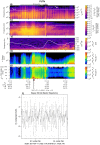
Plasma waves, fields, and charged particles when Juno was magnetically connected to Jupiter's southern auroral zone near its sixth perijove (PJ6S). (a) Electric and (b) magnetic field frequency‐time spectrogram measured by Waves. Overlaid onto each is the proton cyclotron frequency, f cH+ , as white dashed lines. The electron plasma frequency, f pe , is digitized as the lower frequency cutoff of the Ordinary mode and shown as a white dotted line. The y‐axis on the right converts f pe in Hz to electron number density, n e , in cm−3. (c) Transverse magnetic field fluctuations measured by magnetometer. Overlaid is the perturbation in the azimuthal magnetic field, δB φ , as a white solid line. (d) 50–1,000 keV electron energy‐time and (e) pitch‐angle‐time spectrograms measured by Jupiter Energetic‐particle Detector Instrument. The depletion near 90° is likely due to spacecraft shadowing and therefore not real. (f) Electric field waveforms corresponding to the time indicated by black arrows in stack plots.
Figure 9
Figure 9
Same as Figure 8 but for Jupiter's northern auroral zone near Juno's seventh perijove (PJ7N).
Figure 10
Figure 10
(a) Electric and (b) magnetic field frequency‐time spectrograms when Juno was magnetically connected to Jupiter's southern auroral zone near its 12th perijove (PJ12S) showing the characteristic funnel‐shaped whistler‐mode auroral hiss above f cH+ .
Figure 11
Figure 11
Graphic illustrating the average picture of the fields, particles, and plasma waves in Jupiter's low‐altitude diffuse aurora, Zone‐I, and Zone‐II.

References

    1. Allegrini, F. , Bagenal, F. , Bolton, S. , Connerney, J. , Clark, G. , Ebert, R. W. , et al. (2017). Electron beams and loss cones in the auroral regions of Jupiter. Geophysical Research Letters, 44(14), 7131–7139. 10.1002/2017GL073180 - DOI
    1. Allegrini, F. , Mauk, B. , Clark, G. , Gladstone, G. R. , Hue, V. , Kurth, W. S. , et al. (2020). Energy flux and characteristic energy of electrons over Jupiter's main auroral emission. Journal of Geophysical Research: Space Physics, 125(4). 10.1029/2019JA027693 - DOI
    1. Allegrini, F. , Kurth, W. S. , Elliott, S. S. , Saur, J. , Livadiotis, G. , Nicolaou, G. , et al. (2021). Electron partial density and temperature over Jupiter’s main auroral emission using Juno observations. Journal of Geophysical Research: Space Physics, 126(9), e2021JA029426. 10.1029/2021JA029426 - DOI
    1. André, M. , Norqvist, P. , Andersson, L. , Eliasson, L. , Eriksson, A. I. , Blomberg, L. , et al. (1998). Ion energization mechanisms at 1700 km in the auroral region. Journal of Geophysical Research, 103, A3. 10.1029/97JA00855 - DOI
    1. Bader, A. , Badman, S. V. , Ray, L. C. , Paranicas, C. P. , Lorch, C. T. S. , Clark, G. , et al. (2020). Energetic particle signatures above Saturn’s aurorae. Journal of Geophysical Research: Space Physics, 125(1), e2019JA027403. 10.1029/2019JA027403 - DOI

LinkOut - more resources