Review
. 2022 Aug;67(8):1647-1669.
doi: 10.1002/lno.12101. Epub 2022 Jun 30.

Machine learning techniques to characterize functional traits of plankton from image data

Affiliations
Review

Machine learning techniques to characterize functional traits of plankton from image data

Eric C Orenstein et al. Limnol Oceanogr. 2022 Aug.

Abstract

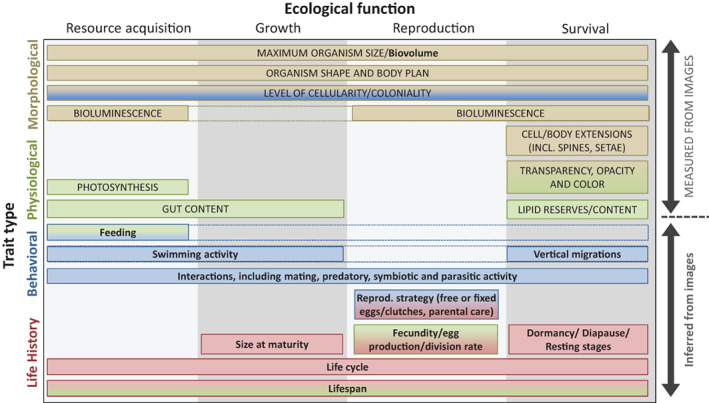
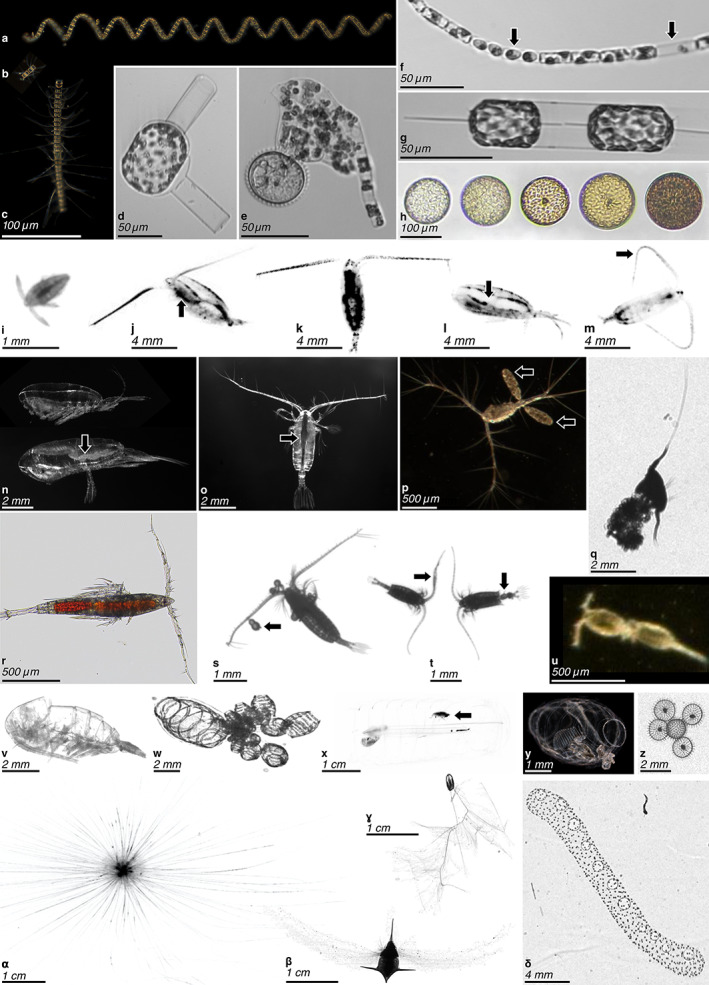
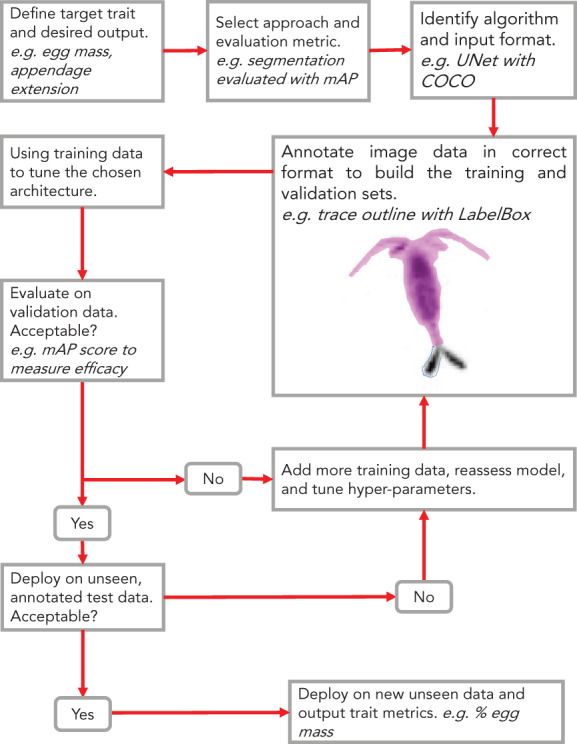
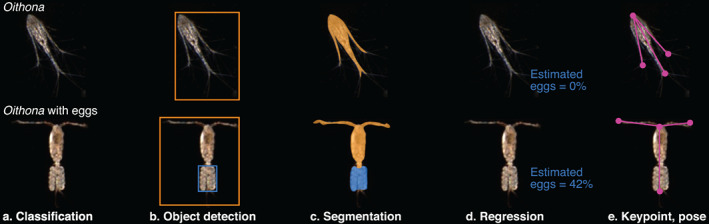
Plankton imaging systems supported by automated classification and analysis have improved ecologists' ability to observe aquatic ecosystems. Today, we are on the cusp of reliably tracking plankton populations with a suite of lab-based and in situ tools, collecting imaging data at unprecedentedly fine spatial and temporal scales. But these data have potential well beyond examining the abundances of different taxa; the individual images themselves contain a wealth of information on functional traits. Here, we outline traits that could be measured from image data, suggest machine learning and computer vision approaches to extract functional trait information from the images, and discuss promising avenues for novel studies. The approaches we discuss are data agnostic and are broadly applicable to imagery of other aquatic or terrestrial organisms.


Conflict of interest statement

None declared.

Figures

Fig. 1
Fig. 1
Plankton functional traits that can be estimated from images, following the unified typology of Martini et al. (2021). Trait types along the y‐axis follow the order of the “Plankton traits from images” section. Measured traits, ones that can be quantified solely from images, are in capital letters. Inferred traits, which require additional information beyond raw pixels, are written in bold text.
Fig. 2
Fig. 2
Example of plankton images on which traits can be identified. (ah) Diatoms, (iv) copepods, (wδ) other taxa. (ac) Chains of Chaetoceros spp. of different sizes (Scripps Pier Cam [SPC]); note the long spines on (c). (d) Sexual stage of Guinardia flaccida (Imaging FlowCytobot [IFCB]). (e) Dinoflagellate consuming a diatom chain (Guinardia delicatula) by external digestion in a feeding veil (pallium) (IFCB). (f) Guinardia delicatula infected with parasite (first arrow) or as an empty frustule (second arrow) [IFCB]. (g) Ditylum brightwellii cell dividing (IFCB). (h) Coscinodiscophycidae (centric diatoms) containing various amounts of pigments (Planktoscope). (i) Nauplius stage of a crustacean (ZooScan), (jm) calanoid copepods (Underwater Vision Profiler 5), note the full gut (arrow) and active posture with antennae deployed on (j), the pigmented (dark) body parts on (jl), the lipid sac (arrow) and resting posture, with antennae along the body on (l), and the curved antennae (arrow) associated with a jump of the copepod on (m). (n) Immature (top) and mature (bottom, with visible oocytes—arrow) female of Calanus hyperboreus (Lightframe On‐sight Key species Investigation [LOKI]). (o) Gaetanus brevispinus displaying many sensory setae on its antennae and a well visible gut (arrow) (LOKI). (p) Another copepod with well visible setae and two egg sacs (arrows) (SPC). (q) Copepod associated with (possibly feeding on) a marine snow particle (ZooGlider). (r) Microsetella sp. displaying many spines and intense coloration, likely from its gut content (Planktoscope). (s) Calanoid copepod with parasite dinoflagellates (arrow) (ZooCAM). (t) Male (with geniculate antennae—arrow, left) and female (with bulging genital segment—arrow, right) of Centropages sp. (ZooCAM). (u) Oncaea mating [SPC]. (v) Empty copepod carcass or molt (ZooScan). (w) Doliolid budding (ISIIS). (x) Salp with an amphipod inside (arrow) (UVP). (y) Transparent Doliolid (SPC). (z) A few solitary Rhizaria, family Aulospheridae (ZooGlider), to be contrasted with (δ). (α) Foraminifera with long cell extensions (UVP). (β) Pteropod (dark) with part of its mucus net deployed (gray). (ɣ) Ctenophore, family Mertensiidae, with very long fishing tentacles deployed (ISIIS). (δ) A colonial Rhizaria, order Collodaria (ZooGlider).
Fig. 3
Fig. 3
Workflow diagram for a computer vision approach targeting a specific functional trait extracted from plankton image data. In this example, a group decides to target egg‐bearing copepods with a UNet segmentation model. A human annotator selects ovigerous tissue from a copepod image and outputs the mask in the COCO data format. The model is then trained and evaluated using the mAP (Table 2; Supporting Information S1). Note that this workflow is not specific to plankton and could also be used for other types of organisms.
Fig. 4
Fig. 4
Examples of several techniques for trait extraction from zooplankton images. The hypothetical use case is examining ovigerous copepods imaged by the Scripps Plankton Camera system. The top panel is a non‐egg bearing copepod. The bottom panel is an individual carrying an egg‐sac. (a) Automated classifiers could be trained to add a semantic descriptor to the taxonomic class. (b) Object detection finds the organism and desired trait. (c) Segmentation algorithms classify the pixels as belonging to the organism or the trait. (d) Regression estimates the percentage of pixels that represent the trait. (e) Keypoint/pose estimation finds body nodes (red dots) and connects them (yellow lines) to estimate orientation or appendage extension.
Fig. 5
Fig. 5
Examples of several techniques for trait extraction from phytoplankton. The hypothetical use case is examining parasitized diatom chains imaged by the Imaging FlowCytobot. The top panel is a healthy Guinardia delicatula. The bottom panel is a parasitized chain. (a) Automated classifiers could be trained to add a semantic descriptor to the taxonomic class. (b) Object detection finds the entire chain, chloroplasts, and parasites. (c) Segmentation algorithms classify individual pixels as belonging to the organism, chloroplasts, or parasites. (d) Regression estimates the amount of an image that corresponds to the organelle/parasite biovolume.

References

    1. Acuña, J. L. , López‐Urrutia Á., and Colin S.. 2011. Faking giants: the evolution of high prey clearance rates in jellyfishes. Science 333: 1627–1629. - PubMed
    1. Aksnes, D. L. , and Giske J.. 1990. Habitat profitability in pelagic environments. Mar. Ecol. Prog. Ser. 64: 209–215.
    1. Alldredge, A. L. 1981. The impact of appendicularian grazing on natural food concentrations in situ 1. Limnol. Oceanogr. 26: 247–257.
    1. Alldredge, A. L. , and Silver M. W.. 1988. Characteristics, dynamics and significance of marine snow. Prog. Oceanogr. 20: 41–82.
    1. Allken, V. , Handegard N. O., Rosen S., Schreyeck T., Mahiout T., and Malde K.. 2019. Fish species identification using a convolutional neural network trained on synthetic data. ICES J. Mar. Sci. 76: 342–349.