. 2022 Sep 30:9:979745.
doi: 10.3389/fcvm.2022.979745. eCollection 2022.

Sox13 is a novel flow-sensitive transcription factor that prevents inflammation by repressing chemokine expression in endothelial cells

Affiliations

Sox13 is a novel flow-sensitive transcription factor that prevents inflammation by repressing chemokine expression in endothelial cells

Catherine Demos et al. Front Cardiovasc Med. .

Abstract

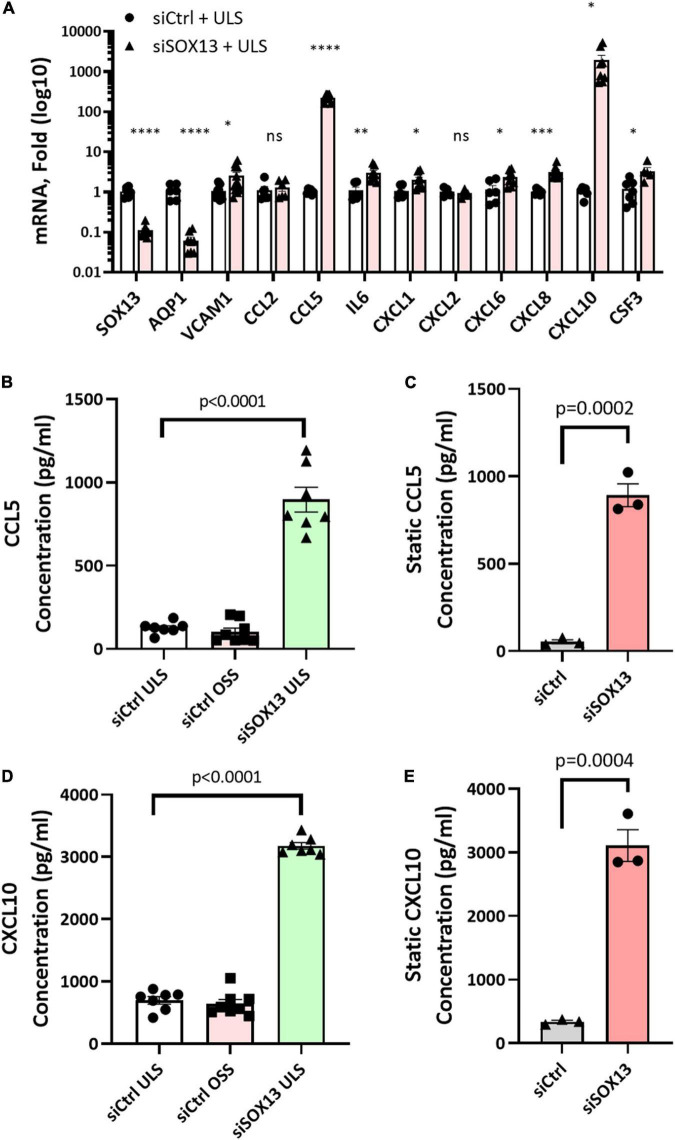
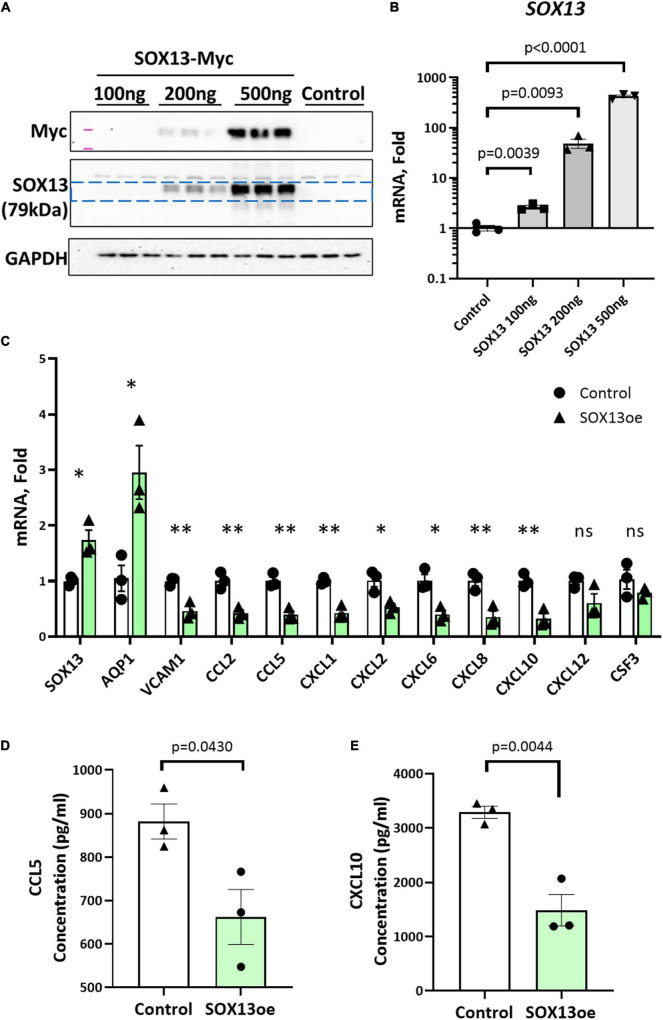
Atherosclerosis is a chronic inflammatory disease and occurs preferentially in arterial regions exposed to disturbed blood flow (d-flow) while the stable flow (s-flow) regions are spared. D-flow induces endothelial inflammation and atherosclerosis by regulating endothelial gene expression partly through the flow-sensitive transcription factors (FSTFs). Most FSTFs, including the well-known Kruppel-like factors KLF2 and KLF4, have been identified from in vitro studies using cultured endothelial cells (ECs). Since many flow-sensitive genes and pathways are lost or dysregulated in ECs during culture, we hypothesized that many important FSTFs in ECs in vivo have not been identified. We tested the hypothesis by analyzing our recent gene array and single-cell RNA sequencing (scRNAseq) and chromatin accessibility sequencing (scATACseq) datasets generated using the mouse partial carotid ligation model. From the analyses, we identified 30 FSTFs, including the expected KLF2/4 and novel FSTFs. They were further validated in mouse arteries in vivo and cultured human aortic ECs (HAECs). These results revealed 8 FSTFs, SOX4, SOX13, SIX2, ZBTB46, CEBPβ, NFIL3, KLF2, and KLF4, that are conserved in mice and humans in vivo and in vitro. We selected SOX13 for further studies because of its robust flow-sensitive regulation, preferential expression in ECs, and unknown flow-dependent function. We found that siRNA-mediated knockdown of SOX13 increased endothelial inflammatory responses even under the unidirectional laminar shear stress (ULS, mimicking s-flow) condition. To understand the underlying mechanisms, we conducted an RNAseq study in HAECs treated with SOX13 siRNA under shear conditions (ULS vs. oscillatory shear mimicking d-flow). We found 94 downregulated and 40 upregulated genes that changed in a shear- and SOX13-dependent manner. Several cytokines, including CXCL10 and CCL5, were the most strongly upregulated genes in HAECs treated with SOX13 siRNA. The robust induction of CXCL10 and CCL5 was further validated by qPCR and ELISA in HAECs. Moreover, the treatment of HAECs with Met-CCL5, a specific CCL5 receptor antagonist, prevented the endothelial inflammation responses induced by siSOX13. In addition, SOX13 overexpression prevented the endothelial inflammation responses. In summary, SOX13 is a novel conserved FSTF, which represses the expression of pro-inflammatory chemokines in ECs under s-flow. Reduction of endothelial SOX13 triggers chemokine expression and inflammatory responses, a major proatherogenic pathway.

Keywords: CCL5; CXCL10; Sox13; endothelium; inflammation; shear-sensitive TF.


Conflict of interest statement

The authors declare that the research was conducted in the absence of any commercial or financial relationships that could be construed as a potential conflict of interest.

Figures

FIGURE 1
FIGURE 1
Identification of flow-sensitive transcription factors (FSTFs) in mouse artery ECs in vivo and validation in vivo and in vitro. Volcano plots show differentially expressed TFs in endothelial-enriched RNAs in the LCAs (left carotid artery exposed to d-flow) and RCAs (right carotid artery exposed to s-flow) obtained at (A) 12 h, (B) 24 h, (C) 48 h, and (D) 2 weeks after the PCL in mice. Red dots indicate TFs changed ≥50% with a p-value ≤ 0.05. (E,F) Venn diagrams show TFs commonly upregulated or downregulated by d-flow at 3 or 4 different time points. (G) qPCR validation of 29 potential FSTFs at 48 h post-PCL. Mean fold change ±SEM, n = 12 for qPCR, (*) indicates p ≤ 0.05 for qPCR results calculated by student’s t-test. (H) The in vivo gene array and qPCR data at 48 h post-PCL results are compared to the in vitro qPCR results in HAECs exposed to oscillatory shear (OSS mimicking d-flow) and unidirectional laminar shear (ULS, mimicking s-flow). Mean fold change ±SEM, n = 5 for HAECs, (*) indicates p < 0.05 for 24 h HAEC qPCR calculated by student’s t-test.
FIGURE 2
FIGURE 2
Validation of SOX13 flow sensitivity in ECs. (A) Violin plot shows SOX13 expression profile in our published scRNAseq data obtained from the mouse LCAs and RCAs at the 2-day (acute) or 2 weeks (chronic) post-PCL (partial carotid ligation) surgery. E2 represents a healthy EC cluster exposed to s-flow in RCA. E5 and E8 are EC clusters exposed to acute and chronic d-flow, respectively. (B) Chromatin accessibility plot of Sox13 gene was obtained by re-analyzing the published scATACseq data using the same mouse PCL model. E2 (s-flow), E5 (acute d-flow), and E8 (chronic d-flow) show a time-dependent closure of SOX13 accessibility by d-flow in ECs. (C–E) HAECs exposed to ULS or OSS for 24 h were lysed, fractionated into the cytoplasmic (cyto) and nuclear (nuc) fractionations, and western blot analyzed using antibodies to SOX13, laminA/C, and α-tubulin (C) and quantified (D). Mean±SEM, n = 5, p-values calculated by student’s t-test. (E) Shows SOX13 qPCR from a similar HAEC shear study, Mean±SEM, n = 8, p-values calculated by student’s t-test. (F) Shows immunofluorescence staining of Sox13 of mouse GC (greater curvature exposed to stable flow) and LC (lesser curvature exposed to disturbed flow) naturally in the aortic arch. The bottom panels show orthogonal views, showing SOX13 expression above the internal elastic lamina (IEL). DAPI shows nuclei. (G) Shows the quantitation of SOX13 expression. Mean±SEM, n = 3 mice, p ≤ 0.05 by student’s t-test.
FIGURE 3
FIGURE 3
siSOX13 knockdown of SOX13 in HAECs. (A–C) Static HAEC study. HAECs were treated with siSOX13 vs. siCtrl for 48 h, and analyzed by qPCR (A) and western blot using cytoplasmic and nuclear fractions with SOX13 antibody (B) and quantified (C). (D–L) Shear study. HAECs treated with siSOX13 vs. siCtrl for 48 h were exposed to ULS or OSS for another 24 h, and analyzed for SOX13 by qPCR (D), western blot of whole cell lysate (E,F). Additional qPCR assays for VCAM1, KLF4, and KLF2 (G–I) and western blots for VCAM1 and KLF4 (J,L) were conducted. Mean±SEM, n = 4–6 (F,I) or 3 (K,L) are shown, and p-values calculated by student’s t-test.
FIGURE 4
FIGURE 4
Shear-dependent and SOX13-dependent gene expression in HAECs by RNAseq analysis. HAECs treated with siSOX13 or siCtrl for 24 h were exposed to OSS or ULS for another 24 h, and total RNAs were analyzed by RNAseq. (A–D) Shows differential gene expression by comparing the four groups: (1) siCtrl OSS, (2) siSOX13 OSS, (3) siCtrl LSS, and (4) siSOX13 LSS. The number of significantly downregulated (left) or upregulated (right) genes by ≥50% with a p-value ≤ 0.05 (shown as red dots) are indicated in each volcano plot. (E,F) Venn diagrams show commonly downregulated genes by OSS or siSOX13 (E) and upregulated genes by OSS or siSOX13 in ULS condition (F). (G,H) Heat map of the 94 commonly downregulated genes by OSS or siSOX13 in ULS condition (G) and the 40 commonly upregulated by OSS or by siSOX13. (I) Heatmap of top 20 genes upregulated by siSOX13 regardless of shear conditions.
FIGURE 5
FIGURE 5
Gene ontology analysis of shear-dependent and SOX13-dependent genes. Biological processes enriched by the 94 commonly downregulated genes by OSS or siSOX13 in ULS condition (A), the 40 commonly upregulated by OSS or by siSOX13 (B), and the top 20 genes upregulated by siSOX13 regardless of shear conditions (C) are shown. All biological processes listed were significant by p-value.
FIGURE 6
FIGURE 6
Validation of SOX13 targets by qPCR and ELISA. HAECs treated with siSOX13 or siCtrl for 24 h were exposed to OSS or ULS for another 24 h, and total RNAs were analyzed by RNAseq to validate the top SOX13-dependent targets (A) n = 4–7, Mean±SEM are shown. *p ≤ 0.05, **p ≤ 0.01 ***p ≤ 0.001, and ****p ≤ 0.0001 as determined by student’s t-test. The conditioned media from HAECs treated with siSOX13 and shear (B,D) or static (C,E) conditions were analyzed by ELISA quantification of CCL5 (B,C) or CCL10 (D,E). Mean±SEM are shown, p-values determined by student’s t-test.
FIGURE 7
FIGURE 7
SOX13 plasmid overexpression reduces inflammatory markers and chemokine expression. (A) Western blot of whole cell lysate and (B) qPCR of SOX13 plasmid concentration curve in static HAECs after 48h compared to GFP control plasmid. (C) qPCR analysis of SOX13 targets following 48 h static SOX13 or GFP control overexpression in HAECs at a concentration of 200 ng, using SOX13 and AQP1 as positive controls. n = 3, Mean±SEM are shown. *p ≤ 0.05, **p ≤ 0.01 as determined by student’s t-test. (D) ELISA quantification of CCL5 and (E) CXCL10 in the conditioned media from static HAECs, 48 h following SOX13 or control plasmid transfection. Mean±SEM are shown, n = 3, p-values determined by student’s t-test.
FIGURE 8
FIGURE 8
Monocyte adhesion induced by siSOX13 is prevented by treating HAECs with MetCCL5. (A) HAECs overexpressing SOX13 or RFP control were exposed to OSS or ULS for another 24 h. Following shear, THP1 monocytes were added to the conditioned media (CM), and adhered monocytes were counted. (B) HAECs treated with siSOX13 or siCtrl were exposed to OSS or ULS for another 24 h. Following shear, THP1 monocytes were added to the CM, and adhered monocytes were counted. (C,D) HAECs treated with siSOX13 or siCtrl were exposed to OSS or ULS in the presence or absence of MetCCL5 for another 24 h. Following shear, THP1 monocytes were added to the CM, and adhered monocytes were counted (C). In panel (D), following shear, CM was removed, HAECs were washed with fresh medium, THP1 monocytes were added to the CM, and adhered monocytes were counted. Mean±SEM are shown, n = 3 to 7, p-values determined by one-way ANOVA.

References

    1. Libby P. The changing landscape of atherosclerosis. Nature. (2021) 592:524–33. - PubMed
    1. Gimbrone MA, Jr., Garcia-Cardena G. Vascular endothelium, hemodynamics, and the pathobiology of atherosclerosis. Cardiovascular Pathol. (2013) 22:9–15. - PMC - PubMed
    1. Sun L, Rajamannan NM, Sucosky P. Defining the role of fluid shear stress in the expression of early signaling markers for calcific aortic valve disease. PLoS One. (2013) 8:e84433. 10.1371/journal.pone.0084433 - DOI - PMC - PubMed
    1. Malek AM, Alper SL, Izumo S. Hemodynamic shear stress and its role in atherosclerosis. JAMA. (1999) 282:2035–42. - PubMed
    1. Davies PF, Dewey CF, Jr., Bussolari SR, Gordon EJ, Gimbrone MA., Jr. Influence of hemodynamic forces on vascular endothelial function. In vitro studies of shear stress and pinocytosis in bovine aortic cells. J Clin Investig. (1984) 73:1121–9. 10.1172/JCI111298 - DOI - PMC - PubMed