. 2022 Sep 28:13:948742.
doi: 10.3389/fpls.2022.948742. eCollection 2022.

Integrated analyses of transcriptome and metabolome provides new insights into the primary and secondary metabolism in response to nitrogen deficiency and soil compaction stress in peanut roots

Affiliations

Integrated analyses of transcriptome and metabolome provides new insights into the primary and secondary metabolism in response to nitrogen deficiency and soil compaction stress in peanut roots

Liyu Yang et al. Front Plant Sci. .

Abstract

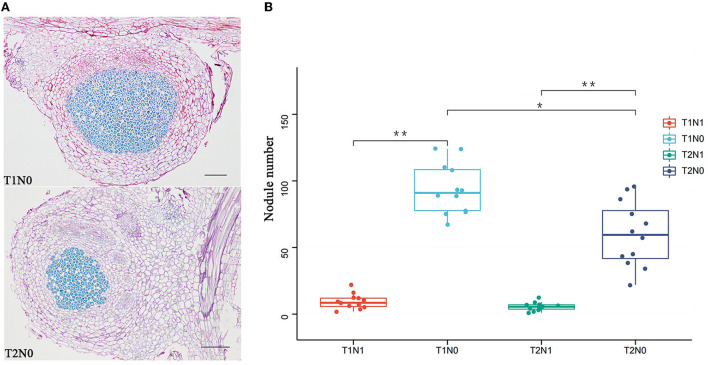
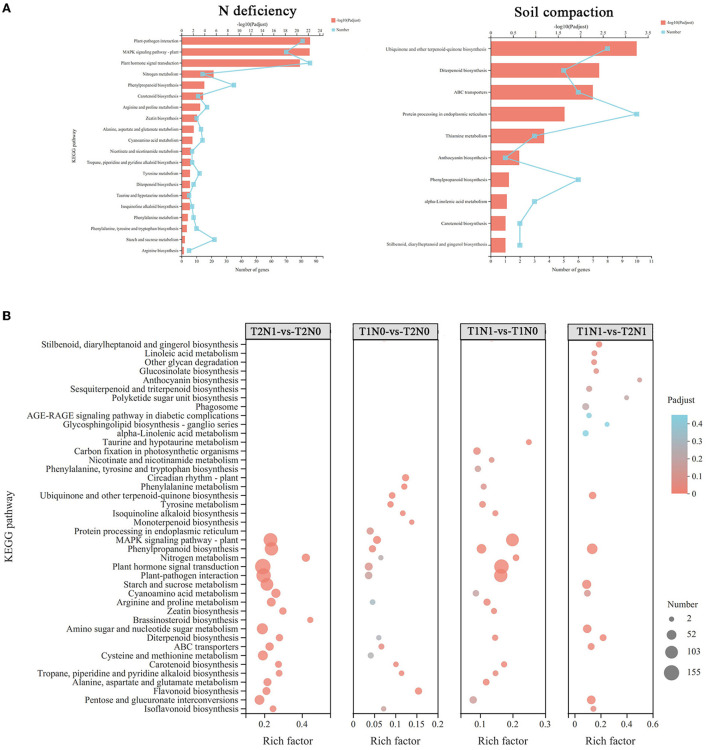
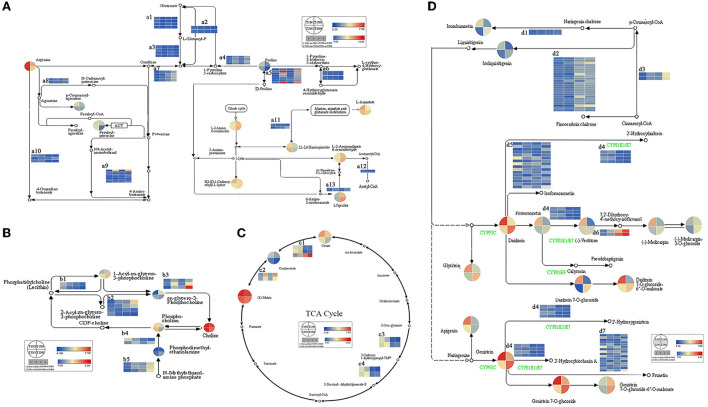
Peanut (Arachis hypogaea L.) is an important oil crop globally because of its high edible and economic value. However, its yield and quality are often restricted by certain soil factors, especially nitrogen (N) deficiency, and soil compaction. To explore the molecular mechanisms and metabolic basis behind the peanut response to N deficiency and soil compaction stresses, transcriptome and metabolome analyses of peanut root were carried out. The results showed that N deficiency and soil compaction stresses clearly impaired the growth and development of peanut's aboveground and underground parts, as well as its root nodulation. A total of 18645 differentially expressed genes (DEGs) and 875 known differentially accumulated metabolites (DAMs) were identified in peanut root under differing soil compaction and N conditions. The transcriptome analysis revealed that DEGs related to N deficiency were mainly enriched in "amino acid metabolism", "starch and sucrose metabolism", and "TCA cycle" pathways, while DEGs related to soil compaction were mainly enriched in "oxidoreductase activity", "lipids metabolism", and "isoflavonoid biosynthesis" pathways. The metabolome analysis also showed significant differences in the accumulation of metabolisms in these pathways under different stress conditions. Then the involvement of genes and metabolites in pathways of "amino acid metabolism", "TCA cycle", "lipids metabolism", and "isoflavonoid biosynthesis" under different soil compaction and N deficiency stresses were well discussed. This integrated transcriptome and metabolome analysis study enhances our mechanistic knowledge of how peanut plants respond to N deficiency and soil compaction stresses. Moreover, it provides new leads to further investigate candidate functional genes and metabolic pathways for use in improving the adaptability of peanut to abiotic stress and accelerating its breeding process of new stress-resistant varieties.

Keywords: metabolome; nitrogen deficiency; peanut root; soil compaction stress; transcriptome.


Conflict of interest statement

The authors declare that the research was conducted in the absence of any commercial or financial relationships that could be construed as a potential conflict of interest.

Figures

Figure 1
Figure 1
Phenotypic analysis of peanut plants grown in four different experimental conditions (treatment combinations: T1N0, T1N1, T2N0, T2N1). (A) Root morphology of peanut plants grew under four experimental conditions. (B) Length of peanut root. (C) Surface area of peanut roots. (D) Aboveground and underground biomass of peanut plants. (E) SPAD value of peanut plants grew under four experimental conditions. Error bars represent the SD (n = 3). Statistical significance was determined via an LSD test at *p < 0.05. T1N0 (Low soil compactness and nitrogen deficiency), T2N0 (High soil compactness and nitrogen deficiency), T1N1 (Low soil compactness and appropriate nitrogen) and T2N1 (High soil compactness and appropriate nitrogen).
Figure 2
Figure 2
Phenotypic analysis of nodules of peanut plants grown in four different experimental conditions. (A) Section morphology of nodules of peanut plant grown in uncompacted (T1N0) and compacted (T2N0) soil. The red part of the section is the cortical area of the nodule, and the blue part is the bacteroid area. (B) Number of nodules in peanut plants. Statistical significance was determined via Student's t-test; *p < 0.05, ** p < 0.01. T1N0 (Low soil compactness and nitrogen deficiency), T2N0 (High soil compactness and nitrogen deficiency), T1N1 (Low soil compactness and appropriate nitrogen) and T2N1 (High soil compactness and appropriate nitrogen).
Figure 3
Figure 3
Distributions of differentially expressed genes (DEGs) in all comparisons. (A) The number of up-regulated and down-regulated DEGs in each comparison. Red indicates up-regulated genes and blue indicates down-regulated genes. (B) Venn diagram for those DEGs in the comparisons related to N deficiency (T1N1-vs-T1N0 and T2N1-vs-T2N0) and soil compaction (T1N0-vs-T2N0 and T1N1-vs-T2N1). T1N0 (Low soil compactness and nitrogen deficiency), T2N0 (High soil compactness and nitrogen deficiency), T1N1 (Low soil compactness and appropriate nitrogen) and T2N1 (High soil compactness and appropriate nitrogen).
Figure 4
Figure 4
GO enrichment analysis of DEGs (differentially expressed genes) in different sets. The color key represents the corrected p-value of enriched GO terms. A high DEGs-enrichment degree is shown in red, and a low DEGs-enrichment degree is shown in blue. The size of the points is proportional to the number of DEGs. (A) GO enrichment analysis of those DEGs related to soil compaction stress and N deficiency stress. (B) GO enrichment analysis of DEGs related in the four comparisons (T1N0-vs-T2N0, T1N1-vs-T2N1, T1N1-vs-T1N0 and T2N1-vs-T2N0). T1N0 (Low soil compactness and nitrogen deficiency), T2N0 (High soil compactness and nitrogen deficiency), T1N1 (Low soil compactness and appropriate nitrogen) and T2N1 (High soil compactness and appropriate nitrogen).
Figure 5
Figure 5
KEGG enrichment analysis of DEGs in different sets. The color key represents the corrected p-value of enriched KEGG pathways. The high DEGs-enrichment degree is shown in red and low DEGs-enrichment degree is shown in blue. The size of the points is proportional to the number of DEGs. (A) KEGG enrichment analysis of those DEGs related to soil compaction stress and N deficiency stress. (B) KEGG enrichment analysis of DEGs in the four comparisons: T1N0-vs-T2N0, T1N1-vs-T2N1, T1N1-vs-T1N0, and T2N1-vs-T2N0. T1N0 (Low soil compactness and nitrogen deficiency), T2N0 (High soil compactness and nitrogen deficiency), T1N1 (Low soil compactness and appropriate nitrogen) and T2N1 (High soil compactness and appropriate nitrogen).
Figure 6
Figure 6
Heatmap of the transcription factor genes response to N deficiency and soil compaction stress in the four comparisons: T1N0-vs-T2N0, T1N1-vs-T2N1, T1N1-vs-T1N0, and T2N1-vs-T2N0. T1N0 (Low soil compactness and nitrogen deficiency), T2N0 (High soil compactness and nitrogen deficiency), T1N1 (Low soil compactness and appropriate nitrogen) and T2N1 (High soil compactness and appropriate nitrogen). The color key corresponds to the calculated log2 (fold-change of the TPM value). The N deficiency response-related TF genes that exhibited more than a 20-fold difference in the comparisons T1N1-vs-T1N0 and T2N1-vs-T2N0 are plotted.
Figure 7
Figure 7
Metabolic profiling results of the peanut root under four experimental conditions (treatment combinations: T1N0, T2N0, T1N1, T2N1). T1N0 (Low soil compactness and nitrogen deficiency), T2N0 (High soil compactness and nitrogen deficiency), T1N1 (Low soil compactness and appropriate nitrogen) and T2N1 (High soil compactness and appropriate nitrogen). (A) PCA plot. (B) Hierarchical clustering analysis for the metabolites based on their abundances.
Figure 8
Figure 8
Differentially accumulated metabolites (DAMs) in the four comparisons: (T1N0-vs-T2N0, T1N1-vs-T2N1, T1N1-vs-T1N0, and T2N1-vs-T2N0). (A) Number of DAMs in four different comparisons. (B) Venn diagram for DAMs in four different comparisons. T1N0 (Low soil compactness and nitrogen deficiency), T2N0 (High soil compactness and nitrogen deficiency), T1N1 (Low soil compactness and appropriate nitrogen) and T2N1 (High soil compactness and appropriate nitrogen).
Figure 9
Figure 9
KEGG classifications of DAMs in different sets.
Figure 10
Figure 10
The main metabolic pathways related to soil compaction and N deficiency stress. (A) Amino acid metabolism pathway. (B) Lipid metabolism. (C) TCA cycle. (D) Flavonoid and isoflavone metabolic pathway. The color corresponds to the relative abundance of DAMs and fold-change of DEGs in the four comparisons of these pathways. Lower case letters indicate the set of genes involved in this regulatory pathway, as detailed in Supplementary Table S4.

Similar articles

Cited by

References

    1. Abbott L. K., Murphy D. V. (2007). Soil Biological Fertility. A Key to Sustainable Land Use in Agriculture, Berlin: Springer. 10.1007/978-1-4020-6619-1 - DOI
    1. Arruda P., Barreto P. (2020). Lysine catabolism through the saccharopine pathway: enzymes and intermediates involved in plant responses to abiotic and biotic stress. Front. Plant Sci. 11:587. 10.3389/fpls.2020.00587 - DOI - PMC - PubMed
    1. Arvidsson J. (1999). Nutrient uptake and growth of barley as affected by soil compaction. Plant Soil. 208, 9–19. 10.1023/A:1004484518652 - DOI
    1. Arvidsson J., Etana A., Rydberg T. (2014). Crop yield in Swedish experiments with shallow tillage and no-tillage 1983–2012. Eur. J. Agron. 52, 307–315. 10.1016/j.eja.2013.08.002 - DOI
    1. Bertioli D. J., Cannon S. B., Froenicke L., Huang G., Farmer A. D., Cannon E. K., et al. . (2016). The genome sequences of Arachis duranensis and Arachis ipaensis, the diploid ancestors of cultivated peanut. Nat Genet. 48, 438–446. 10.1038/ng.3517 - DOI - PubMed

LinkOut - more resources