

Distinct role of subunits of the Arabidopsis RNA polymerase II elongation factor PAF1C in transcriptional reprogramming
- PMID: 36247629
- PMCID: PMC9558118
- DOI: 10.3389/fpls.2022.974625
Distinct role of subunits of the Arabidopsis RNA polymerase II elongation factor PAF1C in transcriptional reprogramming
Abstract
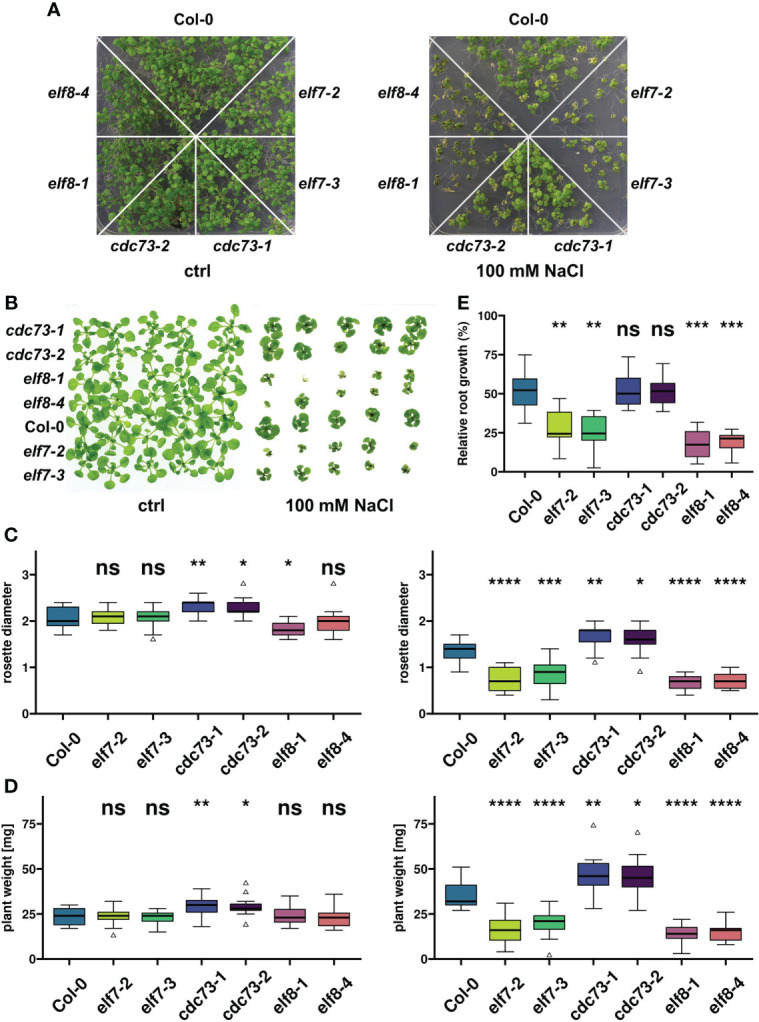
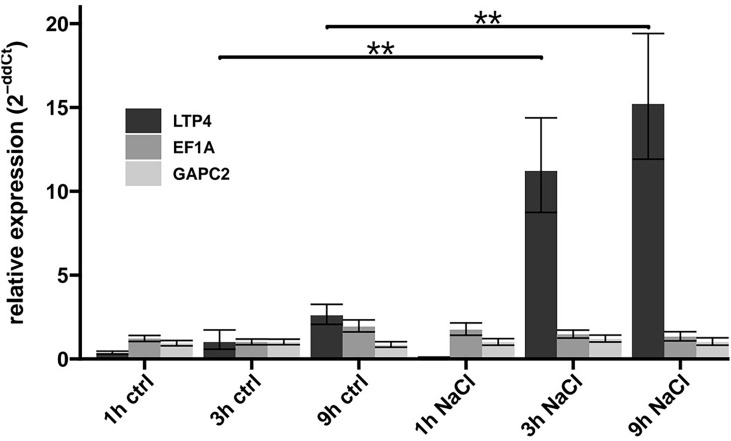
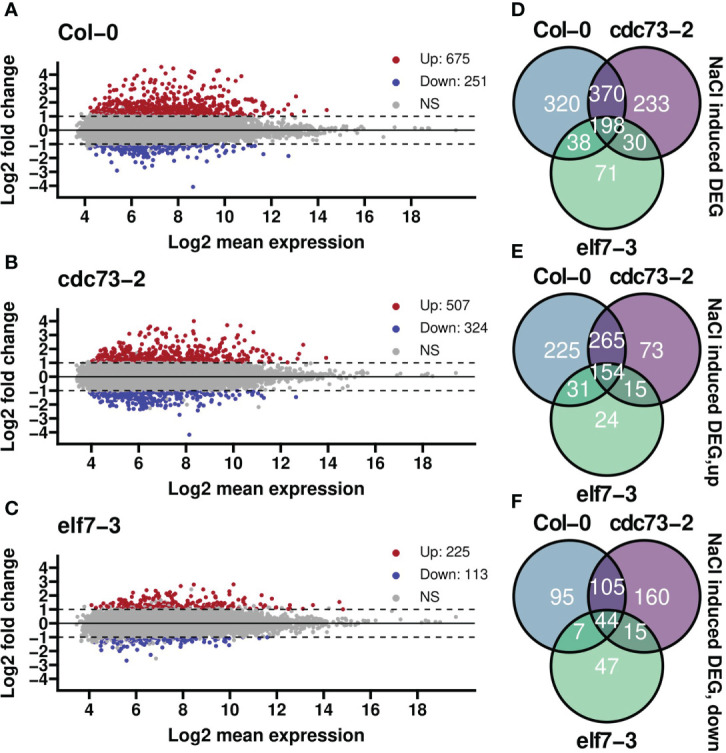
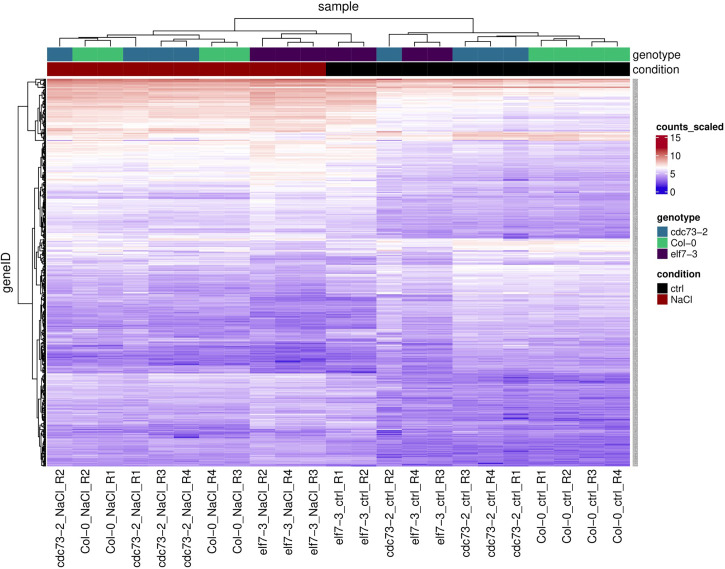
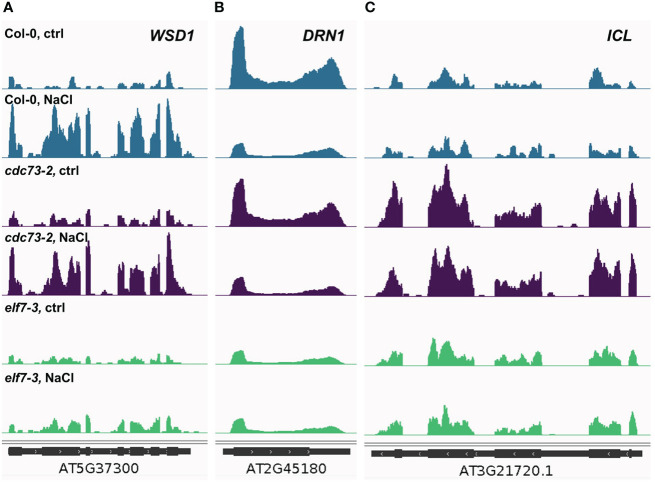
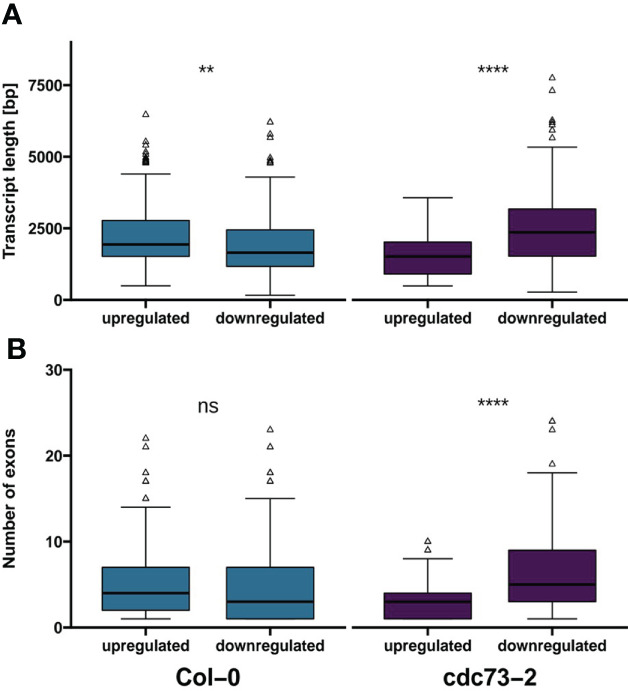
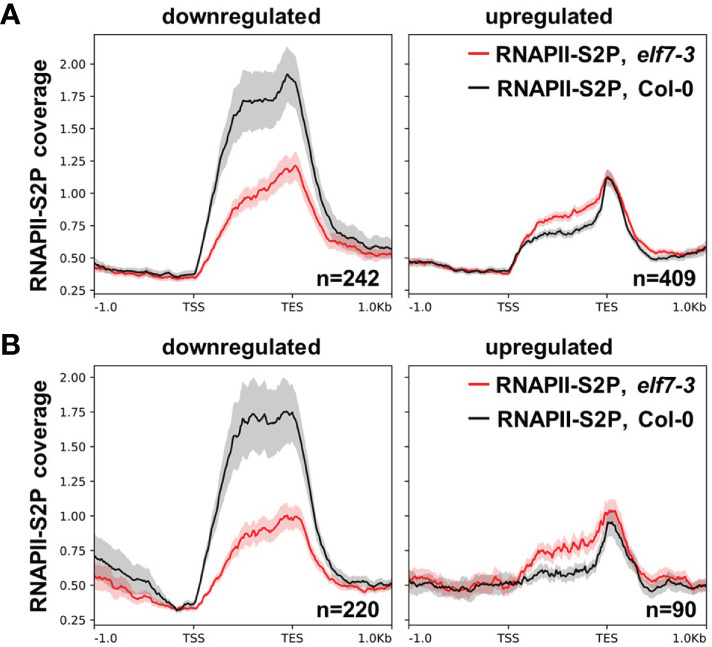
Transcript elongation by RNA polymerase II (RNAPII) is dynamic and highly regulated, thereby contributing to the implementation of gene expression programs during plant development or in response to environmental cues. The heterohexameric polymerase-associated factor 1 complex (PAF1C) stabilizes the RNAPII elongation complex promoting efficient transcript synthesis. In addition, PAF1C links transcriptional elongation with various post-translational histone modifications at transcribed loci. We have exposed Arabidopsis mutants deficient in the PAF1C subunits ELF7 or CDC73 to elevated NaCl concentrations to provoke a transcriptional response. The growth of elf7 plants was reduced relative to that of wildtype under these challenging conditions, whereas cdc73 plants exhibited rather enhanced tolerance. Profiling of the transcriptional changes upon NaCl exposure revealed that cdc73 responded similar to wildtype. Relative to wildtype and cdc73, the transcriptional response of elf7 plants was severely reduced in accord with their greater susceptibility to NaCl. The data also imply that CDC73 is more relevant for the transcription of longer genes. Despite the fact that both ELF7 and CDC73 are part of PAF1C the strikingly different transcriptional response of the mutants upon NaCl exposure suggests that the subunits have (partially) specific functions.
Keywords: Arabidopsis thaliana; PAF1C; RNA polymerase II; chromatin; histone modifications; transcript elongation.
Copyright © 2022 Obermeyer, Stöckl, Schnekenburger, Moehle, Schwartz and Grasser.
Conflict of interest statement
The authors declare that the research was conducted in the absence of any commercial or financial relationships that could be construed as a potential conflict of interest. The reviewer IL declared a past co-authorship with one of the authors KDG to the handling editor.
Figures
Similar articles
-
The plant POLYMERASE-ASSOCIATED FACTOR1 complex links transcription and H2B monoubiquitination genome wide.Plant Physiol. 2024 Apr 30;195(1):640-651. doi: 10.1093/plphys/kiae041. Plant Physiol. 2024. PMID: 38285074 Free PMC article.
-
The role of RNA polymerase II transcript elongation factors in plant stress responses.J Exp Bot. 2025 Jun 17;76(9):2447-2454. doi: 10.1093/jxb/erae472. J Exp Bot. 2025. PMID: 39626103 Review.
-
Multiple direct and indirect roles of the Paf1 complex in transcription elongation, splicing, and histone modifications.Cell Rep. 2024 Sep 24;43(9):114730. doi: 10.1016/j.celrep.2024.114730. Epub 2024 Sep 7. Cell Rep. 2024. PMID: 39244754 Free PMC article.
-
The Arabidopsis Paf1c complex component CDC73 participates in the modification of FLOWERING LOCUS C chromatin.Plant Physiol. 2010 Jul;153(3):1074-84. doi: 10.1104/pp.110.158386. Epub 2010 May 12. Plant Physiol. 2010. PMID: 20463090 Free PMC article.
-
Transcript elongation by RNA polymerase II in plants: factors, regulation and impact on gene expression.Plant J. 2024 May;118(3):645-656. doi: 10.1111/tpj.16115. Epub 2023 Feb 12. Plant J. 2024. PMID: 36703573 Review.
Cited by
-
The plant POLYMERASE-ASSOCIATED FACTOR1 complex links transcription and H2B monoubiquitination genome wide.Plant Physiol. 2024 Apr 30;195(1):640-651. doi: 10.1093/plphys/kiae041. Plant Physiol. 2024. PMID: 38285074 Free PMC article.
-
TFIIS is required for reproductive development and thermal adaptation in barley.Plant Cell Rep. 2024 Oct 10;43(11):260. doi: 10.1007/s00299-024-03345-1. Plant Cell Rep. 2024. PMID: 39390135 Free PMC article.
-
Adaptation to reductions in chilling availability using variation in PLANT HOMOLOGOUS TO PARAFIBROMIN in Brassica napus.Front Plant Sci. 2024 Oct 22;15:1481282. doi: 10.3389/fpls.2024.1481282. eCollection 2024. Front Plant Sci. 2024. PMID: 39502921 Free PMC article.
-
Different elongation factors distinctly modulate RNA polymerase II transcription in Arabidopsis.Nucleic Acids Res. 2023 Nov 27;51(21):11518-11533. doi: 10.1093/nar/gkad825. Nucleic Acids Res. 2023. PMID: 37819035 Free PMC article.
-
dCas-Based Tools to Visualize Chromatin or Modify Epigenetic Marks at Specific Plant Genomic Loci.Methods Mol Biol. 2025;2873:305-332. doi: 10.1007/978-1-0716-4228-3_17. Methods Mol Biol. 2025. PMID: 39576609 Review.
References
-
- Abdullah H. M., Rodriguez J., Salacup J. M., Castañeda I. S., Schnell D. J., Pareek A., et al. . (2021). Increased cuticle waxes by overexpression of WSD1 improves osmotic stress tolerance in arabidopsis thaliana and camelina sativa. Int.J.Mol.Sci. 22, 5173. doi: 10.3390/ijms22105173 - DOI - PMC - PubMed
LinkOut - more resources
Full Text Sources
Molecular Biology Databases