. 2022 Oct 10:1-19.
doi: 10.1007/s11469-022-00932-9. Online ahead of print.

Unanticipated Changes in Drug Overdose Death Rates in Canada During the Opioid Crisis

Affiliations

Unanticipated Changes in Drug Overdose Death Rates in Canada During the Opioid Crisis

John Snowdon et al. Int J Ment Health Addict. .

Abstract

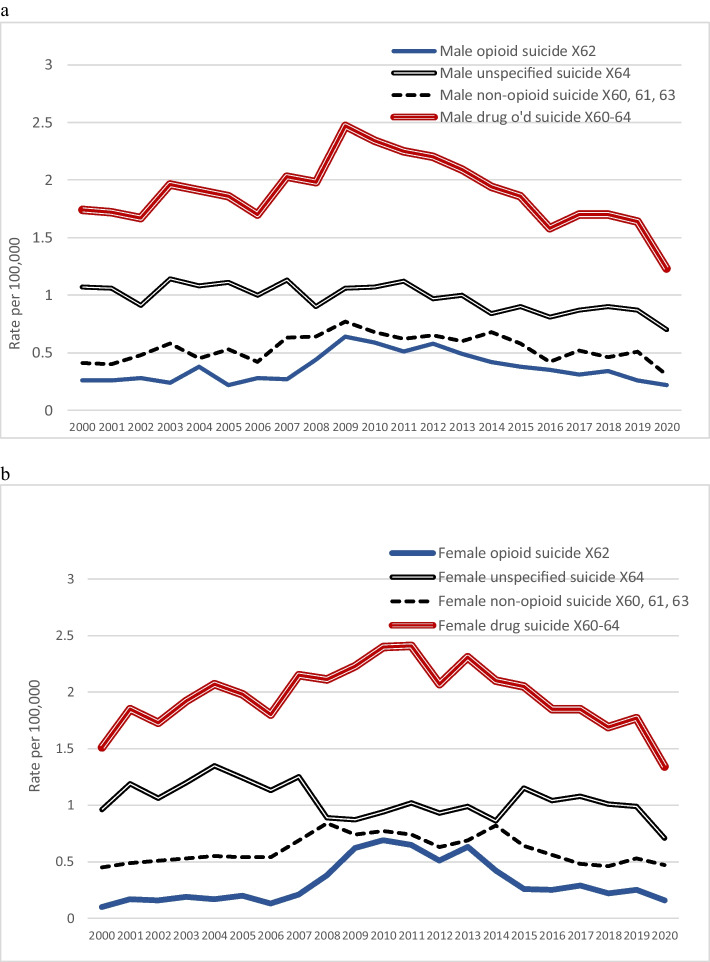
Escalating drug overdose death rates in Canada are of ever-increasing concern. To better understand the extent of this health threat, we obtained mortality statistics and population figures for the years 2000 to 2020, and examined rates of overdose deaths, coded (using ICD-10) as accidental, suicide or "undetermined intent." The drug deemed as primarily responsible for the death was categorized as opioid, non-opioid, or unspecified. Age patterns of drug deaths were graphed. Joinpoint analysis was used to test the significance of changes in death rates. Accidental opioid and stimulant overdose death rates in Canada have climbed faster since 2011, though not as high as corresponding US rates. Unknown cause death rates have increased. However, opioid and non-opioid suicide rates have decreased significantly since 2011, and there have been fewer drug deaths of undetermined intent. Increased attention to the possibility that some suicides are being misclassified is warranted.

Keywords: Accidental poisoning; Canada; Mortality rates; Opioid crisis; Overdose deaths; Suicide.


Conflict of interest statement

Conflict of InterestThe authors declare no competing interests.

Figures

Fig. 1
Fig. 1
Comparison of male and female accidental versus suicide versus EUI drug overdose death rates. Note: ICD-10 codes: X40–44, accidental poisoning by drugs or medications; X60–64, intentional poisoning by drugs or medications; Y10–14, Deaths attributed to events of undetermined intent (EUI)
Fig. 2
Fig. 2
Accidental drug overdose death rates (a male, b female). Note: ICD-10 codes: X40, accidental poisoning by nonopioid analgesics, antipyretics, antirheumatics; X41, accidental poisoning by antiepileptic, sedative-hypnotic, antiparkinsonism, and/or psychotropic drugs not elsewhere classified; X42, accidental poisoning by narcotics and psychodysleptics (hallucinogens); X43, accidental poisoning by drugs acting on the autonomic nervous system; X44, accidental poisoning by other and unspecified drugs
Fig. 3
Fig. 3
Drug suicide rates (a male, b female). Note: ICD-10 codes: X60, suicide by taking nonopioid analgesics, antipyretics, antirheumatics; X61, suicide by taking antiepileptic, sedative-hypnotic, antiparkinsonism, and/or psychotropic drugs not elsewhere classified; X62, suicide by taking narcotics, psychodysleptics (hallucinogens); X63, suicide by taking drugs acting on the autonomic nervous system; X64, suicide by taking other or unspecified drugs
Fig. 4
Fig. 4
A comparison of age patterns (male and female) of accidental drug overdose deaths (X40–44) and of drug suicides (X60–64), 2014–2018
Fig. 5
Fig. 5
Age patterns of accidental opioid (X42)), non-opioid (X40, 41, 43), and unspecified/other (X44) drug overdose death rates, 2014–2018
Fig. 6
Fig. 6
A comparison of age patterns of male and female drug suicide death rates, 2014. Note: ICD-10 codes: X60–64, accidental poisoning by drugs or medications; X62, accidental poisoning by narcotics; X64, accidental poisoning by other and unspecified drugs. For clarity, non-opioid suicide rates (X60, 61, 63) have not been graphed. Patterns of opioid and non-opioid suicide rates were similar, but rates of the latter were higher (peaking at around 50–59 years; male 0.98, female 1.17)
Fig. 7
Fig. 7
Male and female suicide rates (any method) (X60–84) compared with rates of death due to ill-defined or unspecified cause (R99), 2000–2020
Fig. 8
Fig. 8
A comparison of age patterns of rates of male and female R99 (ill-defined/unspecified cause) deaths, 2014–2018

References

    1. Bakst SS, Braun T, Zucker I, Amitai Z, Shohat T. The accuracy of suicide statistics: Are true suicide deaths misclassified? Social Psychiatry and Psychiatric Epidemiology. 2016;51(1):115–123. doi: 10.1007/s00127-015-1119-x. - DOI - PubMed
    1. Belzak, L., & Halverson, J. (2018). The opioid crisis in Canada: A national perspective. Health Promotion and Chronic Disease Prevention in Canada: Research, Policy and Practice, 38(6), 224–233. 10.24095/hpcdp.38.6.02 - PMC - PubMed
    1. Bohnert KM, Ilgen MA, Louzon S, McCarthy JF, Katz I. Substance use disorders and the risk of suicide mortality among men and women in the US Veterans Health Administration. Addiction. 2017;112(7):1193–1201. doi: 10.1111/add.13774. - DOI - PubMed
    1. Centers for Disease Control and Prevention (2019). Annual surveillance report of drug-related risks and outcomes – United States, 2017. Surveillance Report 1. https://www.cdc.gov/drugoverdose/pdf/pubs/2017-cdc-drug-surveillance-rep... Accessed August 10, 2022.
    1. Centers for Disease Control and Prevention (2022). Death Rate Maps & Graphs. www.cdc.gov/drugoverdose/deaths Accessed August 10, 2022.

LinkOut - more resources