. 2022 Sep 20;12(18):e4510.
doi: 10.21769/BioProtoc.4510.

Protein Tyrosine Phosphatase Biochemical Inhibition Assays

Affiliations

Protein Tyrosine Phosphatase Biochemical Inhibition Assays

Marek R Baranowski et al. Bio Protoc. .

Abstract

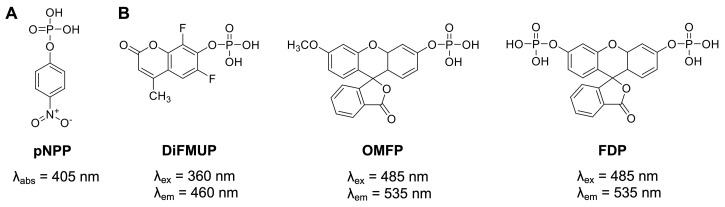
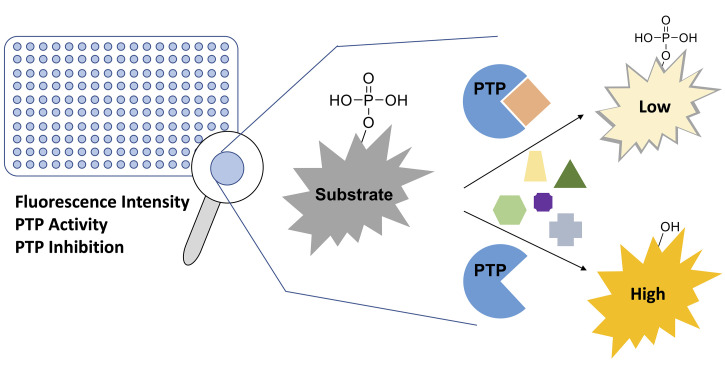
Disturbance of the dynamic balance between protein tyrosine phosphorylation and dephosphorylation, modulated by protein tyrosine kinases (PTKs) and protein tyrosine phosphatases (PTPs), is known to be crucial for the development of many human diseases. The discovery of agents that restore this balance has been the subject of many drug research efforts, most of which have focused on tyrosine kinase inhibitors (TKIs), resulting in the development of more than 50 FDA-approved TKIs during the past two decades. More recently, accumulating evidence has suggested that members of the PTP superfamily are also promising drug targets, and efforts to discover tyrosine phosphatase inhibitors (TPIs) have increased dramatically. Here, we provide protocols for determining the potency of TPIs in vitro. We focus on the use of fluorescence-based substrates, which exhibit a dramatic increase in fluorescence emission when dephosphorylated by the PTP, and thus allow setting up highly sensitive and miniaturized phosphatase activity assays using 384-well or 1536-well microplates and a continuous (kinetic) assay format. The protocols cover PTP specific activity assays, Michaelis-Menten kinetics, dose-response inhibition assays, and dose-response data analysis for determining IC 50 values. Potential pitfalls are also discussed. While advanced instrumentation is utilized for compound spotting and liquid dispensing, all the assays can be adapted to existing equipment in most laboratories. Assays are described for selected PTP drug targets, including SHP2 ( PTPN11 ), PTP1B ( PTPN1 ), STEP ( PTPN5 ), and VHR ( DUSP3 ). However, all protocols are applicable to members of the PTP enzyme family in general. Graphical abstract.

Keywords: DUSP; Dose-response assay; IC 50; Inhibitor; Michaelis–Menten; PTP1B; Protein tyrosine phosphatase; SHP2; VHR.


Conflict of interest statement

Competing interests The authors declare that they have no conflicts of interest with the contents of this article.

Figures

Figure 1.
Figure 1.. Generic protein phosphatase substrates used for PTP enzymatic assays.
(A) The colorimetric substrate p -nitrophenyl phosphate (pNPP ). (B) The fluorogenic substrates 6,8-difluoro-4-methylumbelliferyl phosphate (DiFMUP), 3- O -methylfluorescein phosphate (OMFP), and fluorescein diphosphate (FDP).
Figure 2.
Figure 2.. Enzyme serial dilution scheme (A) and assay plate layout (B) for PTP activity assay.
EIS, enzyme intermediate solution; ES, enzyme solution; EB, enzyme buffer; SS, substrate solution; BG, background.
Figure 3.
Figure 3.. Continuous (kinetic) phosphatase activity assay.
Representative PTP activity progression curves using OMFP (A) or DiFMUP (B) as the substrate. Plots show fluorescence intensity values in relative fluorescence units (RFU) read every minute over a 30 min period for reactions with the indicated concentrations of PTP1B or enzyme buffer (EB; no-enzyme control, background). Each data point represents the average from four reaction wells ± standard deviation (SD). Simple linear regression has been fitted to the data. Values for initial velocity rates V (slopes), regression coefficients (R 2 ), signal to background (S/B), and signal to noise (S/N) are presented in the tables below. S/B and S/N ratios were calculated from relative fluorescence values at the 10 min time point.
Figure 4.
Figure 4.. IRS-1 titration for SHP2-WT activity assay.
(A) IRS-1 peptide serial dilution scheme. (B) Assay plate layout. Add 20 µL of enzyme buffer (EB; background control) or enzyme solutions (ES), followed by 5 µL of substrate solution (SS). (C) SHP2-WT (0.5 nM) activity (expressed as initial velocity rate V) in the presence of different IRS-1 peptide concentrations using DiFMUP (100 µM) as the substrate. For comparison, the activity of recombinant SHP2 catalytic domain (SHP2cat; 0.5 nM) without IRS-1 peptide is included. Enzyme buffer was used in the no-enzyme control experiment. The data represent the mean ± SD. Statistical significance of SHP2-WT activation by IRS-1 was determined using the unpaired t -test (n = 4; n.s.: not significant; **** p < 0.0001).
Figure 5.
Figure 5.. Substrate serial dilution scheme and assay plate layout for Michaelis–Menten kinetics assay.
In step 1, a substrate serial dilution (1:1) is prepared at 5× final concentration. In step 2, 5 µL of each substrate solution (SS) is transferred into column 1, which serves as the background control and contains 20 µL of enzyme buffer (EB), and columns 2–4, which serve as the triplicate PTP reaction wells and contain 20 µL of enzyme solution (ES).
Figure 6.
Figure 6.. Michaelis–Menten kinetics.
(A) Initial velocities rates ( V ) in relative fluorescence units per minute (RFU/min) from a Michaelis–Menten experiment for STEP 46 (2.5 nM) using OMFP at the indicated concentrations. Initial rates for the enzyme buffer (EB) control ( V control (EB) ; background) and for the STEP 46 reaction in triplicate ( V 1–3 ) were calculated from raw fluorescence emission data using the Magellan Tecan Microplate Reader software. (B) Michaelis–Menten plot using the background-corrected initial rates ( V 1-corr , V 2-corr , V 3-corr ) for STEP 46 from (A). The data (represented as the mean ± SD) was fitted to the Michaelis–Menten equation model (eq. 5), and the Michaelis–Menten constant ( K m ) was calculated using GraphPad Prism. The dashed lines indicate the STEP 46 maximum velocity ( V max ) and half-maximum velocity ( V max /2).
Figure 7.
Figure 7.. Representative data from a 10-point dose-response VHR inhibition assay.
(A) Plate setup and initial velocity rates. Column 1 serves as the negative control (vehicle control). Column 2 serves as the positive control (contains no enzyme). Eleven candidate compounds (marked with different colors) were tested in a 10-point dose-response format in triplicate (100, 33, 11, 3.7, 1.2, 0.41, 0.14, 0.045, 0.015, and 0.005 μM final compound concentration). Wells K23 through P24 (white) do not contain DMSO or compound and are excluded from the analysis. (B) Assay plate statistical data. Initial rates for positive and negative controls are represented as mean ± SD. For Z’-factor definition and calculation see Data analysis section. (C) Example of normalized inhibition data and fitted IC 50 curve (IC 50 ± SE; analyzed in GraphPad Prism).
None
None
None
None
None
None
None
None

References

    1. Bessey O. A. , Lowry O. H. and Brock M. J. ( 1946 . ). A method for the rapid determination of alkaline phosphates with five cubic millimeters of serum . J Biol Chem 164 : 321 - 329 . - PubMed
    1. Chen Y. N. , LaMarche M. J. , Chan H. M. , Fekkes P. , Garcia-Fortanet J. , Acker M. G. , Antonakos B. , Chen C. H. , Chen Z. , Cooke V. G. , et al. .( 2016 . ). Allosteric inhibition of SHP2 phosphatase inhibits cancers driven by receptor tyrosine kinases . Nature 535 ( 7610 ): 148 - 152 . - PubMed
    1. Cohen P. , Cross D. and Janne P. A. ( 2021 . ). Kinase drug discovery 20 years after imatinib: progress and future directions . Nat Rev Drug Discov 20 ( 7 ): 551 - 569 . - PMC - PubMed
    1. Feng B. Y. and Shoichet B. K. ( 2006 . ). A detergent-based assay for the detection of promiscuous inhibitors . Nat Protoc 1 ( 2 ): 550 - 553 . - PMC - PubMed
    1. Goebel-Goody S. M. , Baum M. , Paspalas C. D. , Fernandez S. M. , Carty N. C. , Kurup P. and Lombroso P. J. ( 2012 . ). Therapeutic implications for striatal-enriched protein tyrosine phosphatase(STEP) in neuropsychiatric disorders . Pharmacol Rev 64 ( 1 ): 65 - 87 . - PMC - PubMed