

High phenylalanine concentrations induce demyelination and microglial activation in mouse cerebellar organotypic slices
- PMID: 36248632
- PMCID: PMC9559601
- DOI: 10.3389/fnins.2022.926023
High phenylalanine concentrations induce demyelination and microglial activation in mouse cerebellar organotypic slices
Abstract
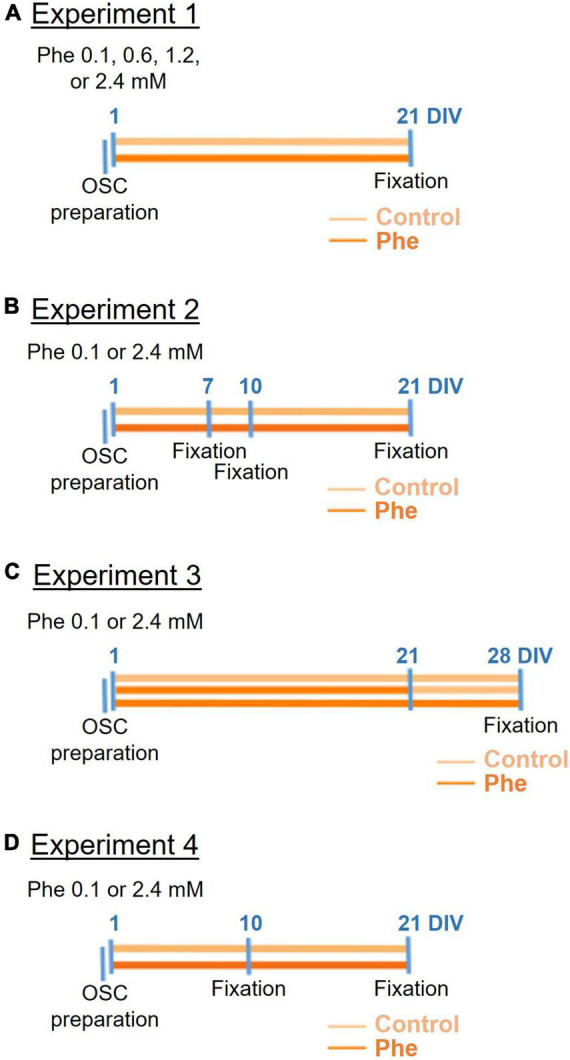
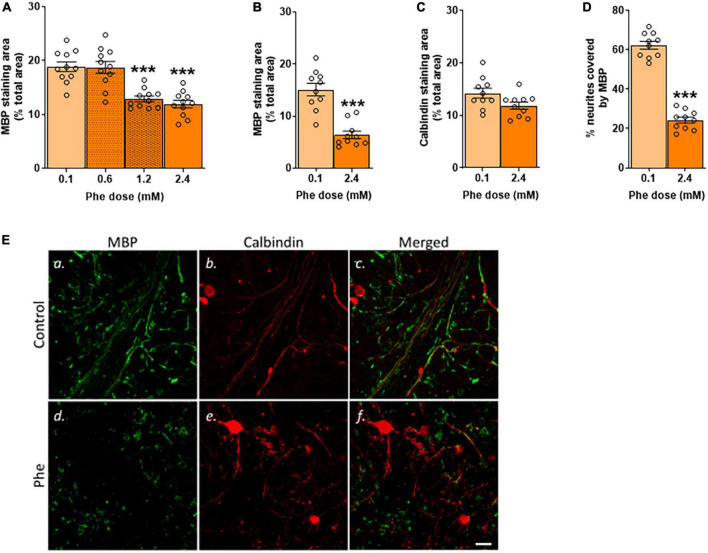
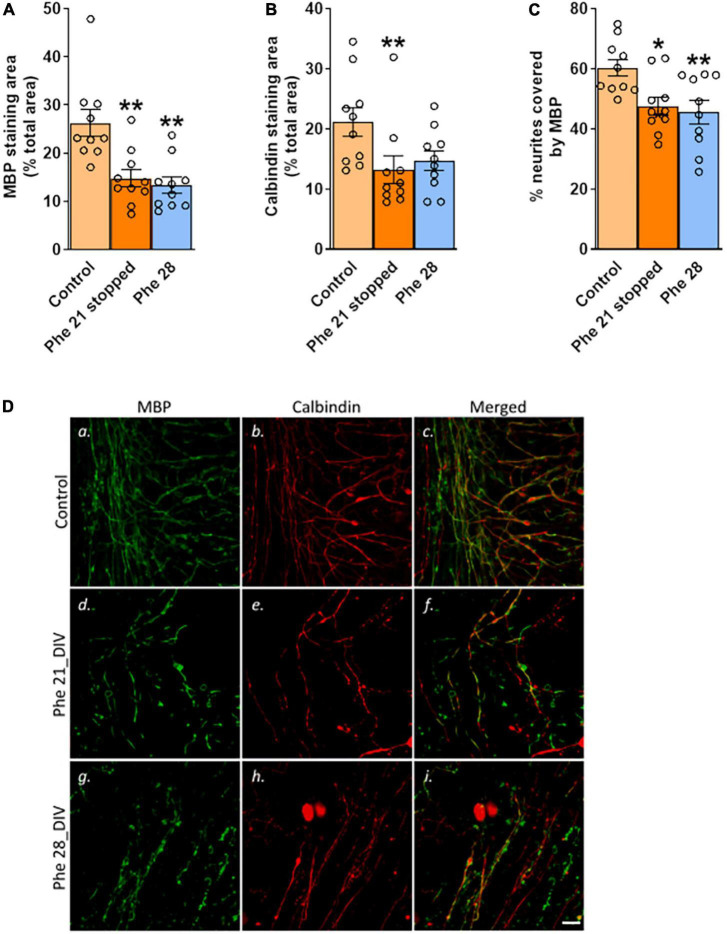
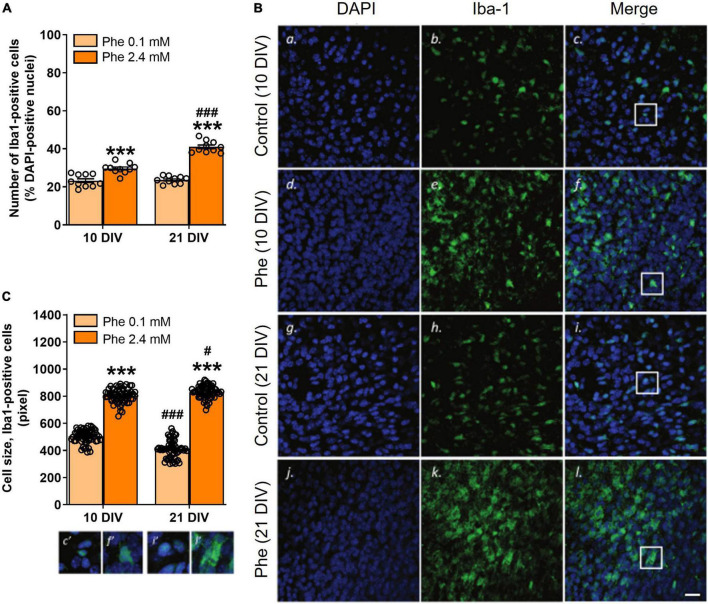
Phenylketonuria (PKU) is an inborn error of metabolism. Mutations in the enzyme phenylalanine hydroxylase (PAH)-encoding gene lead to a decreased metabolism of the amino acid phenylalanine (Phe). The deficiency in PAH increases Phe levels in blood and brain. Accumulation of Phe can lead to delayed development, psychiatric problems and cognitive impairment. White matter (WM) damage is a neuropathological hallmark of PKU and can be seen even in early detected and treated PKU patients. The mechanisms linking high Phe concentrations to WM abnormalities remain unclear. We tested the effects of high Phe concentrations on myelin in three in vitro models of increasing complexity: two simple cell culture models and one model that preserves local brain tissue architecture, a cerebellar organotypic slice culture prepared from postnatal day (P) 8 CD-1 mice. Various Phe concentrations (0.1-10 mM) and durations of exposure were tested. We found no toxic effect of high Phe in the cell culture models. On the contrary, the treatment promoted the maturation of oligodendrocytes, particularly at the highest, non-physiological Phe concentrations. Exposure of cerebellar organotypic slices to 2.4 mM Phe for 21 days in vitro (DIV), but not 7 or 10 DIV, resulted in a significant decrease in myelin basic protein (MBP), calbindin-stained neurites, and neurites co-stained with MBP. Following exposure to a toxic concentration of Phe, a switch to the control medium for 7 days did not lead to remyelination, while very active remyelination was seen in slices following demyelination with lysolecithin. An enhanced number of microglia, displaying an activated type morphology, was seen after exposure of the slices to 2.4 mM Phe for 10 or 21 DIV. The results suggest that prolonged exposure to high Phe concentrations can induce microglial activation preceding significant disruption of myelin.
Keywords: cerebellum; microglia; organotypic slices; phenylalanine; phenylketonuria; white matter.
Copyright © 2022 Thau-Zuchman, Pallier, Savelkoul, Kuipers, Verkuyl and Michael-Titus.
Conflict of interest statement
The authors declare that this study received funding from Danone Nutricia Research. AM-T was a consultant for Nutricia Research and OT-Z and PNP’s research was supported by Nutricia Research. PJS, AK, and JMV are employees of Danone Nutricia Research. The funder was not involved in the study design, collection, analysis, interpretation of data, the writing of this article or the decision to submit it for publication.
Figures
Similar articles
-
Lysolecithin induces demyelination in vitro in a cerebellar slice culture system.J Neurosci Res. 2004 Oct 15;78(2):157-66. doi: 10.1002/jnr.20248. J Neurosci Res. 2004. PMID: 15378614
-
A culture model for the assessment of phenylalanine neurotoxicity in phenylketonuria.In Vitro Model. 2022 Jan 27;1(1):103-114. doi: 10.1007/s44164-021-00007-4. eCollection 2022 Feb. In Vitro Model. 2022. PMID: 39872976 Free PMC article.
-
Evidence for central nervous system glial cell plasticity in phenylketonuria.J Neuropathol Exp Neurol. 1996 Jul;55(7):795-814. doi: 10.1097/00005072-199607000-00005. J Neuropathol Exp Neurol. 1996. PMID: 8965095
-
A structural hypothesis for BH4 responsiveness in patients with mild forms of hyperphenylalaninaemia and phenylketonuria.J Inherit Metab Dis. 2001 Apr;24(2):213-30. doi: 10.1023/a:1010371002631. J Inherit Metab Dis. 2001. PMID: 11405341 Review.
-
White matter disturbances in phenylketonuria: Possible underlying mechanisms.J Neurosci Res. 2021 Jan;99(1):349-360. doi: 10.1002/jnr.24598. Epub 2020 Mar 6. J Neurosci Res. 2021. PMID: 32141105 Review.
Cited by
-
Metabolomics and Lipidomics Explore Phenotype-Specific Molecular Signatures for Phenylketonuria.Int J Mol Sci. 2025 Jul 25;26(15):7171. doi: 10.3390/ijms26157171. Int J Mol Sci. 2025. PMID: 40806304 Free PMC article.
-
Microglia Morphological Response to Mesenchymal Stromal Cell Extracellular Vesicles Demonstrates EV Therapeutic Potential for Modulating Neuroinflammation.bioRxiv [Preprint]. 2024 Jul 3:2024.07.01.601612. doi: 10.1101/2024.07.01.601612. bioRxiv. 2024. Update in: J Biol Eng. 2024 Oct 17;18(1):58. doi: 10.1186/s13036-024-00449-w. PMID: 39005342 Free PMC article. Updated. Preprint.
-
Microglia morphological response to mesenchymal stromal cell extracellular vesicles demonstrates EV therapeutic potential for modulating neuroinflammation.J Biol Eng. 2024 Oct 17;18(1):58. doi: 10.1186/s13036-024-00449-w. J Biol Eng. 2024. PMID: 39420399 Free PMC article.
-
Genetically predicted amino acids related to neural regulation mediate the association between diabetes mellitus and postherpetic neuralgia: a Mendelian randomization study.Diabetol Metab Syndr. 2025 Mar 28;17(1):104. doi: 10.1186/s13098-025-01672-1. Diabetol Metab Syndr. 2025. PMID: 40149016 Free PMC article.
References
-
- Allen I. V., Kirk J. (1992). “Demyelinating diseases,” in Greenfield’s neuropathology, eds Adams J. H., Duchen L. W. (London: Edward Arnold; ), 447–520.
-
- Atallah N., Vasiu R., Boşca A. B., Cret̨u D. I., Georgiu C., Constantin A. M., et al. (2014). Microglia–performers of the 21st century. Rom. J. Morphol. Embryol. 55 745–765. - PubMed
LinkOut - more resources
Full Text Sources
Miscellaneous