. 2022 Sep 30:16:943976.
doi: 10.3389/fnhum.2022.943976. eCollection 2022.

Electrophysiological indices of pain expectation abnormalities in fibromyalgia patients

Affiliations

Electrophysiological indices of pain expectation abnormalities in fibromyalgia patients

Paloma Barjola et al. Front Hum Neurosci. .

Abstract

Fibromyalgia is a chronic pain syndrome characterized by dysfunctional processing of nociceptive stimulation. Neuroimaging studies have pointed out that pain-related network functioning seems to be altered in these patients. It is thought that this clinical symptomatology may be maintained or even strengthened because of an enhanced expectancy for painful stimuli or its forthcoming appearance. However, neural electrophysiological correlates associated with such attentional mechanisms have been scarcely explored. In the current study, expectancy processes of upcoming laser stimulation (painful and non-painful) and its further processing were explored by event-related potentials (ERPs). Nineteen fibromyalgia patients and twenty healthy control volunteers took part in the experiment. Behavioral measures (reaction times and subjective pain perception) were also collected. We manipulated the pain/no pain expectancy through an S1-S2 paradigm (cue-target). S1 (image: triangle or square) predicted the S2 appearance (laser stimulation: warmth or pinprick sensation). Laser stimuli were delivered using a CO2 laser device. Temporal and spatial principal component analyses were employed to define and quantify the ERP component reliability. Statistical analyses revealed the existence of an abnormal pattern of pain expectancy in patients with fibromyalgia. Specifically, our results showed attenuated amplitudes at posterior lCNV component in anticipation of painful stimulation that was not found in healthy participants. In contrast, although larger P2 amplitudes to painful compared to innocuous events were shown, patients did not show any amplitude change in this laser-evoked response as a function of pain predictive cues (as occurred in the healthy control group). Additionally, analyses of the subjective perception of pain and reaction time indicated that laser stimuli preceded by pain cues were rated as more painful than those signaling non-pain expectancy and were associated with faster responses. Differences between groups were not found. The present findings suggest the presence of dysfunction in pain expectation mechanisms in fibromyalgia that eventually may make it difficult for patients to correctly interpret signs that prevent pain symptoms. Furthermore, the abnormal pattern in pain expectancy displayed by fibromyalgia patients could result in ineffective pain coping strategies. Understanding the neural correlates of pain processing and its modulatory factors is crucial to identify treatments for chronic pain syndromes.

Keywords: CNV; LEPs; P2; fibromyalgia; pain expectations; pain processing.


Conflict of interest statement

The authors declare that the research was conducted in the absence of any commercial or financial relationships that could be construed as a potential conflict of interest.

Figures

FIGURE 1
FIGURE 1
Schematic representation of the experimental procedure. The S1–S2 paradigm is displayed, where S1 = cue (visual) correctly predicted the intensity of the upcoming S2 = target (laser stimulation) in 75% of the trials. (A) No Pain cue trial, and (B) pain cue trial representations. The interstimulus interval (ISI) was 1,500 ms. Intertrial interval (ITI) = 4,030 ms. Only responses within the first 2,000 ms of ITI were considered.
FIGURE 2
FIGURE 2
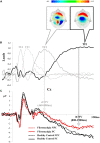
Correspondence between TFs and ERP components derived from the tPCA in the expectation period: (A) topographical distribution of early (TF2) and late (TF1) CNV; (B) TF loads after the application of tPCA; and (C) the correspondence of each component in the grand average of Cz. (PC, pain cue; NPC, no pain cue).
FIGURE 3
FIGURE 3
Grand averages of the expectation period: (A) ERP waveforms for fibromyalgia patients (red) and healthy control participants (black) in response to PC (solid lines) and NPC (dashed lines) at the posterior selected electrodes (Pz and POz). The time window (800–1,500 ms, gray rectangle) and topographic map of lCNV are also highlighted; and (B) means of the lCNV spatial factor scores (posterior region) for fibromyalgia (left) and healthy control participants (right) in PC (red) and NPC (gray) conditions. Asterisks show the comparison in which significant differences were found. Bars show the standard error (*p < 0.05). (PC, pain cue; NPC, no pain cue).
FIGURE 4
FIGURE 4
Correspondence between TFs and ERP components derived from the tPCA in the pain-processing period: (A) topographical distribution of the P2 of the LEPs; (B) TF loads after the application of tPCA; and (C) correspondence of each component of the LEPs in the grand average of Cz. (PC-P, pain cue - pain; NPC-P, no pain cue - pain; NPC-NP, no pain cue - no pain; PC-NP, pain cue - no pain).
FIGURE 5
FIGURE 5
Grand averages of LEP components (pain-processing period): The left side of the figure represents the P2 waveform for fibromyalgia and healthy control groups in response to PC-P (red), NPC-P (orange), PC-NP (gray) and NPC-NP (black) conditions. The means of the P2 spatial factor scores for each experimental condition are displayed in the middle. Asterisks represent significant differences (*p < 0.05). Bars indicate the standard error. The topographical maps of each scalp region of P2 are shown on the right side. (A) Pz for posterior P2, (B) Fz for frontal P2, and (C) Cz for the central P2 scalp regions. (PC-P, pain cue - pain; NPC-P, no pain cue - pain; NPC-NP, no pain cue - no pain; PC-NP, pain cue - no pain).
FIGURE 6
FIGURE 6
Behavioral data: Mean and standard deviation of (A) RTs (ms) and (B) subjective perception of pain (1–4) for healthy control (gray) and fibromyalgia (red) of the four experimental conditions (PC-P, pain cue-pain; NPC-NP, no pain cue-no pain; NPC-P, no pain cue-pain; PC-NP, pain cue-no pain). Bars represent the standard error.

References

    1. Aparicio V. A., Ortega F. B., Carbonell-Baeza A., Cuevas A. M., Delgado-Fernández M., Jonatan R. (2013). Anxiety, depression and fibromyalgia pain and severity. Psicol. Conductual 21 381–392.
    1. Apkarian A. V., Bushnell M. C., Treede R.-D., Zubieta J.-K. (2005). Human brain mechanisms of pain perception and regulation in health and disease. Eur. J. Pain 9 463–463. 10.1016/j.ejpain.2004.11.001 - DOI - PubMed
    1. Atlas L. Y., Wager T. D. (2012). How expectations shape pain. Neurosci. Lett. 520 140–148. 10.1016/j.neulet.2012.03.039 - DOI - PubMed
    1. Babiloni C., Arendt-Nielsen L., Pascual-Marqui R. D., Rossini P. M., Brancucci A., Del Percio C., et al. (2004). Cortical sensorimotor interactions during the expectancy of a Go/No-Go task: Effects of painful stimuli. Behav. Neurosci. 118 925–935. 10.1037/0735-7044.118.5.925 - DOI - PubMed
    1. Bartley E. J., Rhudy J. L., Williams A. E. (2009). Experimental assessment of affective processing in fibromyalgia. J. Pain 10 1151–1160. 10.1016/j.jpain.2009.04.008 - DOI - PubMed

LinkOut - more resources