

Signature construction and molecular subtype identification based on cuproptosis-related genes to predict the prognosis and immune activity of patients with hepatocellular carcinoma
- PMID: 36248822
- PMCID: PMC9555242
- DOI: 10.3389/fimmu.2022.990790
Signature construction and molecular subtype identification based on cuproptosis-related genes to predict the prognosis and immune activity of patients with hepatocellular carcinoma
Abstract
Background: Hepatocellular carcinoma (HCC) is one of the most common malignancies in the world, with high incidence, high malignancy, and low survival rate. Cuproptosis is a novel form of cell death mediated by lipoylated TCA cycle proteins-mediated novel cell death pathway and is highly associated with mitochondrial metabolism. However, the relationship between the expression level of cuproptosis-related genes (CRGs) and the prognosis of HCC is still unclear.
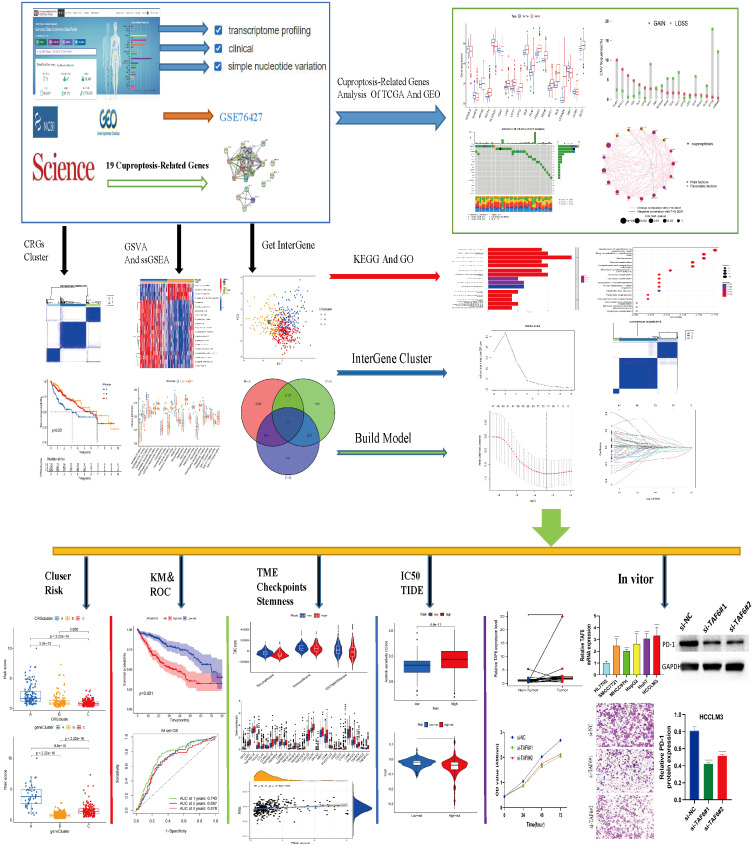
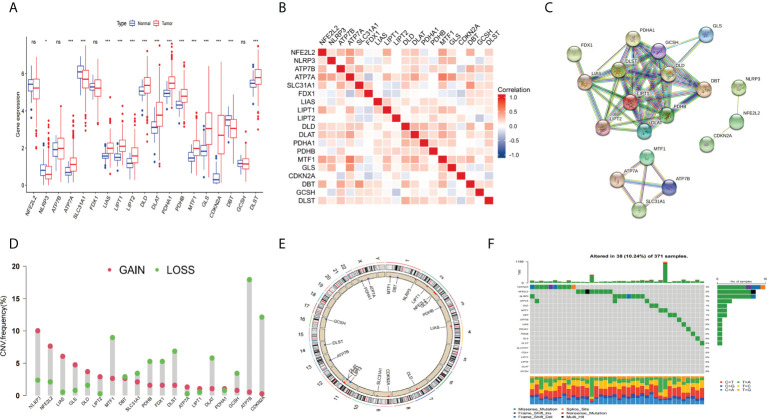
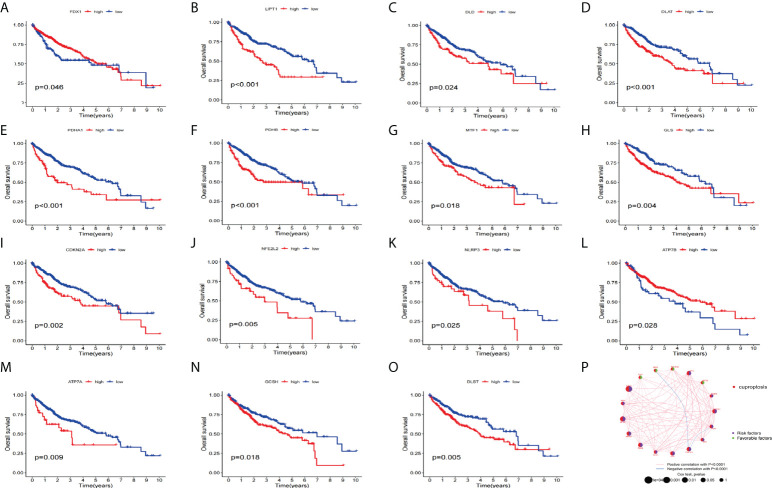
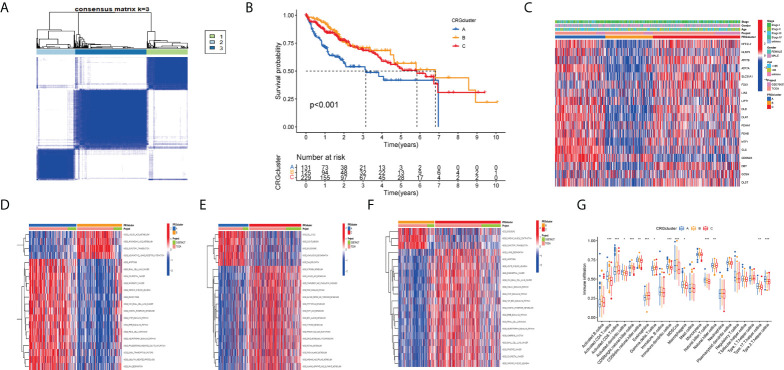
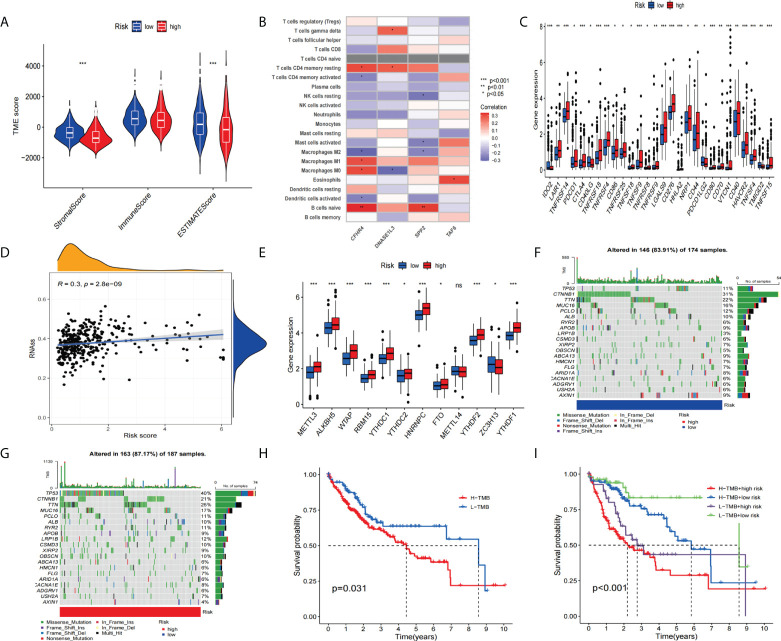
Methods: Combining the HCC transcriptomic data from The Cancer Genome Atlas(TCGA) and Gene Expression Omnibus (GEO) databases, we identified the differentially expressed cuproptosis-related genes (DECRGs) and obtained the prognosis-related DECRGs through univariate regression analysis.LASSO and multivariate COX regression analyses of these DECRGs yielded four genes that were used to construct the signature. Next, we use ROC curves to evaluate the performance of signatures. The tumor microenvironment, immune infiltration, tumor mutation load, half-maximum suppression concentration, and immunotherapy effects were also compared between the low-risk and high-risk groups. Finally, we analyzed the expression level, prognosis, and immune infiltration correlation on the four genes that constructed the model.
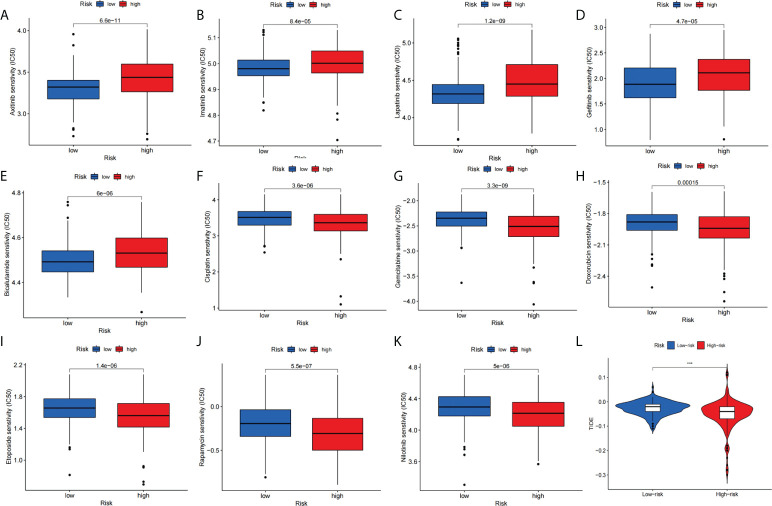
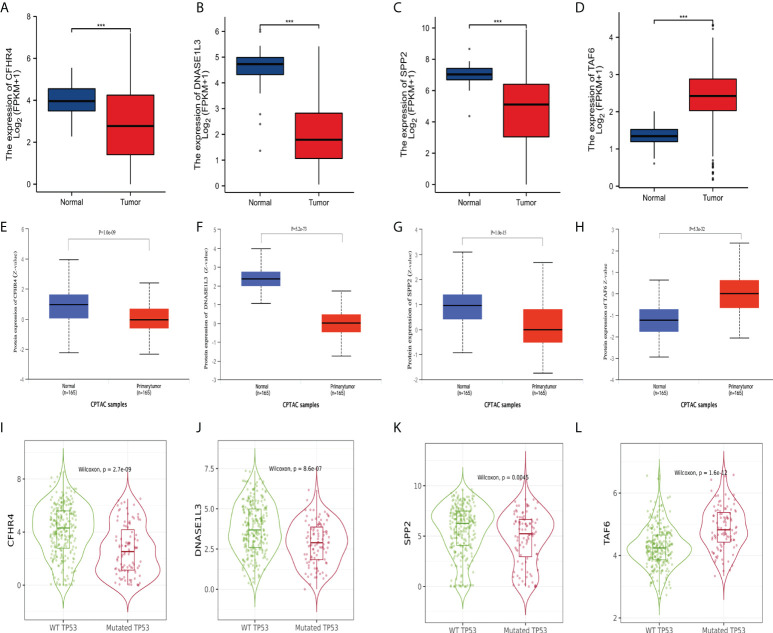
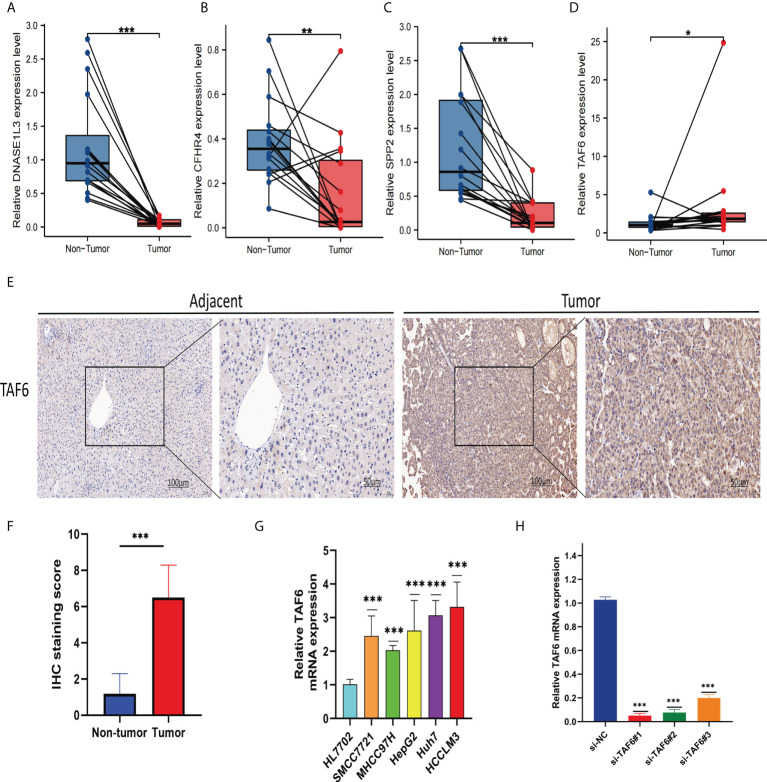
Results: Four DECRGs s were used to construct the signature. The ROC curves indicated that signature can better assess the prognosis of HCC patients. Patients were grouped according to the signature risk score. Patients in the low-risk group had a significantly longer survival time than those in the high-risk group. Furthermore, the tumor mutation burden (TMB) values were associated with the risk score and the higher-risk group had a higher proportion of TP53 mutations than the low-risk group.ESTIMATE analysis showed significant differences in stromal scores between the two groups.N6-methyladenosine (m6A) and multiple immune checkpoints were expressed at higher levels in the high-risk group. Then, we found that signature score correlated with chemotherapeutic drug sensitivity and immunotherapy efficacy in HCC patients. Finally, we further confirmed that the four DECRGs genes were associated with the prognosis of HCC through external validation.
Conclusions: We studied from the cuproptosis perspective and developed a new prognostic feature to predict the prognosis of HCC patients. This signature with good performance will help physicians to evaluate the overall prognosis of patients and may provide new ideas for clinical decision-making and treatment strategies.
Keywords: cuproptosis; hepatocellular carcinoma; immune infiltration; immune microenvironment; prognostic signature.
Copyright © 2022 Peng, Zhu, Liu, Luo, Wu, Liu, Li and Yuan.
Conflict of interest statement
The authors declare that the research was conducted in the absence of any commercial or financial relationships that could be construed as a potential conflict of interest.
Figures
Similar articles
-
A Cuproptosis-Related LncRNA Risk Model for Predicting Prognosis and Immunotherapeutic Efficacy in Patients with Hepatocellular Carcinoma.Biochem Genet. 2024 Jun;62(3):2332-2351. doi: 10.1007/s10528-023-10539-x. Epub 2023 Oct 29. Biochem Genet. 2024. PMID: 37898914
-
Cuproptosis-Related Signature Predicts the Prognosis, Tumor Microenvironment, and Drug Sensitivity of Hepatocellular Carcinoma.J Immunol Res. 2022 Nov 16;2022:3393027. doi: 10.1155/2022/3393027. eCollection 2022. J Immunol Res. 2022. PMID: 36438201 Free PMC article.
-
A novel cuproptosis-related lncRNA signature predicts the prognosis and immunotherapy for hepatocellular carcinoma.Cancer Biomark. 2023;37(1):13-26. doi: 10.3233/CBM-220259. Cancer Biomark. 2023. PMID: 37005878
-
Identification of a novel cuproptosis-related gene signature and integrative analyses in patients with lower-grade gliomas.Front Immunol. 2022 Aug 15;13:933973. doi: 10.3389/fimmu.2022.933973. eCollection 2022. Front Immunol. 2022. PMID: 36045691 Free PMC article. Review.
-
Identification of molecular subtypes and prognostic signatures based on transient receptor potential channel-related genes to predict the prognostic risk of hepatocellular carcinoma: A review.Medicine (Baltimore). 2023 Mar 10;102(10):e33228. doi: 10.1097/MD.0000000000033228. Medicine (Baltimore). 2023. PMID: 36897679 Free PMC article. Review.
Cited by
-
Assessing TGF-β Prognostic Model Predictions for Chemotherapy Response and Oncogenic Role of FKBP1A in Liver Cancer.Curr Pharm Des. 2024;30(39):3131-3152. doi: 10.2174/0113816128326151240820105525. Curr Pharm Des. 2024. PMID: 39185649
-
Identification of PANoptosis-related subtypes, construction of a prognosis signature, and tumor microenvironment landscape of hepatocellular carcinoma using bioinformatic analysis and experimental verification.Front Immunol. 2024 Apr 29;15:1323199. doi: 10.3389/fimmu.2024.1323199. eCollection 2024. Front Immunol. 2024. PMID: 38742112 Free PMC article.
-
Rhomboid-like 2 correlated with TME infiltration inhibits cuproptosis-related genes and drives malignant phenotype in clear cell renal cell carcinoma.Sci Rep. 2024 Nov 7;14(1):27053. doi: 10.1038/s41598-024-78713-8. Sci Rep. 2024. PMID: 39511359 Free PMC article.
-
A Risk Model Based on Ferroptosis-Related Genes OSMR, G0S2, IGFBP6, IGHG2, and FMOD Predicts Prognosis in Glioblastoma Multiforme.CNS Neurosci Ther. 2025 Jan;31(1):e70161. doi: 10.1111/cns.70161. CNS Neurosci Ther. 2025. PMID: 39815665 Free PMC article.
-
Molecular Subtyping of Hepatocellular Carcinoma via Lysosome-Related Genes for Prognosis and Therapy Prediction.Int J Gen Med. 2025 Jul 16;18:3933-3950. doi: 10.2147/IJGM.S490019. eCollection 2025. Int J Gen Med. 2025. PMID: 40692584 Free PMC article.
References
Publication types
MeSH terms
Substances
LinkOut - more resources
Full Text Sources
Medical
Research Materials
Miscellaneous