. 2022 Sep 29:13:842468.
doi: 10.3389/fimmu.2022.842468. eCollection 2022.

Persistent but dysfunctional mucosal SARS-CoV-2-specific IgA and low lung IL-1β associate with COVID-19 fatal outcome: A cross-sectional analysis

Affiliations

Persistent but dysfunctional mucosal SARS-CoV-2-specific IgA and low lung IL-1β associate with COVID-19 fatal outcome: A cross-sectional analysis

Maria Julia Ruiz et al. Front Immunol. .

Abstract

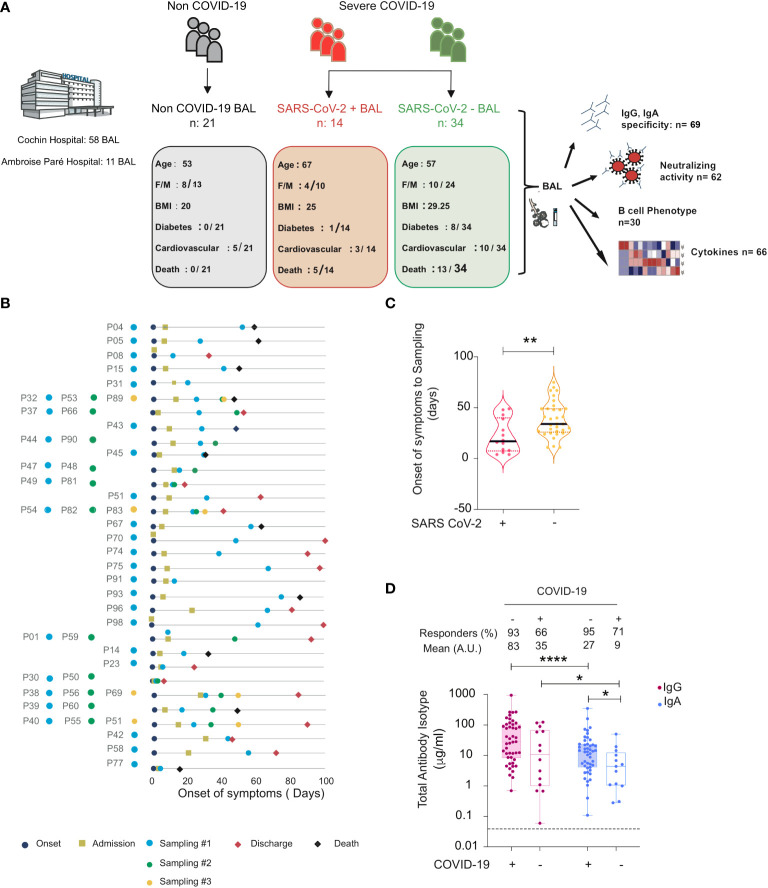
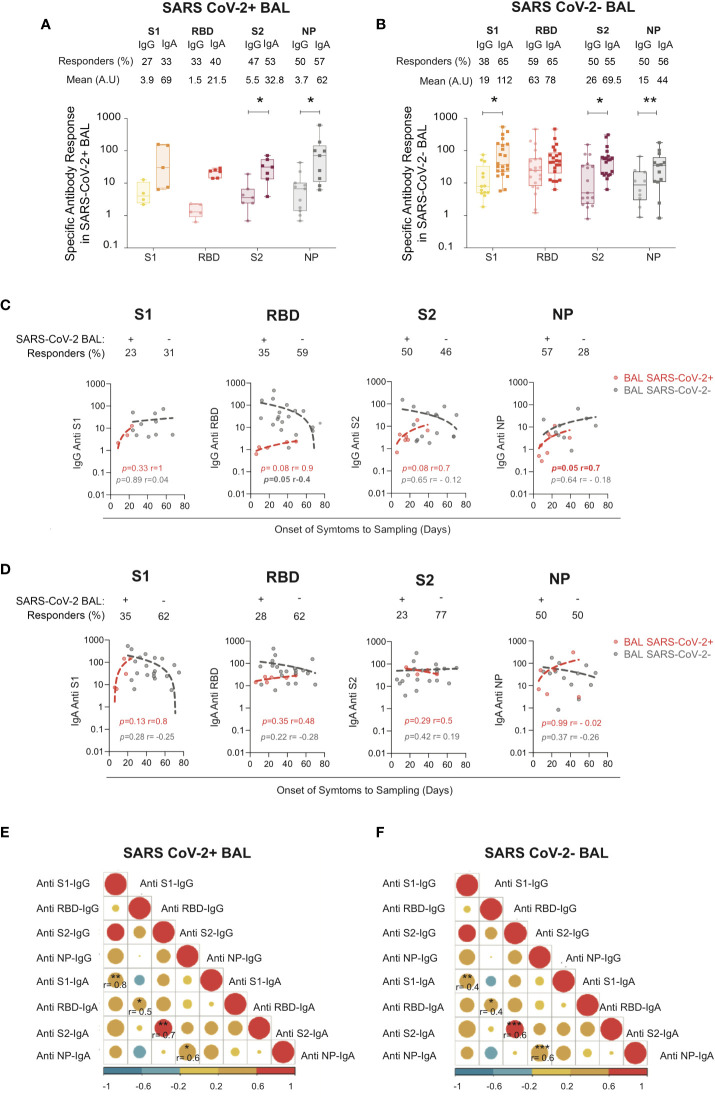
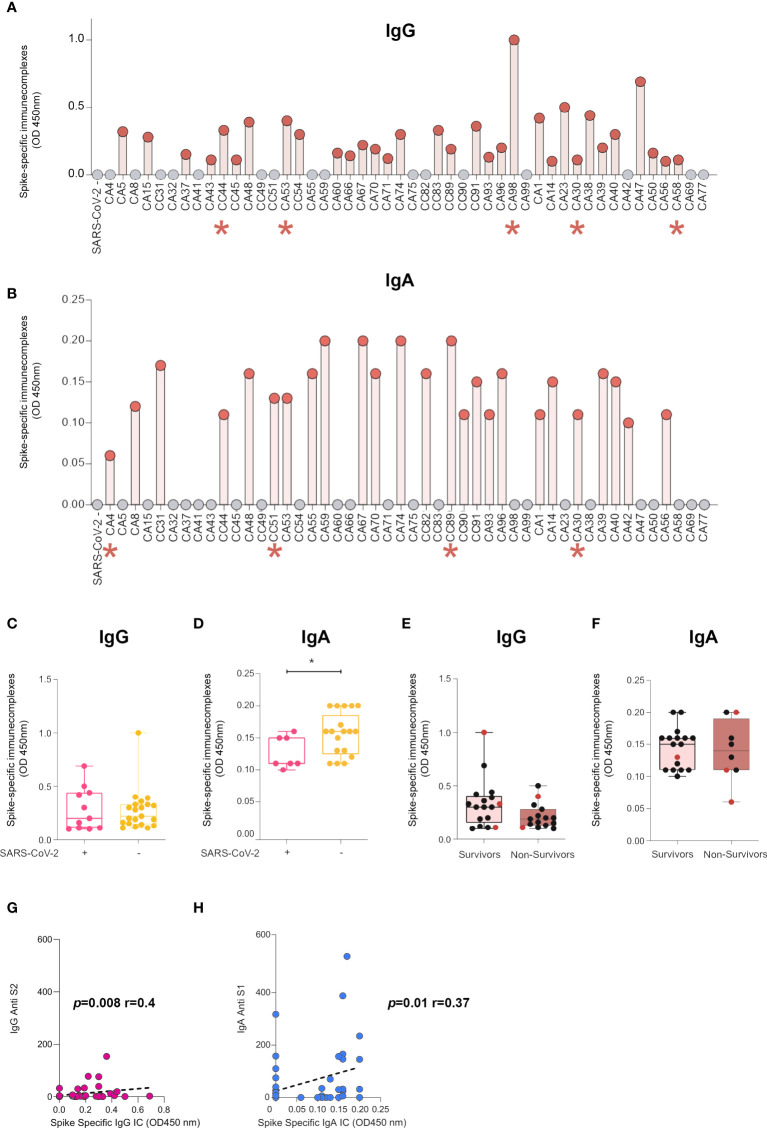
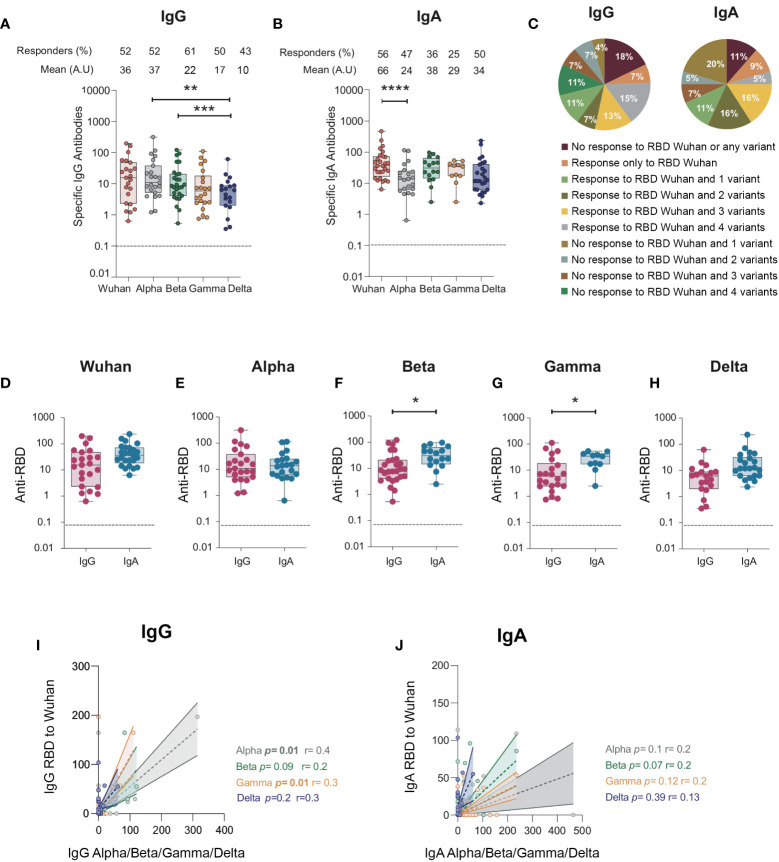
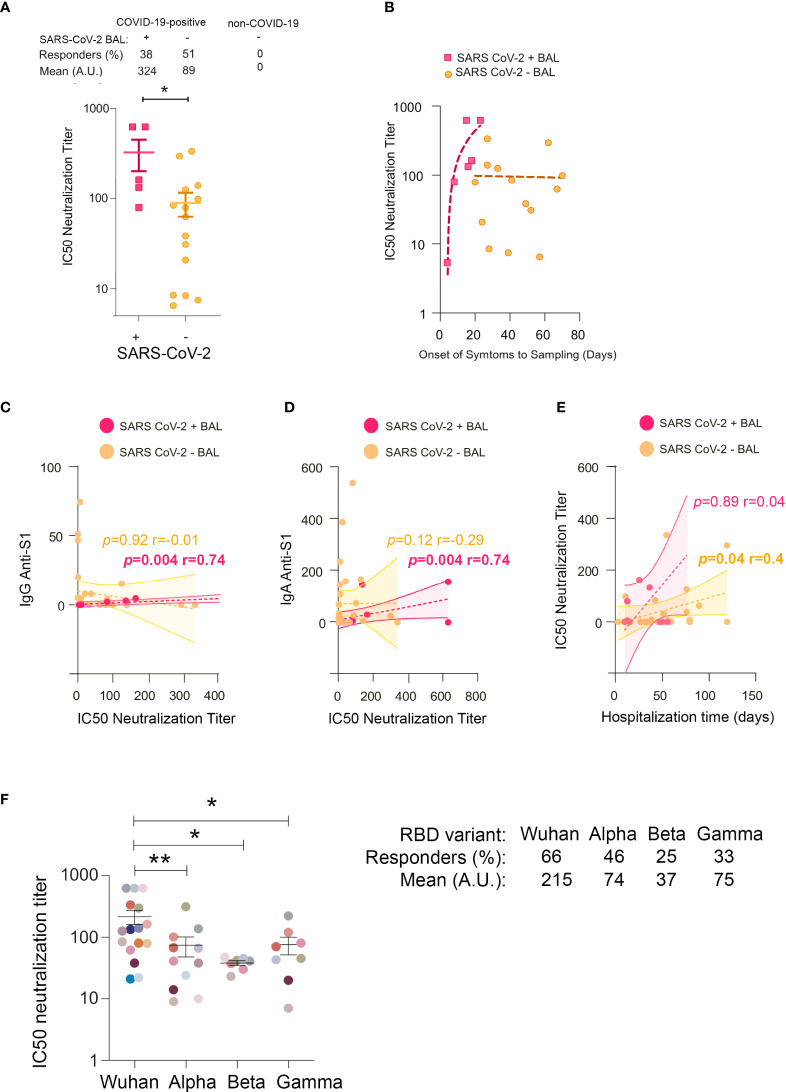
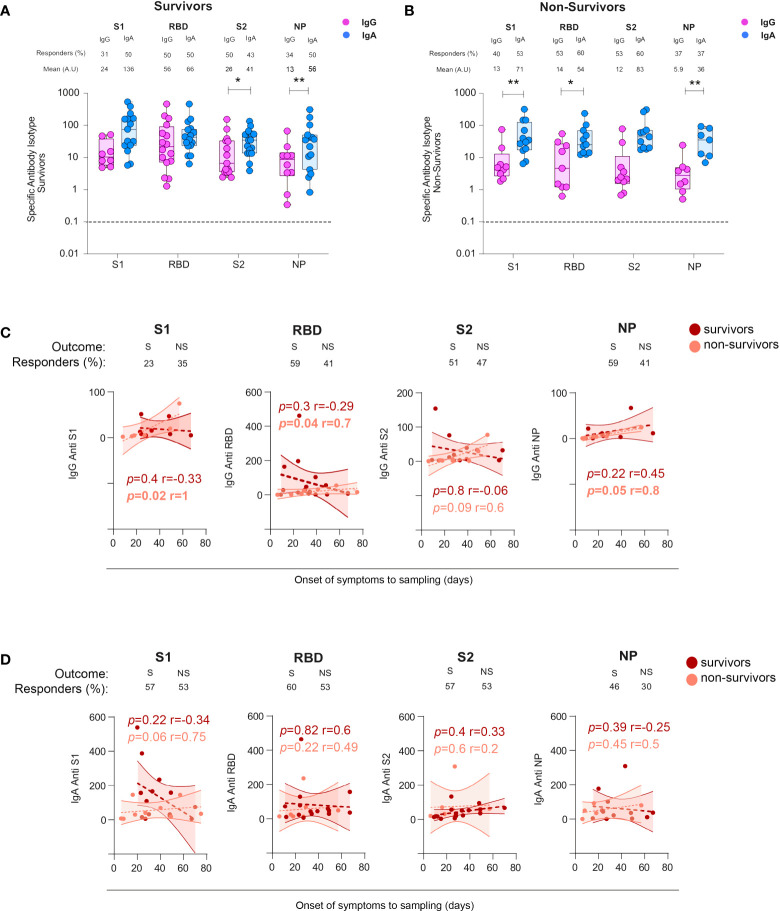
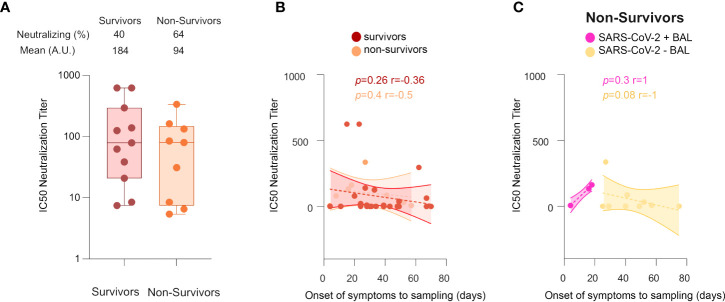
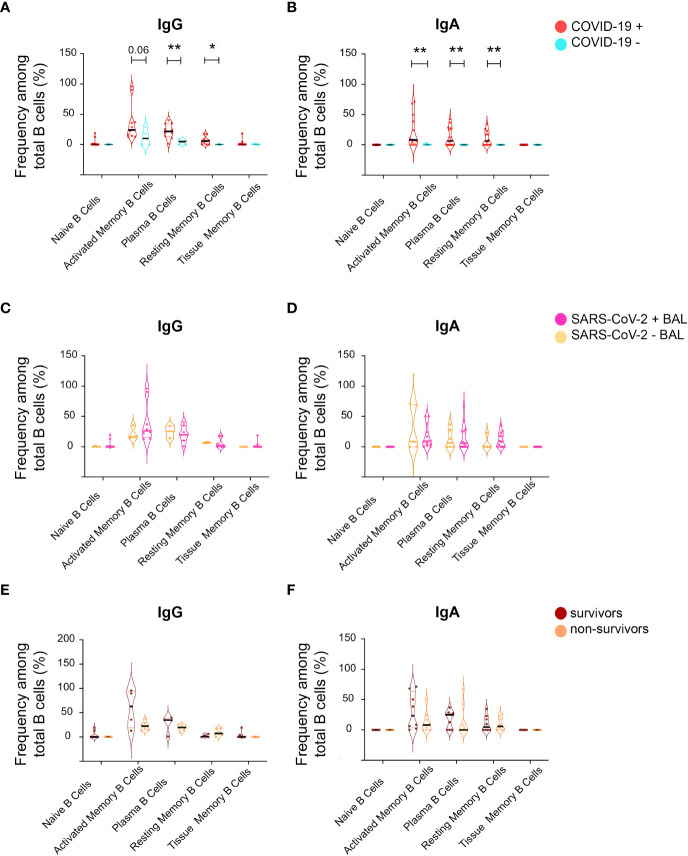
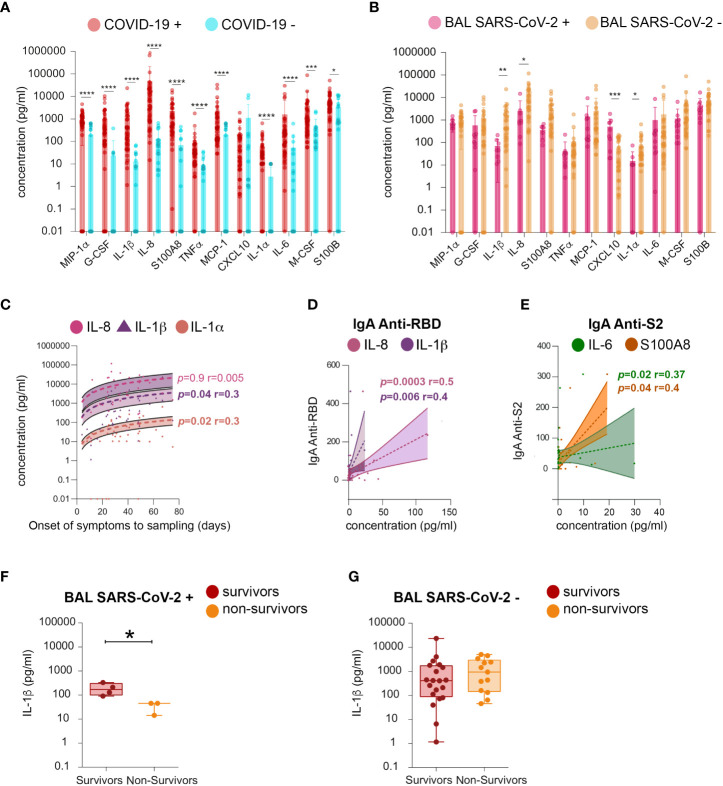
The role of the mucosal pulmonary antibody response in coronavirus disease 2019 (COVID-19) outcome remains unclear. Here, we found that in bronchoalveolar lavage (BAL) samples from 48 patients with severe COVID-19-infected with the ancestral Wuhan virus, mucosal IgG and IgA specific for S1, receptor-binding domain (RBD), S2, and nucleocapsid protein (NP) emerged in BAL containing viruses early in infection and persist after virus elimination, with more IgA than IgG for all antigens tested. Furthermore, spike-IgA and spike-IgG immune complexes were detected in BAL, especially when the lung virus has been cleared. BAL IgG and IgA recognized the four main RBD variants. BAL neutralizing titers were higher early in COVID-19 when virus replicates in the lung than later in infection after viral clearance. Patients with fatal COVID-19, in contrast to survivors, developed higher levels of mucosal spike-specific IgA than IgG but lost neutralizing activities over time and had reduced IL-1β in the lung. Altogether, mucosal spike and NP-specific IgG and S1-specific IgA persisting after lung severe acute respiratory syndrome coronavirus 2 (SARS-CoV-2) clearance and low pulmonary IL-1β correlate with COVID-19 fatal outcome. Thus, mucosal SARS-CoV-2-specific antibodies may have adverse functions in addition to protective neutralization.

Highlights: Mucosal pulmonary antibody response in COVID-19 outcome remains unclear. We show that in severe COVID-19 patients, mucosal pulmonary non-neutralizing SARS-CoV-2 IgA persit after viral clearance in the lung. Furthermore, low lung IL-1β correlate with fatal COVID-19. Altogether, mucosal IgA may exert harmful functions beside protective neutralization.

Keywords: COVID-19; IgA; SARS-CoV-2; inflammatory cytokine; mucosal immunity; severe infection.


Conflict of interest statement

The authors declare that the research was conducted in the absence of any commercial or financial relationships that could be construed as a potential conflict of interest.

Figures

Figure 1
Figure 1
Total and specific IgG and IgA in BAL from SARS-CoV-2-infected and non-infected individuals. (A) Graphical representation showing the overall study design and the characteristics (number, age, body mass index (BMI), sex (F = female, M = male), diabetes, and fatality rates) of the individuals included in the study. Illustration with images from Servier Medical Art, licensed under the Creative Commons Attribution 3.0 Unported License. (B) Timeline of the course of disease for enrolled patients infected with SARS-CoV-2. (C) SARS-CoV-2 containing (SARS-CoV-2+) samples correspond to the early phase, whereas those lacking virus (SARS-CoV-2−) correspond to a late phase of the disease. Violin plots of time from onset of symptoms to sampling for each sample in SARS-CoV-2+ and SARS-CoV-2− BAL. p-Values were calculated by using Mann–Whitney test. (D) Comparison between values of total IgG and IgA (μg/ml) in BAL from SARS-CoV-2-infected individuals (SARS-CoV-2+ and SARS-CoV-2− BAL) and COVID-19 non-infected individuals. p-Values were calculated by using Wilcoxon test: *, p < 0.05; **, p < 0.01; ****, p < 0.0001. Dashed line: cutoff value for antibody detection. Negative values are not shown. BAL for bronchoalveolar lavage.
Figure 2
Figure 2
S1-, RBD-, S2-, and NP-specific IgG and IgA in SARS CoV-2+ vs SARS-CoV-2− BAL. (A) S1-, S2-, RBD-, and NP-specific IgG and IgA responses in SARS-CoV-2+ BAL (B) S1-, S2-, RBD-, and NP-specific IgG and IgA responses in SARS-CoV-2− BAL. (A, B) Proportion of specific IgG or IgA over total IgG or IgA measured by ELISA. Specific (OD450)/total IgA or G (μg/ml) are shown. p-Values were calculated by using Mann–Whitney test: *, p < 0.05; **, p < 0.01; ***, p < 0.005. (C) Correlations between specific S1-, RBD-, S2-, and NP-specific IgG antibodies in SARS-CoV-2+ BAL (red dots) and SARS-CoV-2− BAL (gray dots) and onset of symptom to sampling date (days). (D) Correlations between S1-, RBD-, S2-, and NP-specific IgA antibodies SARS-CoV-2+ BAL (red dots) and SARS-CoV-2− BAL (gray dots) and onset of symptom to sampling date (days). (E) Correlation between specific S1, RBD, S2, and NP IgA and IgG antibodies in SARS-CoV-2+ BAL individuals. (F) Correlation between S1-, RBD-, S2-, and NP-specific IgA and IgG in SARS-CoV-2− BAL individuals. All correlations were calculated using Spearman’s test. RBD, receptor-binding domain; NP, nucleocapsid protein.
Figure 3
Figure 3
BAL from SARS-CoV-2-infected individuals contain IgG- and IgA-spike immune complexes (ICs). (A) Anti-spike IgG ICs were detected in 32 of the 48 samples analyzed by ELISA. Indicated with a red asterisk are individuals who had undetectable levels of IgG anti-spike/NP antibodies. (B) Anti-spike IgA ICs were detected in 25 of the 48 samples analyzed by ELISA. Indicated with red asterisk are individuals who had undetectable levels of IgA anti-spike/NP antibodies. (C, D) Comparison of presence of ICs made of spike with IgG (c) or IgA (D) in SARS-CoV-2+ BAL individuals and SARS-CoV-2− BAL subjects. p-Values were calculated by using Mann–Whitney test: *, p < 0.05. (E, F) Comparison of presence of ICs made of spike with IgG (E) or IgA (F) in survivors vs non-survivors. (G, H) Correlation between specific S1 and levels of ICs made of spike with IgG (G) or IgA (H). Correlations were calculated using Spearman’s test. BAL, bronchoalveolar lavage; NP, nucleocapsid protein.
Figure 4
Figure 4
IgG and IgA antibodies from BAL from SARS-CoV-2-infected individuals against RBD protein from SARS-CoV-2 Alpha (B.1.1.7), Beta (B.1.351), Gamma (P.1), and Delta (B.1.617) variants. (A) Specific IgG responses against Alpha, Beta, Gamma, and Delta RBD in BAL from SARS-CoV-2-infected individuals. (B) Specific IgA responses against Alpha, Beta, Gamma, and Delta RBD in BAL from SARS-CoV-2-infected individuals. (A, B) Proportion of specific IgG or IgA over total IgG or IgA measured by ELISA (specific (OD450)/total IgA or G (μg/ml)) are shown. (C) Pie charts showing the percentages of the different responses of IgG (left) and IgA (right) to Wuhan RBD and the different variants. (D–H) Comparison between specific IgG and IgA responses detected against the RBD from ancestral Wuhan strain (D), Alpha (E), Beta (F), and Gamma (G)and Delta (H) variants. Correlation between IgG (I) and IgA (J) specific to Wuhan RBD and IgG and IgA antibodies specific for Alpha, Beta and Gamma variants. Correlations were calculated using Spearman’s test. p-Values were calculated by using Wilcoxon test. *, p < 0.05; **, p < 0.01; ***, p < 0.005, ****, p < 0.0001. Dashed line: cutoff value for antibody detection. BAL, bronchoalveolar lavage; RBD, receptor-binding domain.
Figure 5
Figure 5
IC50 neutralization titers in BAL from COVID-19 individuals. (A) Comparison of IC50 neutralization titers between SARS-CoV-2+ BAL and SARS-CoV-2− BAL samples. (B) Correlations between IC50 neutralization titers and the onset of symptoms to sampling date in SARS-CoV-2+ BAL (light blue squares) and SARS-CoV-2− BAL (purple dots) individuals. (C) Correlation between IC50 neutralization titers and spike-specific IgG in SARS-CoV-2+ and SARS-CoV-2− BAL. (D) Correlation between IC50 neutralization titers and spike-specific IgA in SARS-CoV-2+ and SARS-CoV-2− BAL. (E) Correlation between neutralization activity and hospitalization time in SARS-CoV-2+ and SARS-CoV-2− BAL. (F) IC50 neutralization titers of BAL from SARS-CoV-2+ individuals against ancestral Wuhan, and Alpha, Beta, and Gamma SARS-CoV-2 variants. A specific color is associated with each individual. All correlations were calculated using Spearman’s test. p-Values were calculated by using Mann–Whitney test. *, p < 0.05; **, p < 0.01. BAL, bronchoalveolar lavage.
Figure 6
Figure 6
Specific IgG and IgA responses in COVID-19+ survivors vs non-survivors. (A) Specific S1-, S2-, RBD-, and NP-specific IgG and IgA responses in survivors and non-survivors. p-Values were calculated by using Wilcoxon test (A, B) Dashed line: cutoff value for antibody detection. (C) Comparison of the kinetics from the cross-sectional SARS-CoV-2-specific IgG responses in survivors (S) versus non-survivors (NS). (D) Comparison of the kinetics from the cross-sectional SARS-CoV-2-specific IgA responses in survivors (S) versus non-survivors (NS). All correlations were calculated using Spearman’s test. *, p < 0.05; **, p < 0.01. RBD, receptor-binding domain; NP, nucleocapsid protein.
Figure 7
Figure 7
Neutralization activities in COVID-19+ survivors vs non-survivors. (A) Comparison between IC50 neutralization titers between survivors and non-survivors. (B) Cross-sectional representation of neutralizing antibodies in survivors vs non-survivors, shown as correlation between IC50 neutralization titters and time from symptom onset to sampling date in survivors and non-survivors. (C) Cross-sectional representation of neutralizing antibodies in non-survivors, shown as correlation between IC50 neutralization titters and time from symptom onset to sampling date, in SARS-CoV-2+ BAL and SARS-CoV-2− BAL individuals. All correlations were calculated using Spearman’s test. p-Values were calculated by using Wilcoxon test. BAL: bronchoalveolar lavage.
Figure 8
Figure 8
Analysis of B-cell phenotype in BAL supernatant from SARS-CoV-2-infected individuals. From total B cells, five B-cell populations were defined including Naïve B cells, activated memory B cells, plasma B cells, resting memory B cells, and tissue memory B cells according to a gating strategy shown in Supplementary Figure 1 , which were further labeled for IgG (IgG+) and IgA (IgA+). (A) Frequencies of different IgG+ B-cell populations between COVID-19+ and COVID-19− individuals in the total B-cell population shown as violin plots. (B) Frequencies of different IgA+ B-cell populations between COVID-19+ and COVID-19− individuals in the total IgA+ B-cell population shown as violin plots. (C) Frequencies of different IgG+ B-cell populations between SARS CoV-2+ BAL and SARS CoV-2− BAL individuals in the total IgG+ B-cell population shown as violin plots. (D) Frequencies of different IgA+ B-cell populations between SARS CoV-2+ BAL and SARS CoV-2− BAL individuals in the total IgA+ B-cell population shown as violin plots. (E) Frequencies of different IgG+ B-cell populations between survivors and non-survivors in the total IgG+ B-cell population shown as violin plots. (F) Comparison of different IgA+ B-cell populations between survivors and non-survivors in the total IgA+ B-cell population shown as violin plots. p-Values were calculated by using Mann–Whitney test *, p < 0.05; **, p < 0.01.
Figure 9
Figure 9
Analysis of cytokines in BAL fluid. Quantification of the following cytokines in BAL from SARS-CoV-2-infected individuals: MIP-1α, G-CSF, IL-1β (IL-1β), IL-8, S100A8, TNF-a, MCP-1, CXCL10, IL-1α (IL-1A), IL-6, M-CSF, and S100B. (A) Mean amounts of cytokines (pg/ml) evaluated between COVID-19+ and COVID-19− individuals. (B) Mean amounts of cytokines (pg/ml) evaluated between BAL SARS CoV-2+ and BAL SARS CoV-2− individuals. (C) Cross-sectional concentration (pg/ml) of IL-8, IL-1β, and IL-1A as function of time from onset of symptoms to sampling date. (D) Correlation between RBD-specific IgA (shown as proportion of specific IgG or IgA over total IgG or IgA measured by ELISA (specific (OD450)/total IgA or G (μg/ml)) and IL-1β and IL-8 concentration (pg/ml). (E) Correlation between S2-specific IgA (shown as proportion of specific IgG or IgA over total IgG or IgA measured by ELISA (specific (OD450)/total IgA or G (μg/ml)) and S100A8 and IL-6 concentration. (F) Comparison of the levels of IL-1β (pg/ml) between survivors and non-survivors in SARS-CoV-2+ BAL individuals. (G) Comparison of the levels of IL-1β (pg/ml) between survivors and non-survivors in individuals BAL SARS-CoV-2−. p-Values were calculated by using Mann–Whitney test. *, p < 0.05, **, p < 0.01; ***, p < 0.005, ****, p < 0.0001. BAL, bronchoalveolar lavage; G-CSF, granulocyte colony-stimulating factor; RBD, receptor-binding domain.

Similar articles

Cited by

References

    1. Coronaviridae Study Group of the International Committee on Taxonomy of V . The species severe acute respiratory syndrome-related coronavirus: Classifying 2019-ncov and naming it sars-Cov-2. Nat Microbiol (2020) 5(4):536–44. doi: 10.1038/s41564-020-0695-z - DOI - PMC - PubMed
    1. Guo YR, Cao QD, Hong ZS, Tan YY, Chen SD, Jin HJ, et al. . The origin, transmission and clinical therapies on coronavirus disease 2019 (Covid-19) outbreak - an update on the status. Mil Med Res (2020) 7(1):11. doi: 10.1186/s40779-020-00240-0 - DOI - PMC - PubMed
    1. Wu F, Wang Aojie , Liu Mei , Wang Qimin , Chen J, Xia S, et al. . Neutralizing antibody responses to sars-Cov-2 in a covid-19 recovered patient cohort and their implications. MedRxiv (2020). doi: 10.1101/2020.03.30.20047365 - DOI
    1. Hoffmann M K-WH, Schroeder S, Kruger N, Herrler T, Erichsen S, Schiergens TS, et al. . Sars-Cov-2 cell entry depends on Ace2 and Tmprss2 and is blocked by a clinically proven protease inhibitor. Cell (2020) 181:271–280.e8. doi: 10.1016/j.cell.2020.02.052 - DOI - PMC - PubMed
    1. Burkard C, Verheije MH, Wicht O, van Kasteren SI, van Kuppeveld FJ, Haagmans BL, et al. . Coronavirus cell entry occurs through the endo-/Lysosomal pathway in a proteolysis-dependent manner. PloS Pathog (2014) 10(11):e1004502. doi: 10.1371/journal.ppat.1004502 - DOI - PMC - PubMed

Publication types