Meta-Analysis
. 2022 Sep 29:13:976512.
doi: 10.3389/fimmu.2022.976512. eCollection 2022.

Single cell meta-analysis of EndMT and EMT state in COVID-19

Affiliations
Meta-Analysis

Single cell meta-analysis of EndMT and EMT state in COVID-19

Lanlan Zhang et al. Front Immunol. .

Abstract

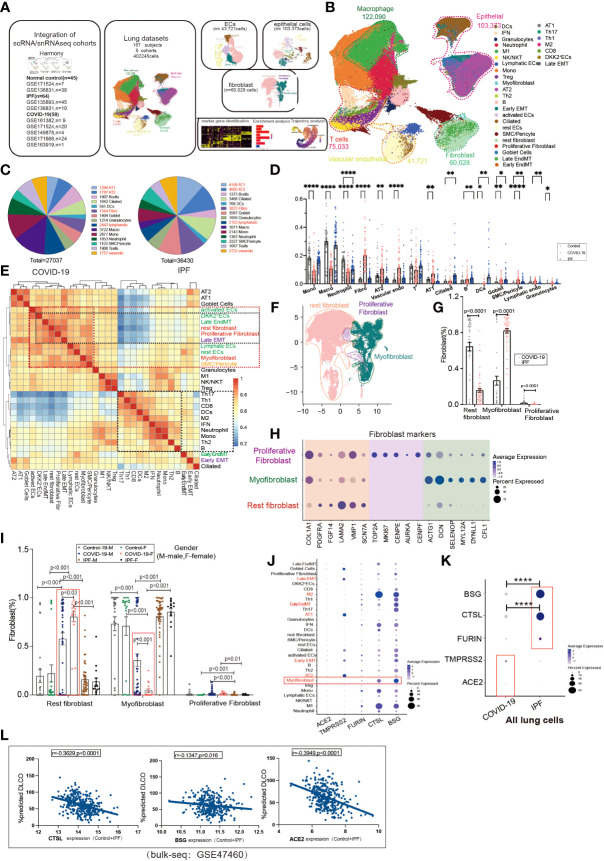
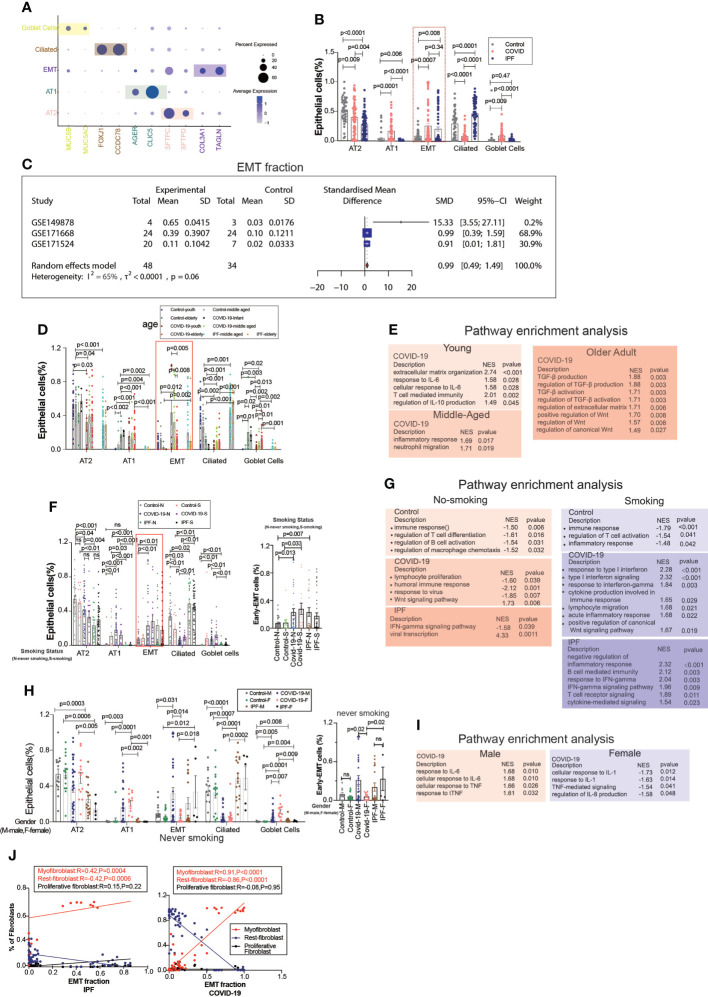
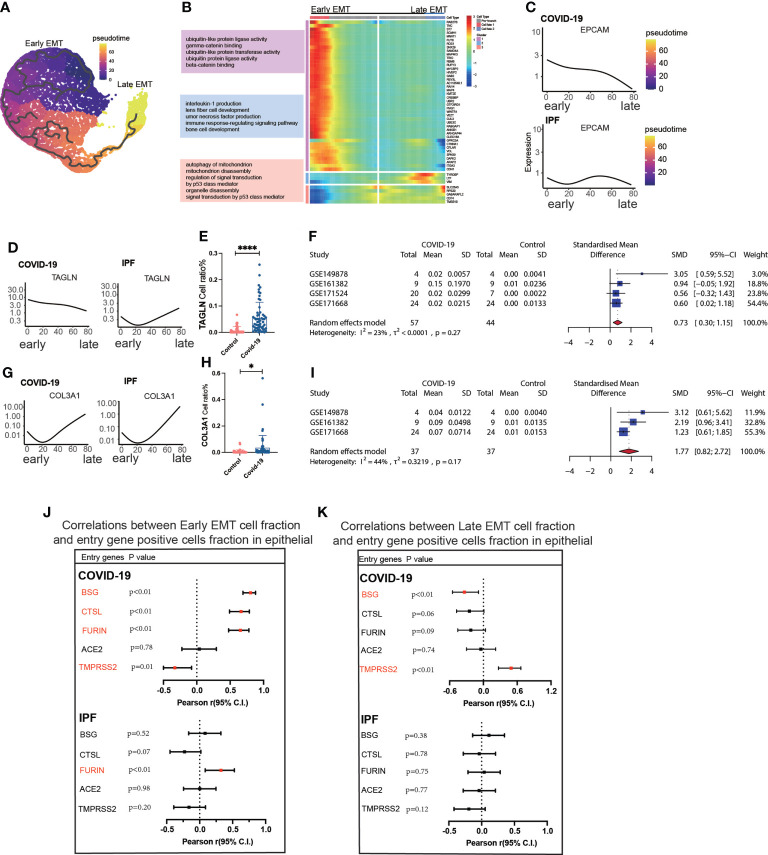
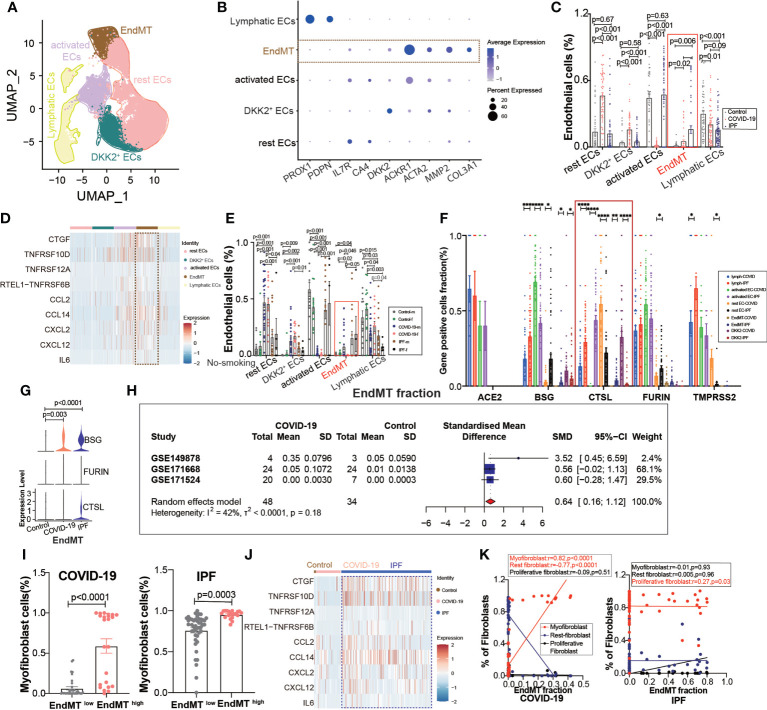
COVID-19 prognoses suggests that a proportion of patients develop fibrosis, but there is no evidence to indicate whether patients have progression of mesenchymal transition (MT) in the lungs. The role of MT during the COVID-19 pandemic remains poorly understood. Using single-cell RNA sequencing, we profiled the transcriptomes of cells from the lungs of healthy individuals (n = 45), COVID-19 patients (n = 58), and idiopathic pulmonary fibrosis (IPF) patients (n = 64) human lungs to map the entire MT change. This analysis enabled us to map all high-resolution matrix-producing cells and identify distinct subpopulations of endothelial cells (ECs) and epithelial cells as the primary cellular sources of MT clusters during COVID-19. For the first time, we have identied early and late subgroups of endothelial mesenchymal transition (EndMT) and epithelial-mesenchymal transition (EMT) using analysis of public databases for single-cell sequencing. We assessed epithelial subgroups by age, smoking status, and gender, and the data suggest that the proportional changes in EMT in COVID-19 are statistically significant. Further enumeration of early and late EMT suggests a correlation between invasive genes and COVID-19. Finally, EndMT is upregulated in COVID-19 patients and enriched for more inflammatory cytokines. Further, by classifying EndMT as early or late stages, we found that early EndMT was positively correlated with entry factors but this was not true for late EndMT. Exploring the MT state of may help to mitigate the fibrosis impact of SARS-CoV-2 infection.

Keywords: COVID-19; endothelial cells (ECs); endothelial-mesenchymal transition (EndMT); epithelial-mesenchymal transition (EMT); single cell RNA sequencing.


Conflict of interest statement

Author MZ is employed by the Oncology Bussiness Department, Novogene Co., Ltd, Beijing, China. The remaining authors declare that the research was conducted in the absence of any commercial or financial relationships that could be construed as a potential conflict of interest.

Figures

Figure 1
Figure 1
Subpopulation correlation analysis suggested a strong correlation between MT subpopulation and fibroblast subpopulation. (A) Scheme of this study. (B) Demonstration of HC, COVID-19, and IPF subgroups using UMAP, including Endothelial (vascular endothelial: rest ECs, EndMT, DKK2+ ECs, activated ECs; Lymphatic ECs); Epithelial (AT2, AT1, Goblet Cell, EMT, Ciliated); Fibroblast (Proliferative Fibroblast, Myofibroblast, Rest fibroblast, Late EndMT, Late EMT); SMC/Pericyte; T cells (Th1, Th17, Th2, Treg, NK/NKT, CD8, IFN); Macrophage (M2, M1); Granulocytes; DCs; Mono; Neutrophil. And the proportion of cell subpopulations in HC, COVID-19, IPF. Marker genes: Endothelial cells:PECAM1, VWF, CLDN5; Macrophages: MARCO, MSR1, MRC1;T cells:CD3E, CD3D, GZMH; Granulocytes:MS4A2, CPA3, TPSAB1; B cells:MS4A1, BANK1, CD79A;Monocytes:CD14, FCN1; Neutrophil:S100A8, S100A9; Epithelial cells:EPCAM; Fibroblast:COL1A1, PDGFRA, ELN;SMC:SCGB1A1, RPL26). (C) Pie charts show the number of differentially expressed genes per cell type in COVID-19/IPF compared to controls. The DEGs of COVID-19 were mainly concentrated in macrophages and monocytes, and the DEGs of IPF were mainly concentrated in epithelium. (D) The proportion of cell subpopulations in HC, COVID-19, IPF. (E) The heat-map shows the correlation analysis for each cell subpopulation. The correlation between late-stage EMT, late-stage EndMT and fibroblast subpopulation was higher. (F) UMAP suggests a subpopulation distribution of fibroblasts, including Myofibroblas,Proliferative fibroblas and Rest fibroblast. (G) Ratio of fibroblast subpopulations in patients with COVID-19, IPF, showing myofibroblast ratio in IPF is higher than that in COVID-19, but Rest fibroblast ratio in IPF is lower than that in COVID-19. (H) Markers of fibroblast subpopulations, including Myofibroblast (ACTG1, DCN, SELENOP, MYL12A, DYNLL1, CFL1), Proliferative fibroblast (TOP2A, MKI67, CENPE, AUPKA, CENPF) and Rest fibroblast (COL1A1, PDGFRA, FGF14, LAMA2, VMP1, SCN7A). (I) The proportion of fibroblast subpopulations in COVID-19, IPF by female and male, showing Myofibroblast ratio in females is lower than that in males with COVID-19. (J) The DOT plot shows the expression of entry factors in subgroups of control, COVID-19, IPF. Subgroups including Rest fibroblast, Myofibroblast, Proliferative Fibroblast, Late EndMT, Late EMT, SMC/Pericyte; rest ECs, DKK2+ ECs, activated ECs, Lymphatic ECs, EndMT-early; AT1, AT2, Ciliated, Early EMT, Goblet Cell; Granulocytes; B, Th2, Th1, Th17, Treg, CD8, Mono, M1, M2, Neutrophil, DCs, NK/NKT. (K) The DOT plot shows the expression of entry factors in COVID-19, IPF. (L) Correlation analysis of entry factors (CTSL, BSG, ACE2) and lung function test (%predicted DLCO) showed that lung function was negatively correlated with the normalized bulk RNA-seq gene expression of the entry factors. *P < 0.05, **P < 0.01,**** P< 0.0001.
Figure 2
Figure 2
EMT by age, smoking status, and gender. (A) Dot chart shows the marker of epithelial subpopulations, including AT1(AGER, CLIC5), AT2(SFTPC, SFTPD), Ciliated (FOXJ1, CCDC78), Goblet cells (MUC5B, MUC5AC), EMT(TAGLN, COL3A1). (B) Comparison of the ratios of HC, COVID-19, IPF subpopulations of epithelium. EMT proportion was significantly upregulated in COVID-19 and IPF. (C) Forest plot of studies with EMT ratio on the COVID-19 and HC, after excluding a study with only one case and a high heterogeneity study. The analysis included data from 3 studies with a total of 48 COVID-19 and 34 controls. p value for heterogeneity was 0.06, I2 was 65%. (SD, Standard deviation). (D) Comparison of the ratios of HC, COVID-19, IPF subpopulations of epithelium by age. (E) GO (Gene ontology) enrichment analysis was performed on the genes highly expressed in EMT in normal control, COVID-19 and IPF groups in patients of different ages, respectively, and the graphs show the signaling pathways enriched to EMT cell populations in different groups. (F) Comparison of the ratios of HC, COVID-19, IPF subpopulations of epithelium by smoking. (G) GO enrichment analysis was performed to enrich for genes that were highly expressed in EMT of smoking and non-smoking patients in normal control, COVID-19 and IPF groups, respectively, and the graphs show the signaling pathways enriched in EMT cell populations of different groups. (H) Comparison of the ratios of HC, COVID-19, IPF subpopulations of epithelium by sex. (I) GO enrichment analysis of the genes highly expressed in EMT in normal control, COVID-19 and IPF groups by sex, respectively. (J) Correlation analysis of EMT with myofibroblast, rest fibroblast and proliferative fibroblast in COVID-19 and IPF patients (Pearson test), showing EMT is positively correlated with myofibroblasts.
Figure 3
Figure 3
Characteristics of early late-stage EMT. (A) Pseudotime projection analysis showing early-stage EMT could evolve to late-stage EMT. (B) Single cell proposed time branch point analysis showing genes with progressively lower and higher expression from Early EMT to Late EMT. Each row of the heat map on the right represents a gene, each column is a proposed time point, and the color represents the average expression value of the gene at the current time point, with the color decreasing from red to blue. The left side shows the signaling pathways that the gene set is enriched. (C) Proposed time traces of individual genes, showing the change in gene expression from the beginning to the end of the proposed time course for epithelial cell marker genes (EPCAM) in COVID-19 and IPF patients, respectively. (D) Time-sensitive trajectories of individual genes, showing the change of Early EMT marker gene (TAGLN) expression from the beginning to the end of the proposed time course in COVID-19 and IPF patients, respectively. (E) TAGLN gene positive epithelial cell ratio is higher in COVID-19 than that in HC. (F) Forest plot of studies with TAGLN gene positive epithelial cell ratio on the COVID-19 and HC, after excluding a study with only one case. the analysis included data from 4 studies with a total of 57 COVID-19 and 44 controls. p value for heterogeneity was 0.27, I2 was 23%.(G) Temporal trajectories of individual genes, showing changes in gene expression of Late EMT marker gene (COL3A1) in COVID-19 and IPF patients by the start to the end of the proposed time course, respectively. (H) COL3A1 gene positive epithelial cell ratio is higher in COVID-19 than that in HC. (I) Forest plot of studies with COL3A1 gene positive epithelial ratio on the COVID-19 and HC, after excluding a study with only one case and a high heterogeneity study. The analysis included data from 3 studies with a total of 37 COVID-19 and37 controls. p value for heterogeneity was 0.17, I2 was 44%. (J) Forest plot showing the correlation between Early EMT cell fraction and entry gene positive cells fraction in epithelial cells. And entry factors (BSG, FURIN, CTSL) were positively correlated with the expression of Early EMT in COVID-19 (p < 0.05, Pearson’s r > 0). TMPRSS2 was negatively correlated with the expression of Early EMT in COVID-19 (p < 0.05, Pearson’s r < 0). FURIN was positively correlated with the expression of Early EMT in IPF (p < 0.05, Pearson’s r > 0). (K) Forest plot showing the correlation between Late EMT cell fraction and entry gene positive cells fraction in epithelial cells. And entry factor (TMPRSS2) was positively correlated with the expression of Late EMT in COVID-19 (p < 0.05, Pearson’s r > 0). BSG was negatively correlated with the expression of Late EMT in COVID-19 (p < 0.05, Pearson’s r < 0) *P < 0.05,**** P< 0.0001.
Figure 4
Figure 4
EndMT proportion is upregulated in COVID-19. (A) The expression of pulmonary ECs in patients with health control, COVID-19, IPF was demonstrated using UMAP plots with subpopulations marked by a color code. ECs subpopulations including rest ECs, EndMT, DKK2 + ECs, activated ECs; Lymphatic ECs. (B) Dot chart shows the marker of EndMT, mainly focusing on ACTA2, MMP2, COL3A1; rest ECs (IL7R, CA4), DKK2 + ECs (DKK2), activated ECs (ACKR1); Lymphatic ECs(PROX1,PDPN). (C) Proportion of ECs among normal control group, COVID-19 group and IPF group, the ratio of EndMT was increased in COVID-19 and IPF than controls. One-way ANOVA was used to compare multiple groups (p<0.05). (D) Heatmap shows a comparison of the expression of major cytokines in the cell subpopulations of ECs shows that EndMT is enriched in more cytokines compared to the other groups. (E) Comparison of the ratios of HC, COVID-19, IPF subpopulations of ECs by gender in nonsmokers. EndMT ratio in females is lower than that in males with COVID-19. (F) Comparison of entry factors (ACE2, BSG, FURIN, CTSL, TMPRSS2) positive cell fraction in ECs subtype of COVID-19 and IPF. (G) Comparison of EndMT proportion of entry factors (BSG, FURIN, CTSL) in HC, COVID-19, IPF. (H) Forest plot of studies with lung scRNA data on the COVID-19, after excluding a study with only one case and a high heterogeneity study. The analysis included data from 3 studies with a total of 48 COVID-19 and 34 controls. p value for heterogeneity was 0.18, I2 was 42%. (SD: Standard deviation). (I) Ratio of myofibroblasts in COVID-19 and IPF for EndMT low versus EndMT high, showing myofibroblast ratio in EndMT high is higher than that in EndMT low. (J) A comparison of the expression of major cytokines in the EndMT shows that COVID-19 and IPF are enriched in more profibrotic cytokines compared to HC group. (K) Correlation analysis of EndMT with myofibroblast, rest fibroblast and profilerative fibroblast in COVID-19 and IPF patients (Pearson test), showing EndMT is positively correlated with myofibroblasts in COVID-19 patients. *P < 0.05, **P < 0.01, ***P < 0.001,****P < 0.0001.
Figure 5
Figure 5
Characteristics of early and late stage EndMT. (A) Pseudotime projection analysis showing early-stage EndMT could evolve to late-stage EndMT. (B) Single cell proposed time branch point analysis showing genes with progressively lower and higher expression from Early EndMT to Late EndMT. Each row of the heat map on the right represents a gene, each column is a proposed time point, and the color represents the average expression value of the gene at the current time point, with the color decreasing from red to blue. The left side shows the signaling pathways that the gene set is enriched to. (C) The proposed time trajectory of a single gene, showing the change in gene expression of the ECs marker gene (CLDN5) from the beginning to the end of the proposed time course. (D) Trajectories of individual genes, showing changes in gene expression of Early EndMT marker genes (ACTA2) from the beginning to the end of the proposed time course. (E) ACTA2 gene positive ECs ratio is higher in COVID-19 than that in HC. (F) Forest plot of studies with ACTA2 gene positive ECs ratio on the COVID-19 and HC, after excluding a study with only one case. The analysis included data from 4 studies with a total of 57 COVID-19 and 43 controls. p value for heterogeneity was 0.16, I2 was 42%. (G) Temporal trajectories of individual genes showing changes in gene expression of Late EndMT marker gene (MMP2) from the beginning to the end of the proposed time course. (H) MMP2 gene positive ECs ratio is higher in COVID-19 than that in HC. (I) Forest plot of studies with MMP2 gene positive ECs ratio on the COVID-19 and HC, after excluding a study with only one case. The analysis included data from 4 studies with a total of 57 COVID-19 and 43 controls. p value for heterogeneity was 0.89, I2 was 0%. (J) Trajectories of individual genes showing changes in gene expression of the Late EndMT marker gene (COL3A1) from the beginning to the end of the proposed time course. (K) COL3A1 gene positive ECs ratio is higher in COVID-19 than that in HC. (L) Forest plot of studies with COL3A1 gene positive ECs ratio on the COVID-19 and HC, after excluding a study with only one case. The analysis included data from 4 studies with a total of 57 COVID-19 and 43 controls. p value for heterogeneity was 0.19, I2 was 37%. (M) Forest plot showing the correlation between Early EndMT cell fraction and entry gene positive cells fraction in ECs. Entry factors (BSG, FURIN, CTSL) was positively correlated with the expression of Early EndMT in COVID-19 (p < 0.05, Pearson’s r > 0). CTSL was positively correlated with the expression of Early EndMT in IPF (p < 0.05, Pearson’s r > 0). (N) Forest plot showing the correlation between Late EndMT cell fraction and entry gene positive cells fraction in ECs. Entry factors (ACE2) was positively correlated with the expression of Late EndMT in COVID-19 (p < 0.05, Pearson’s r > 0). **P < 0.01, ***P < 0.001; NS, P > 0.05.

Similar articles

Cited by

References

    1. Jacob A, Vedaie M, Roberts DA, Thomas DC, Villacorta-Martin C, Alysandratos KD, et al. . Derivation of self-renewing lung alveolar epithelial type ii cells from human pluripotent stem cells. Nat Protoc (2019) 14(12):3303–32. doi: 10.1038/s41596-019-0220-0 - DOI - PMC - PubMed
    1. Merad M, Martin JC. Pathological inflammation in patients with covid-19: A key role for monocytes and macrophages. Nat Rev Immunol (2020) 20(6):355–62. doi: 10.1038/s41577-020-0331-4 - DOI - PMC - PubMed
    1. Bost P, Giladi A, Liu Y, Bendjelal Y, Xu G, David E, et al. . Host-viral infection maps reveal signatures of severe covid-19 patients. Cell (2020) 181(7):1475–88.e12. doi: 10.1016/j.cell.2020.05.006 - DOI - PMC - PubMed
    1. Kim KK, Kugler MC, Wolters PJ, Robillard L, Galvez MG, Brumwell AN, et al. . Alveolar epithelial cell mesenchymal transition develops in vivo during pulmonary fibrosis and is regulated by the extracellular matrix. Proc Natl Acad Sci United States America (2006) 103(35):13180–5. doi: 10.1073/pnas.0605669103 - DOI - PMC - PubMed
    1. Willis BC, Liebler JM, Luby-Phelps K, Nicholson AG, Crandall ED, Du Bois RM, et al. . Induction of epithelial-mesenchymal transition in alveolar epithelial cells by transforming growth factor-B1: Potential role in idiopathic pulmonary fibrosis. Am J Pathol (2005) 166(5):1321–32. doi: 10.1016/S0002-9440(10)62351-6 - DOI - PMC - PubMed

Publication types