

Innate immune checkpoint inhibitor resistance is associated with melanoma sub-types exhibiting invasive and de-differentiated gene expression signatures
- PMID: 36248850
- PMCID: PMC9554309
- DOI: 10.3389/fimmu.2022.955063
Innate immune checkpoint inhibitor resistance is associated with melanoma sub-types exhibiting invasive and de-differentiated gene expression signatures
Abstract
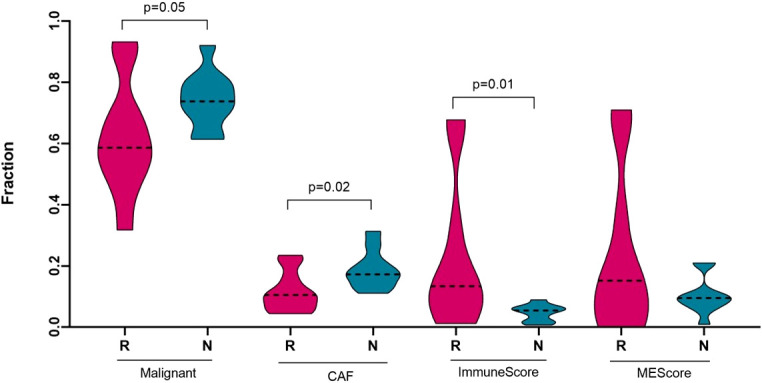
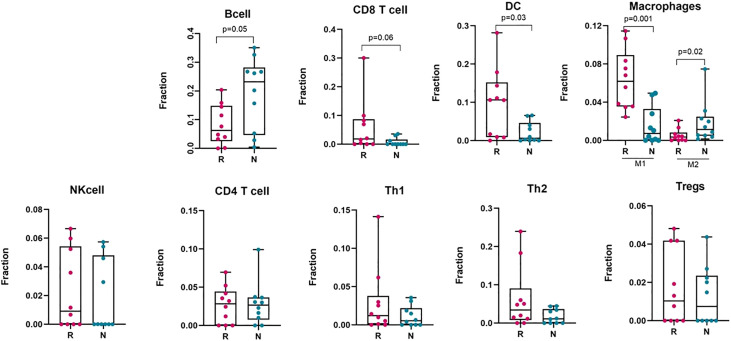
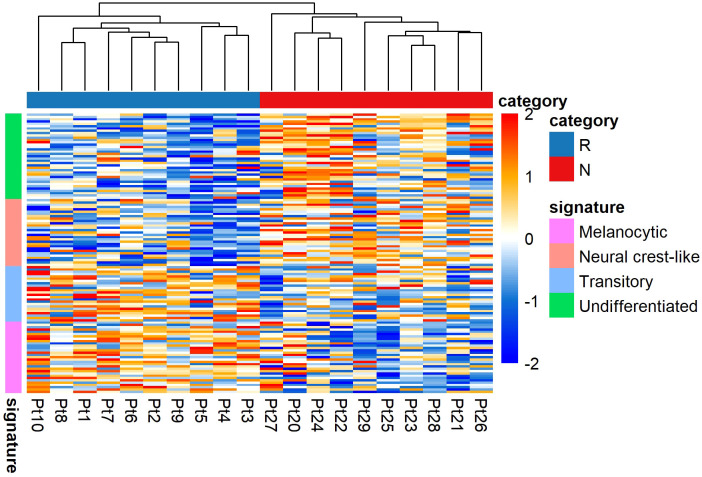
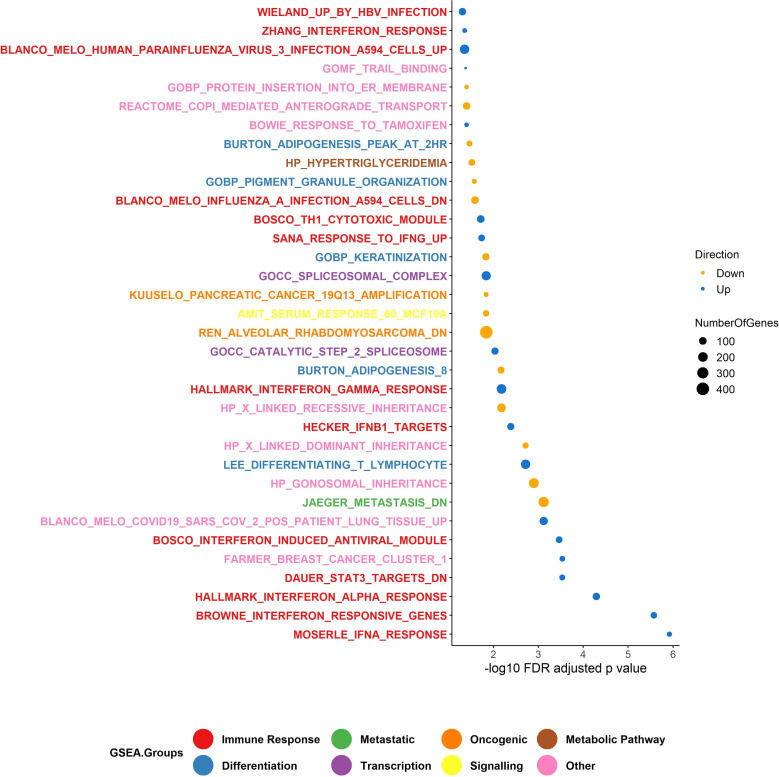
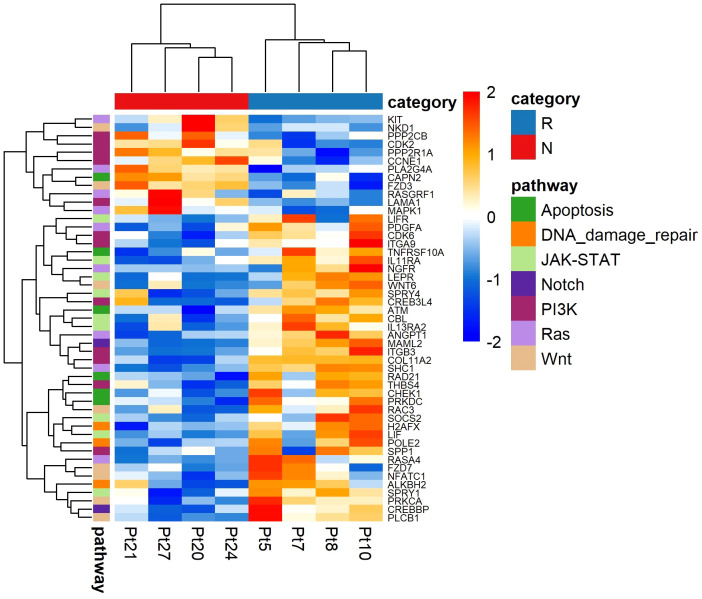
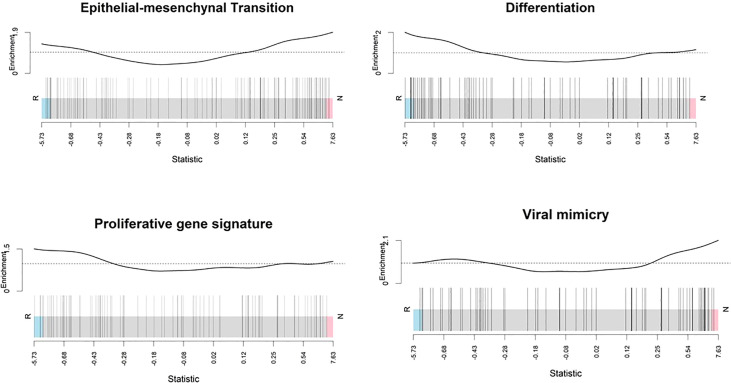
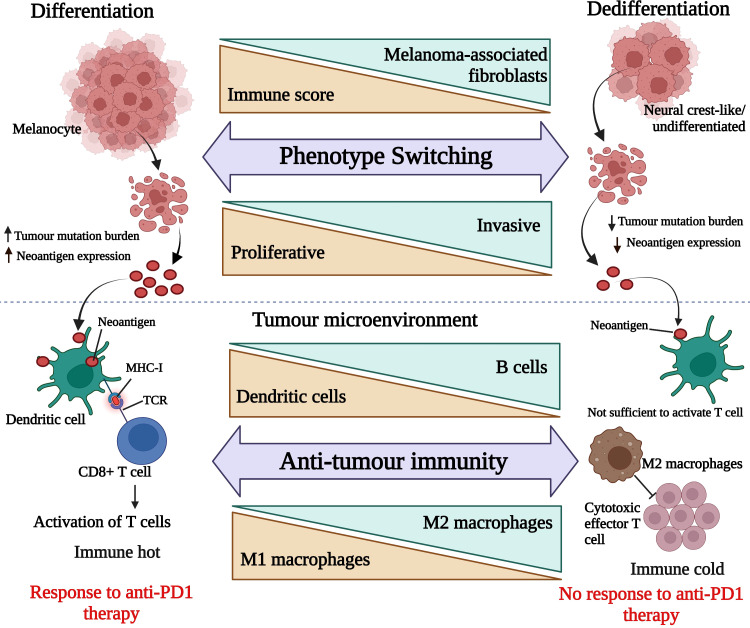
Melanoma is a highly aggressive skin cancer, which, although highly immunogenic, frequently escapes the body's immune defences. Immune checkpoint inhibitors (ICI), such as anti-PD1, anti-PDL1, and anti-CTLA4 antibodies lead to reactivation of immune pathways, promoting rejection of melanoma. However, the benefits of ICI therapy remain limited to a relatively small proportion of patients who do not exhibit ICI resistance. Moreover, the precise mechanisms underlying innate and acquired ICI resistance remain unclear. Here, we have investigated differences in melanoma tissues in responder and non-responder patients to anti-PD1 therapy in terms of tumour and immune cell gene-associated signatures. We performed multi-omics investigations on melanoma tumour tissues, which were collected from patients before starting treatment with anti-PD1 immune checkpoint inhibitors. Patients were subsequently categorized into responders and non-responders to anti-PD1 therapy based on RECIST criteria. Multi-omics analyses included RNA-Seq and NanoString analysis. From RNA-Seq data we carried out HLA phenotyping as well as gene enrichment analysis, pathway enrichment analysis and immune cell deconvolution studies. Consistent with previous studies, our data showed that responders to anti-PD1 therapy had higher immune scores (median immune score for responders = 0.1335, median immune score for non-responders = 0.05426, p-value = 0.01, Mann-Whitney U two-tailed exact test) compared to the non-responders. Responder melanomas were more highly enriched with a combination of CD8+ T cells, dendritic cells (p-value = 0.03) and an M1 subtype of macrophages (p-value = 0.001). In addition, melanomas from responder patients exhibited a more differentiated gene expression pattern, with high proliferative- and low invasive-associated gene expression signatures, whereas tumours from non-responders exhibited high invasive- and frequently neural crest-like cell type gene expression signatures. Our findings suggest that non-responder melanomas to anti-PD1 therapy exhibit a de-differentiated gene expression signature, associated with poorer immune cell infiltration, which establishes a gene expression pattern characteristic of innate resistance to anti-PD1 therapy. Improved understanding of tumour-intrinsic gene expression patterns associated with response to anti-PD1 therapy will help to identify predictive biomarkers of ICI response and may help to identify new targets for anticancer treatment, especially with a capacity to function as adjuvants to improve ICI outcomes.
Keywords: cancer-associated fibroblast; de-differentiation; gene expression signatures; immunotherapy; melanoma; neoantigen; neural crest-like; tumour mutation burden.
Copyright © 2022 Hossain, Gimenez, Stockwell, Tsai, Print, Rys, Cybulska-Stopa, Ratajska, Harazin-Lechowska, Almomani, Jackson, Chatterjee and Eccles.
Conflict of interest statement
The authors declare that the research was conducted in the absence of any commercial or financial relationships that could be construed as a potential conflict of interest.
Figures
Similar articles
-
Pre-treatment DNA methylome and transcriptome profiles correlate with melanoma response to anti-PD1 immunotherapy.Cancer Lett. 2025 May 28;618:217638. doi: 10.1016/j.canlet.2025.217638. Epub 2025 Mar 13. Cancer Lett. 2025. PMID: 40089202
-
Tumor CD155 Expression Is Associated with Resistance to Anti-PD1 Immunotherapy in Metastatic Melanoma.Clin Cancer Res. 2020 Jul 15;26(14):3671-3681. doi: 10.1158/1078-0432.CCR-19-3925. Epub 2020 Apr 28. Clin Cancer Res. 2020. PMID: 32345648
-
Biologic subtypes of melanoma predict survival benefit of combination anti-PD1+anti-CTLA4 immune checkpoint inhibitors versus anti-PD1 monotherapy.J Immunother Cancer. 2021 Jan;9(1):e001642. doi: 10.1136/jitc-2020-001642. J Immunother Cancer. 2021. PMID: 33483342 Free PMC article.
-
Genomic and Epigenomic Biomarkers of Immune Checkpoint Immunotherapy Response in Melanoma: Current and Future Perspectives.Int J Mol Sci. 2024 Jun 30;25(13):7252. doi: 10.3390/ijms25137252. Int J Mol Sci. 2024. PMID: 39000359 Free PMC article. Review.
-
Immune-checkpoint inhibitors in renal transplanted patients affected by melanoma: a systematic review.Immunotherapy. 2022 Jan;14(1):65-75. doi: 10.2217/imt-2021-0195. Epub 2021 Nov 9. Immunotherapy. 2022. PMID: 34751039
Cited by
-
Tunable PhenoCycler imaging of the murine pre-clinical tumour microenvironments.Cell Biosci. 2024 Feb 4;14(1):19. doi: 10.1186/s13578-024-01199-4. Cell Biosci. 2024. PMID: 38311785 Free PMC article.
-
Do BRAF-targeted therapies have a role in the era of immunotherapy?ESMO Open. 2025 Jul;10(7):105314. doi: 10.1016/j.esmoop.2025.105314. Epub 2025 Jun 20. ESMO Open. 2025. PMID: 40543211 Free PMC article. Review.
-
Transitory Schwann Cell Precursor and hybrid states underpin melanoma therapy resistance and metastasis.bioRxiv [Preprint]. 2025 Jul 23:2022.10.14.512297. doi: 10.1101/2022.10.14.512297. bioRxiv. 2025. PMID: 40777322 Free PMC article. Preprint.
-
Immune Checkpoint Inhibitor Therapy for Metastatic Melanoma: What Should We Focus on to Improve the Clinical Outcomes?Int J Mol Sci. 2024 Sep 20;25(18):10120. doi: 10.3390/ijms251810120. Int J Mol Sci. 2024. PMID: 39337605 Free PMC article. Review.
-
A novel patient-derived cutaneous melanoma cell line reveals key features of metastatic melanoma.Front Oncol. 2025 Jul 18;15:1531013. doi: 10.3389/fonc.2025.1531013. eCollection 2025. Front Oncol. 2025. PMID: 40756116 Free PMC article.
References
Publication types
MeSH terms
Substances
LinkOut - more resources
Full Text Sources
Medical
Molecular Biology Databases
Research Materials