

Identification and validation of ferroptosis-related lncRNA signature as a prognostic model for skin cutaneous melanoma
- PMID: 36248853
- PMCID: PMC9556814
- DOI: 10.3389/fimmu.2022.985051
Identification and validation of ferroptosis-related lncRNA signature as a prognostic model for skin cutaneous melanoma
Abstract
Background: Melanoma is a type of skin cancer, which originates from the malignant transformation of epidermal melanocytes, with extremely high lethality. Ferroptosis has been documented to be highly related to cancer pathogenesis and the effect of immunotherapy. In addition, the dysregulation of lncRNAs is greatly implicated in melanoma progression and ferroptosis regulation. However, the significance of ferroptosis-related lncRNA in melanoma treatment and the prognosis of melanoma patients remains elusive.
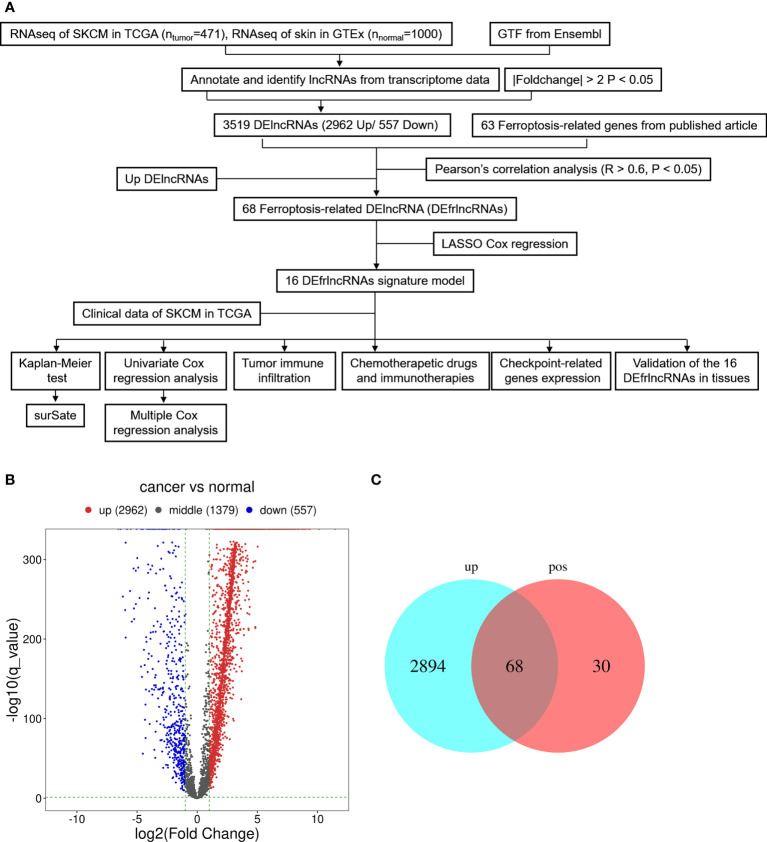
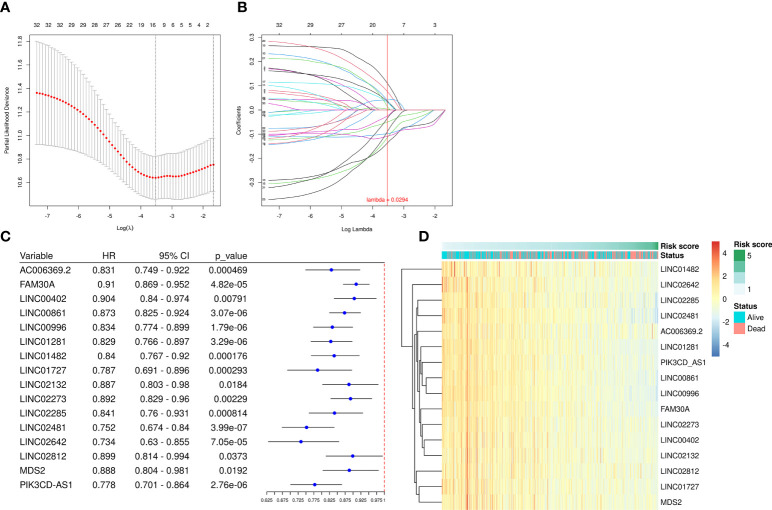
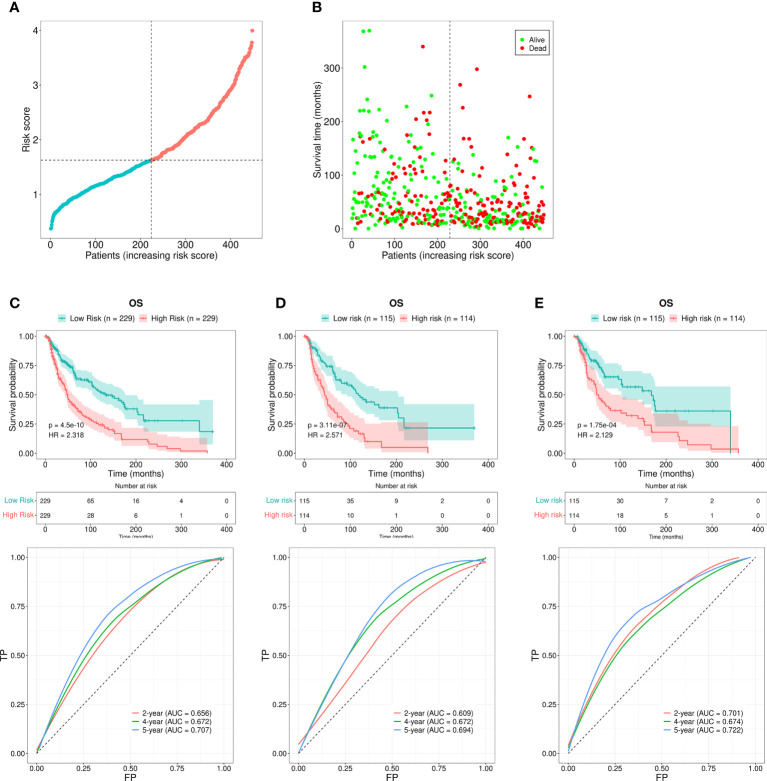
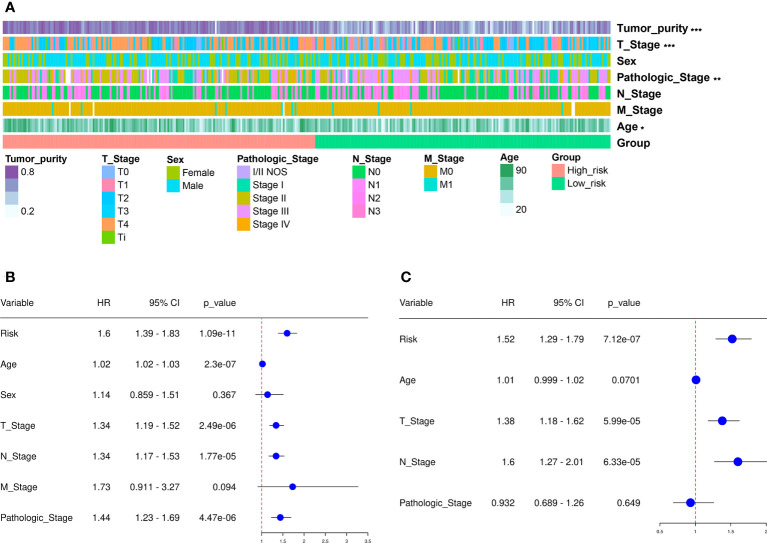
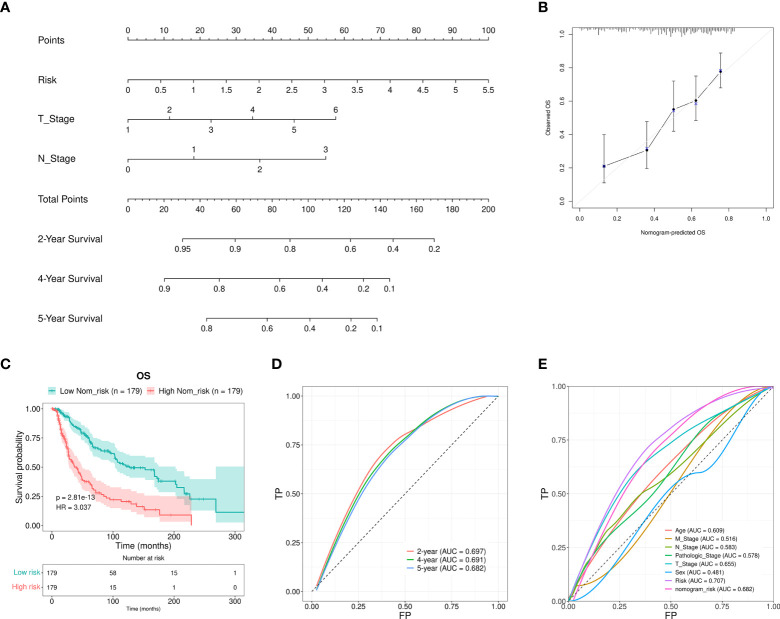
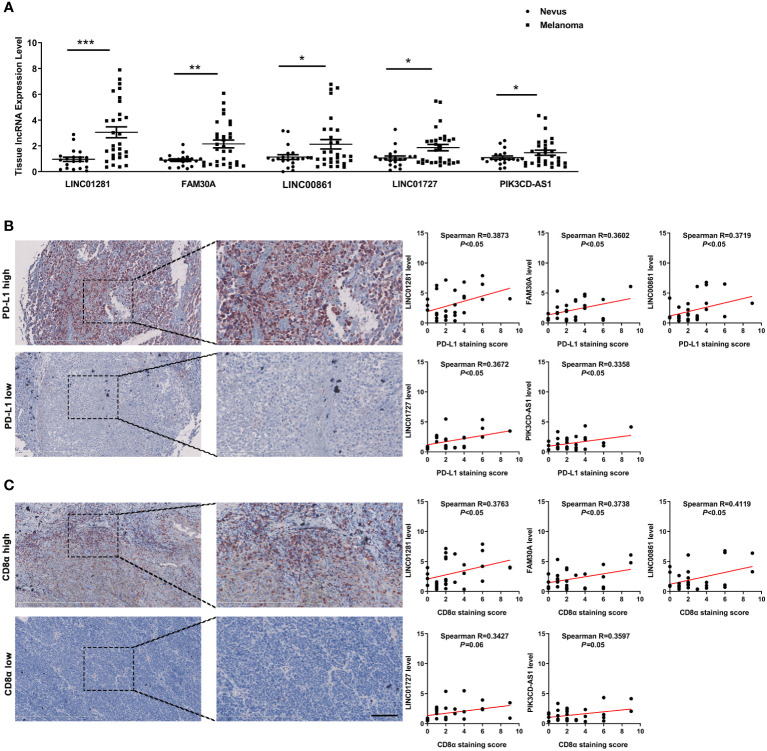
Methods: Via Least Absolute Shrinkage Selection Operator (LASSO) regression analysis in the TCGA SKCM database, a cutaneous melanoma risk model was established based on differentially-expressed ferroptosis-related lncRNAs (DEfrlncRNAs). The nomogram, receiver operating characteristic (ROC) curves, and calibration plots were conducted to examine the predictive performance of this model. Sequentially, we continued to analyze the differences between the high- and low-risk groups, in terms of clinical characteristics, immune cell infiltration, immune-related functions, and chemotherapy drug sensitivity. Moreover, the expressions of DEfrlncRNAs, PD-L1, and CD8 were also examined by qRT-PCR and immunohistochemical staining in melanoma tissues to further confirm the potential clinical implication of DEfrlncRNAs in melanoma immunotherapy.
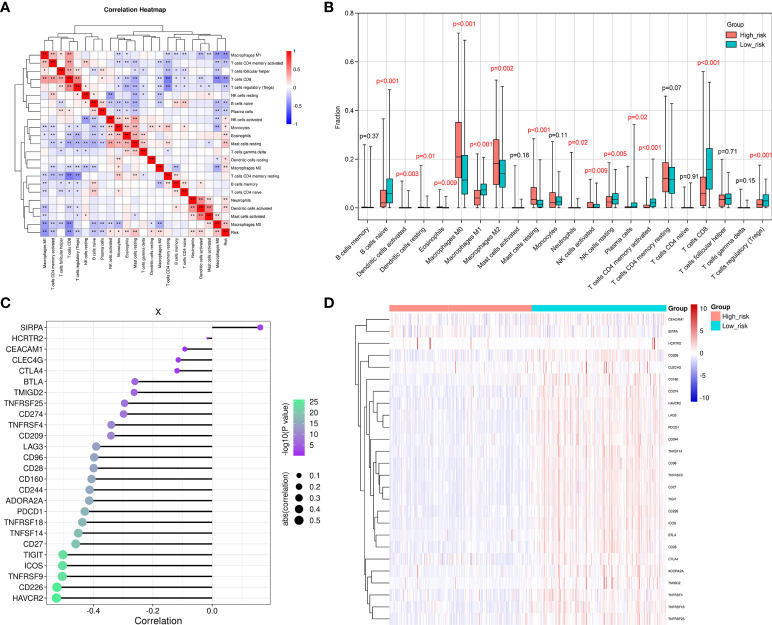
Results: 16 DEfrlncRNAs were identified, and a representative risk score for patient survival was constructed based on these 16 genes. The risk score was found to be an independent prognostic factor for the survival of melanoma patients. In addition, the low-risk group of patients had higher immune cell infiltration in the melanoma lesions, higher sensitivity to chemotherapeutic agents, and a better survival prognosis. Besides, the high expression of the identified 5 DEfrlncRNA in the low-risk group might suggest a higher possibility to benefit from immune checkpoint blockade therapy in the treatment of melanoma.
Conclusion: The DEfrlncRNA risk prediction model related to ferroptosis genes can independently predict the prognosis of patients with melanoma and provide a basis for evaluating the response of clinical treatment in melanoma.
Keywords: cutaneous melanoma; ferroptosis; immune microenvironment; immunotherapy; lncRNA.
Copyright © 2022 Guo, Chen, Yi, Lu and Guo.
Conflict of interest statement
The authors declare that the review was finished in the absence of any commercial or financial relationships that could be construed as a potential conflict of interest.
Figures
Similar articles
-
Development and validation of ferroptosis-related lncRNA signature and immune-related gene signature for predicting the prognosis of cutaneous melanoma patients.Apoptosis. 2023 Jun;28(5-6):840-859. doi: 10.1007/s10495-023-01831-7. Epub 2023 Mar 24. Apoptosis. 2023. PMID: 36964478
-
Melanoma Molecular Subtypes and Development of Prognostic and Immunotherapy-Related Genetic Characteristics by Ferroptosis Gene Analysis.Comput Math Methods Med. 2022 Apr 26;2022:2992939. doi: 10.1155/2022/2992939. eCollection 2022. Comput Math Methods Med. 2022. Retraction in: Comput Math Methods Med. 2023 Dec 13;2023:9756912. doi: 10.1155/2023/9756912. PMID: 35516454 Free PMC article. Retracted.
-
Establishment of a novel ferroptosis-related lncRNA pair prognostic model in colon adenocarcinoma.Aging (Albany NY). 2021 Oct 5;13(19):23072-23095. doi: 10.18632/aging.203599. Epub 2021 Oct 5. Aging (Albany NY). 2021. PMID: 34610581 Free PMC article.
-
Ferroptosis: A Targetable Vulnerability for Melanoma Treatment.J Invest Dermatol. 2025 Jun;145(6):1323-1344. doi: 10.1016/j.jid.2024.11.007. Epub 2025 Jan 9. J Invest Dermatol. 2025. PMID: 39797894 Review.
-
Targeting ferroptosis as a cell death pathway in Melanoma: From molecular mechanisms to skin cancer treatment.Int Immunopharmacol. 2023 Jun;119:110215. doi: 10.1016/j.intimp.2023.110215. Epub 2023 Apr 24. Int Immunopharmacol. 2023. PMID: 37094541 Review.
Cited by
-
Integrated analysis reveals SMARCD1 is a potential biomarker and therapeutic target in skin cutaneous melanoma.J Cancer Res Clin Oncol. 2023 Oct;149(13):11619-11634. doi: 10.1007/s00432-023-05064-8. Epub 2023 Jul 4. J Cancer Res Clin Oncol. 2023. PMID: 37401939 Free PMC article.
-
Combined signature of G protein-coupled receptors and tumor microenvironment provides a prognostic and therapeutic biomarker for skin cutaneous melanoma.J Cancer Res Clin Oncol. 2023 Dec;149(20):18135-18160. doi: 10.1007/s00432-023-05486-4. Epub 2023 Nov 25. J Cancer Res Clin Oncol. 2023. PMID: 38006451 Free PMC article.
-
The role of non-coding RNAs in the regulation of cell death pathways in melanoma.Discov Oncol. 2025 Jun 11;16(1):1063. doi: 10.1007/s12672-025-02888-3. Discov Oncol. 2025. PMID: 40500552 Free PMC article. Review.
-
Development and validation of ferroptosis-related lncRNA signature and immune-related gene signature for predicting the prognosis of cutaneous melanoma patients.Apoptosis. 2023 Jun;28(5-6):840-859. doi: 10.1007/s10495-023-01831-7. Epub 2023 Mar 24. Apoptosis. 2023. PMID: 36964478
-
Ferroptosis-related LncRNAs in diseases.BMC Biol. 2025 Jun 6;23(1):158. doi: 10.1186/s12915-025-02268-x. BMC Biol. 2025. PMID: 40481573 Free PMC article. Review.
References
-
- Chen YY, Chang WA, Lin ES, Chen YJ, Kuo PL. Expressions of HLA class II genes in cutaneous melanoma were associated with clinical outcome: Bioinformatics approaches and systematic analysis of public microarray and RNA-seq datasets. Diagn (Basel) (2019) 9(2):59–77. doi: 10.3390/diagnostics9020059 - DOI - PMC - PubMed
Publication types
MeSH terms
Substances
LinkOut - more resources
Full Text Sources
Medical
Research Materials