. 2022 Sep 29:13:933329.
doi: 10.3389/fimmu.2022.933329. eCollection 2022.

Targeting hypoxia-induced tumor stemness by activating pathogen-induced stem cell niche defense

Affiliations

Targeting hypoxia-induced tumor stemness by activating pathogen-induced stem cell niche defense

Seema Bhuyan et al. Front Immunol. .

Abstract

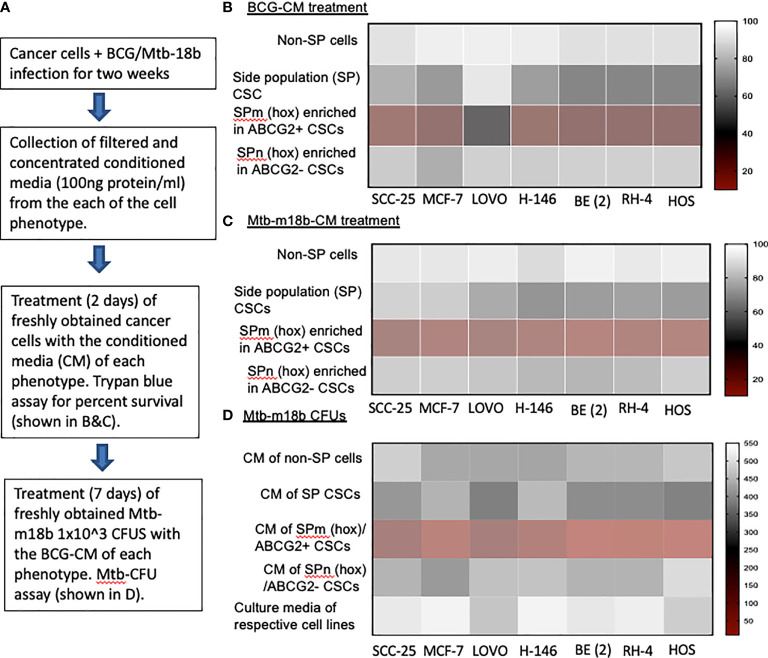
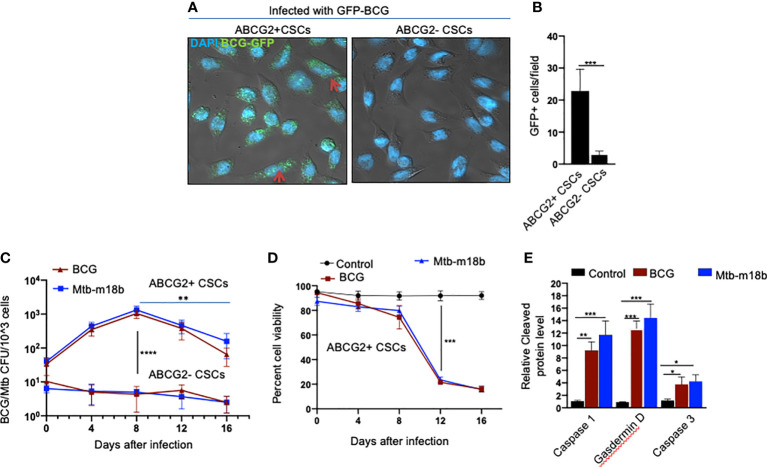
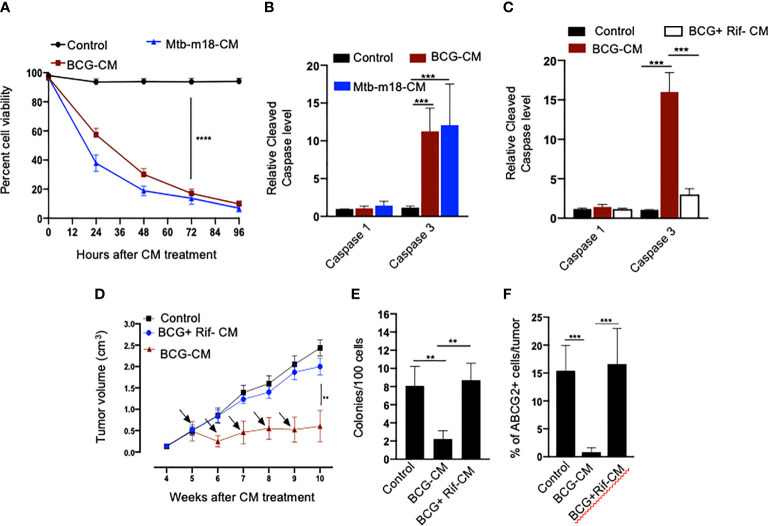
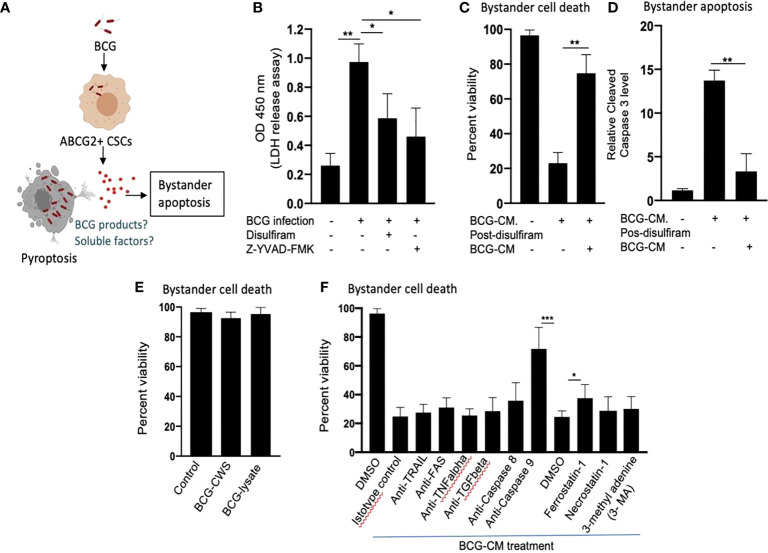
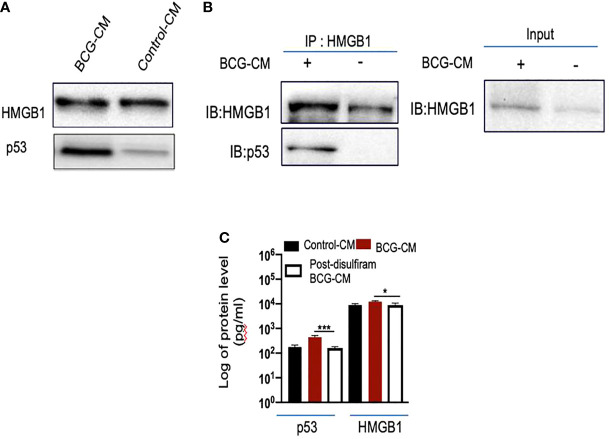
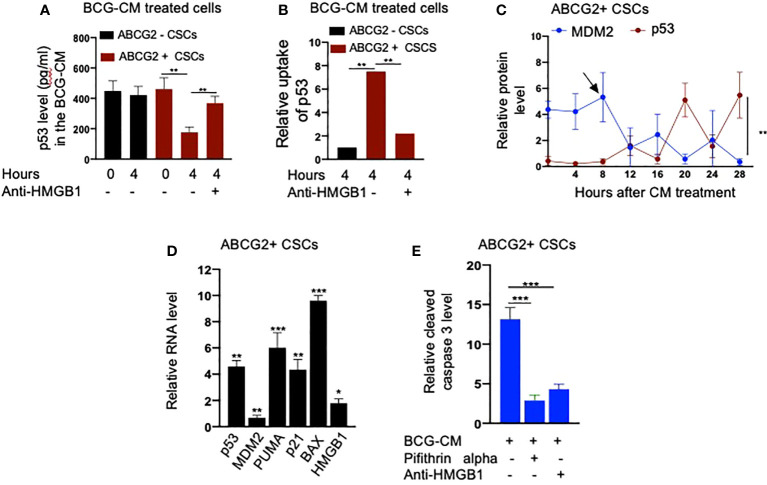
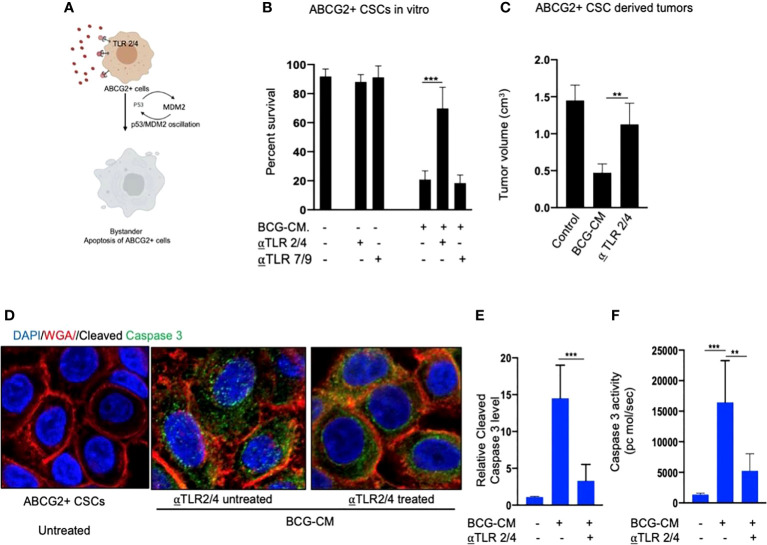
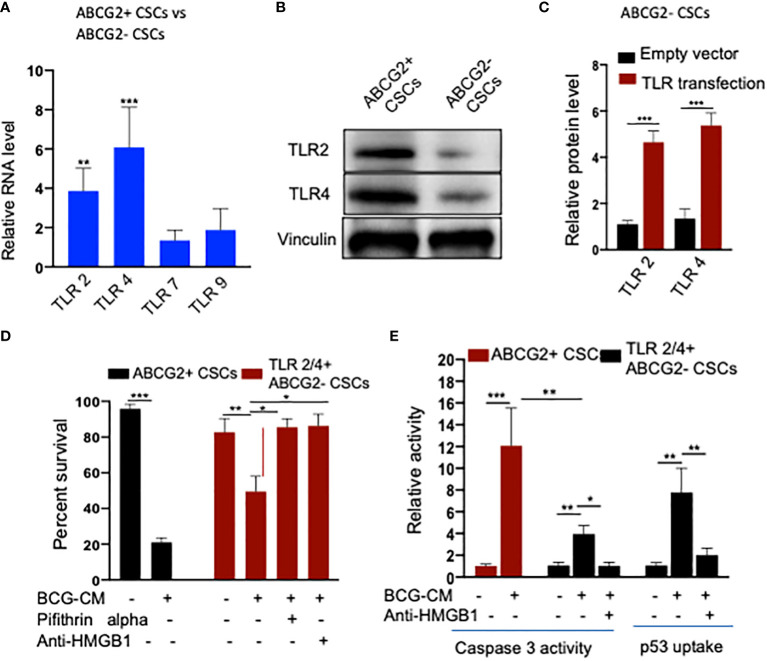
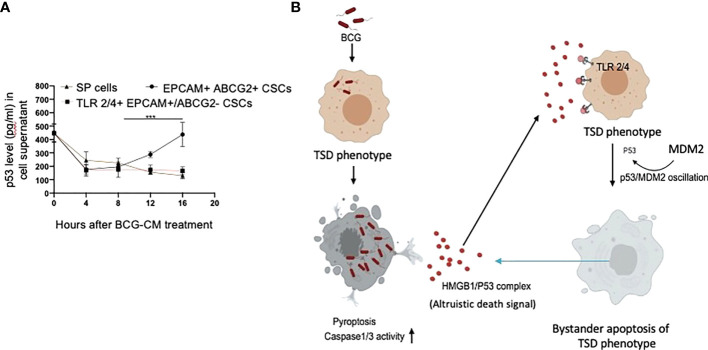
Tumor hypoxia and oxidative stress reprograms cancer stem cells (CSCs) to a highly aggressive and inflammatory phenotypic state of tumor stemness. Previously, we characterized tumor stemness phenotype in the ATP Binding Cassette Subfamily G Member 2 (ABCG2)-positive migratory side population (SPm) fraction of CSCs exposed to extreme hypoxia followed by reoxygenation. Here, we report that post-hypoxia/reoxygenation SPm+/ABCG2+ CSCs exerts defense against pathogen invasion that involves bystander apoptosis of non-infected CSCs. In an in vitro assay of cancer cell infection by Bacillus Calmette Guerin (BCG) or mutant Mycobacterium tuberculosis (Mtb) strain 18b (Mtb-m18b), the pathogens preferentially replicated intracellular to SPm+/ABCG2+ CSCs of seven cell lines of diverse cancer types including SCC-25 oral squamous cancer cell line. The conditioned media (CM) of infected CSCs exhibited direct anti-microbial activity against Mtb and BCG, suggesting niche defense against pathogen. Importantly, the CM of infected CSCs exhibited marked in vitro bystander apoptosis toward non-infected CSCs. Moreover, the CM-treated xenograft bearing mice showed 10- to 15-fold reduction (p < 0.001; n = 7) in the number of CSCs residing in the hypoxic niches. Our in vitro studies indicated that BCG-infected SPm+/ABCG2+ equivalent EPCAM+/ABCG2+ CSCs of SCC-25 cells underwent pyroptosis and released a high mobility group box protein 1 (HMGB1)/p53 death signal into the tumor microenvironment (TME). The death signal can induce a Toll-like receptor 2/4-mediated bystander apoptosis in non-infected CSCs by activating p53/MDM2 oscillation and subsequent activation of capase-3-dependent intrinsic apoptosis. Notably, SPm+/ABCG2+ but not SP cells undergoing bystander apoptosis amplified the death signal by further release of HMGB1/p53 complex into the TME. These results suggest that post-hypoxia SPm+/ABCG2+ CSCs serve a functional role as a tumor stemness defense (TSD) phenotype to protect TME against bacterial invasion. Importantly, the CM of TSD phenotype undergoing bystander apoptosis may have therapeutic uses against CSCs residing in the hypoxic niche.

Keywords: Altruistic Stem Cells (ASCs); Bacillus calmette guerin; Cancer Stem Cells (CSCs); Stem cell niche; Tumor hypoxia and oxidative stress microenvironment; Tumor stemness.


Conflict of interest statement

The authors declare that the research was conducted in the absence of any commercial or financial relationships that could be construed as a potential conflict of interest.

Figures

Figure 1
Figure 1
The tumor stemness phenotype of SPm (hox)/ABCG2+ CSCs exhibits BCG- or Mtb-m18b–mediated bystander apoptosis and anti-microbial activity. (A) Experimental plan. To investigate the niche defense potential of each phenotype, we treated the conditioned media (CM) of infected phenotype with the untreated corresponding phenotype. (B, C) Marked bystander cell death is seen in the SPm (hox) cells enriched in EpCAM+/ABCG2+ CSCs group. These SPm (hox) cells exhibit tumor stemness (TS) phenotype (–7). (D) The CM of SPm(hox)+/ABCG2+CSCs exhibit anti-microbial activity against Mtb-m18b. The vertical bar represents percent of cell survival in (B, D), and number of Mtb-m18b CFUs in (D). Experiments were repeated 4 times, and the results were compared between SPm (hox) and SPn (hox) by student t tests. Results are given in the text.
Figure 2
Figure 2
BCG replicates intracellular to EpCAM+/ABCG2+ CSCs of SCC-25 cell line and induces pyroptosis. Post hypoxia/reoxygenation treated EpCAM+/ABCG2+ CSCs (henceforth known as EpCAM+/ABCG2+ CSCs) obtained from SCC-25 cells exposed to the in vitro system of hypoxia and reoxygenation (5) is sensitive to BCG-induced cell death. (A) Confocal microscopy images (magnification, 20×) showing the localization of GFP-positive BCG intracellular to EpCAM+/ABCG2+ CSCs (shown with arrows) versus post hypoxia/reoxygenation treated EpCAM+/ABCG2- CSCs (henceforth known as EpCAM+/ABCG2- CSCs). (B) Histogram shows 20-fold increase in GFP-positive BCG per hundred microscopic field in EpCAM+/ABCG2+ CSCs versus EpCAM+/ABCG2- CSCs. (C) Intracellular BCG/Mtb-m18b-CFU in EpCAM+/ABCG2+ CSCs versus EpCAM+/ABCG2- CSCs after infection. (D) Trypan blue assay of cell viability of BCG/Mtb-m18b–infected EpCAM+/ABCG2+ CSCs after infection. (E) ELISA-based measurement of cleaved caspase-1, gasdermin D, and caspase-3 levels in EpCAM+/ABCG2+ CSCs of day 12 after BCG/Mtb-m18binfection. Data represent means ± SEM (B–D). N = 3 independent experiments; *p < 0.05, **p < 0.01, ***p < 0.001, and ****p < 0.0001 (B–D: Student’s t-test; E: one-way ANOVA with Dunnet post hoc test).
Figure 3
Figure 3
The CM of BCG-infected EpCAM+/ABCG2+ CSCs induces bystander apoptosis in non-infected EpCAM+/ABCG2+ CSCs. (A) Trypan blue assay of non-infected EpCAM+/ABCG2+ CSCs after treatment with BCG-CM or m18b-CM (CM of BCG/Mtb-m18b–infected EpCAM+/ABCG2+ CSCs grown for 12 days). (B, C) Cleaved caspase levels (ELISA) following 48 h of treatment with BCG-CM or BCG + Rif + CM [CM of BCG-infected EpCAM+/ABCG2+ CSCs treated with Rifampicin (Rif)]. (D) In vivo growth of tumor in a SCC-25–derived xenograftmodel of NOD/SCID mice (n = 10 in each group) treated with BCG-CM Arrow: intra-tumor treatment with 0.1 ml of sterile concentrated CM containing 0.5 mg of protein. (E, F) The clonogenic potential and percentage of EpCAM+/ABCG2+ CSCs in dissociated tumor cells obtained from the xenografts of 10th week after the BCG-CM treatment. Data represent means ± SEM (B–D). N = 3 independent experiments (A–C); N = 5 independent experiments (E–F). **p < 0.01, ***p < 0.001, and ****p < 0.0001 (Student’s t-test).
Figure 4
Figure 4
Pyroptosis-mediated secretion of soluble factors may induces bystander apoptosis. (A) The schematic is showing the experimental hypothesis. (B) The histogram is showing LDH release by BCG-infected EpCAM+/ABCG2+ CSCs on day 12. The LDH was measured after treating the BCG-infected EpCAM+/ABCG2+ CSCs with or without disulfiram and Z-YVAD-FMK from days 8 to 12. (C, D) Data show the uninfected EpCAM+/ABCG2+ CSC viability and bystander apoptosis following treatment of BCG-CM obtained from the infected EpCAM+/ABCG2+ CSCs with or without disulfiram treatment. (E) EpCAM+/ABCG2+ CSCs are not sensitive to BCG cell wall skeleton (BCG-CWS) and BCG-lysate treatment for a week. (F) EpCAM+/ABCG2+ CSCs were treated with various neutralizing antibodies and inhibitors during BCG-CM treatment. N = 3 independent experiments for (B–D), and n = 4 independent experiment for (E, F). One-Way ANOVA (B) and Student’s t-test (C, D, F).*p < 0.05, **p < 0.01, and ***p < 0.001 (B, F: one-way ANOVA with Dunnet post hoc test; C, D: Student’s t-test).
Figure 5
Figure 5
BCG-infected EpCAM+/ABCG2+ CSCs release HMGB1/p53 complex during pyroptosis. (A) Western blot of concentrated BCG-CM and control-CM showing the presence of HMGB1 and p53. 10 µg of protein was loaded in both infected and control group. (B) Immunoprecipitation experiment confirms the formation of HMGB1/p53 complex in BCG-CM versus control-CM. Immunoblotting (IB) of HMGB1 and p53 was also performed. Input is 2.5% of the total amount of immunoprecipitated. (C) The histogram is showing the secretion of HMGB1/p53 complex by BCG-infected EpCAM+/ABCG2+ CSCs with or without disulfiram treatment (50 nM/twice daily for 4 days). The elute of IP/HMGB1 shown in (B) was subjected to ELISA, and protein levels were compared with uninfected EpCAM+/ABCG2+ CSCs (p53: average, 0.13 ng/ml; HMGB1: average, 10.5 ng/ml) to obtain fold change. Data represent means ± SEM. N = 3 independent experiments (A–C). *p < 0.05 and ***p < 0.001 (Student’s t-test).
Figure 6
Figure 6
Bystander apoptosis is characterized by the HMGB1/p53 complex–mediated apoptosis. (A) p53 uptake by the EpCAM+/ABCG2+ versus EpCAM+/ABCG2- CSCs with or without anti-HMGB1 pre-treated BCG-CM. (B) Relative uptake of p53 by the EpCAM+/ABCG2+ and EpCAM+/ ABCG2- CSCs with or without neutralizing anti-HMGB1 pre-treated BCG-CM. (C) The induction of p53/MDM2 oscillation in EpCAM+/ABCG2+ CSCs following 12 h of BCG-CM treatment. (D) Significant induction of p53-related pro-apoptotic genes and HMGB1 gene in EpCAM+/ABCG2+ CSCs following 28 h of BCG-CM treatment. The real-time PCR data were compared with untreated EpCAM+/ABCG2+ CSCs to obtain fold change. (E) Significant increase in cleaved caspase-3 protein level in EpCAM+/ABCG2+ CSCs treated with BCG-CM with or without pifithrin alpha (2 µM in DMSO for 48 h) or anti-HMGB1 (10 µg/ml for 48 h; isotype control of same dose). Data represent means ± SEM (A–E). N = 3 independent experiments (A–E). *p < 0.05, **p < 0.01, and ***p < 0.001 (A, B, E: one-way ANOVA with Dunnet post hoc test; C, D: Student’s t-test).
Figure 7
Figure 7
Bystander apoptosis is mediated by TLR2 and TLR4. (A) Hypothesis: TLR2/4 are required for the execution of HMGB1/p53 complex–mediated bystander apoptosis. (B) Relative cell viability of BCG-CM–treated (72 h) EpCAM+/ABCG2+ CSCs pretreated with TLR-neutralizing antibodies. (C) SCC-25 xenograft size in BCG-CM–treated and TLR-neutralizing Abs pretreated mice (n=5). (D) Immunofluorescence labeling of BCG-CM–treated (72 h) EpCAM+/ABCG2+ CSCs with cleaved caspase-3 (Dapi, nuclear stain; WGA, cell membrane stain). Magnification, 20×. (E, F) The corresponding cleaved caspase-3 protein level (ELISA) and enzymatic activity of caspase-3 in the EpCAM+/ABCG2+ CSCs. Data represent means ± SEM (B, D, E). **p < 0.001 and ***p < 0.0001; N = 3; (B–E) Student’s t-test; (F) one-way ANOVA with Dunnet post hoc test.
Figure 8
Figure 8
(A) TLR2 and TLR4 are required for the internalization of HMGB1/p53 complex into the CSCs. (B) Real-time PCR expression of TLR2, TLR4, TLR7, and TLR9 in EpCAM+/ABCG2+ CSCs vs. EpCAM+/ABCG2- CSCs. (C) Western blot shows TLR2/4 expression in EpCAM+/ABCG2+ CSCs vs. ABCG2− CSCs. (D) TLR2 and TLR4 plasmid transfection efficiency in EpCAM+/ABCG2- CSCs measured by ELISA. Control transfection was achieved using a pcDNA3 empty vector as described (1). (D, E) TLR2 and TLR4 overexpressing EpCAM+/ABCG2- showing BCG-CM–mediated bystander cell death, caspase-3 activity, and p53 uptake EpCAM+/ABCG2+ CSCs served as control for BCG-CM potency. Caspase-3 activity was measured after 48 h, whereas p53 uptake activity was measured after 4 h of BCG-CM treatment. *p < 0.05, **p < 0.001, and ***p < 0.0001, N = 3; Student’s t-test (A, C), and one-way ANOVA (D, E).
Figure 9
Figure 9
Tumor stemness defense (TSD) phenotype can amplify the pathogen-induced bystander apoptosis (PIBA). (A) The p53 uptake assay in the culture supernatant was measured from 0 to 16 h of BCG-CM treatment in the cells. The SCC-25 SP cells were obtained as described in Figure 1 Data represent mean +/- SEM, n= 3 independent experiments. ***p < 0.0001, student t test. (B) Potential mechanism of TSD phenotype–mediated niche defense of CSCs against BCG infection. In the infected CSCs, as part of the Altruistic stemness–based (37) niche defense mechanism (6, 16, 17) HMGB1 form a complex with cytoplasmic p53 to make an, “altruistic death signal”. TLR4 internalizes the altruistic death signal, leading to induction of p53/MDM2 oscillation and activation of p53-induced pro-apoptotic genes. The EpCAM+/ABCG2+ CSCs undergoing bystander apoptosis further release the HMGB1/p53 death complex into the TME, amplifying PIBA.

Similar articles

Cited by

References

    1. Das B, Pal B, Bhuyan R, Li H, Sarma A, Gayan S, et al. . MYC regulates the HIF2alphaStemness pathway via nanog and Sox2 to maintain self-renewal in cancer stem cells versus non-stem cancer cells. Cancer Res (2019) 79(16):4015–25. doi: 10.1158/0008-5472.CAN-18-2847 - DOI - PMC - PubMed
    1. Jabbour E, Cortes JE, Kantarjian HM. Suboptimal response to or failure of imatinib treatment for chronic myeloid leukemia: What is the optimal strategy? Mayo Clin Proc (2009) 84(2):161–9. doi: 10.4065/84.2.161 - DOI - PMC - PubMed
    1. Conley SJ, Gheordunescu E, Kakarala P, Newman B, Korkaya H, Heath AN, et al. . Antiangiogenic agents increase breast cancer stem cells via the generation of tumor hypoxia. Proc Natl Acad Sci U S A (2012) 109(8):2784–9. doi: 10.1073/pnas.1018866109 - DOI - PMC - PubMed
    1. Castagnoli L, De Santis F, Volpari T, Vernieri C, Tagliabue E, Nicola MD, et al. . Cancer stem cells: Devil or savior-looking behind the scenes of immunotherapy failure. Cells (2020) 9(3):555. doi: 10.3390/cells9030555 - DOI - PMC - PubMed
    1. Das B, Tsuchida R, Malkin D, Koren G, Baruchel S, Yeger H. Hypoxia enhances tumor stemness by increasing the invasive and tumorigenic side population fraction. Stem Cells (2008) 26(7):1818–30. doi: 10.1634/stemcells.2007-0724 - DOI - PubMed

Publication types