. 2022 Sep 28:13:985187.
doi: 10.3389/fimmu.2022.985187. eCollection 2022.

Single-cell sequencing reveals effects of chemotherapy on the immune landscape and TCR/BCR clonal expansion in a relapsed ovarian cancer patient

Affiliations

Single-cell sequencing reveals effects of chemotherapy on the immune landscape and TCR/BCR clonal expansion in a relapsed ovarian cancer patient

Yanyu Ren et al. Front Immunol. .

Abstract

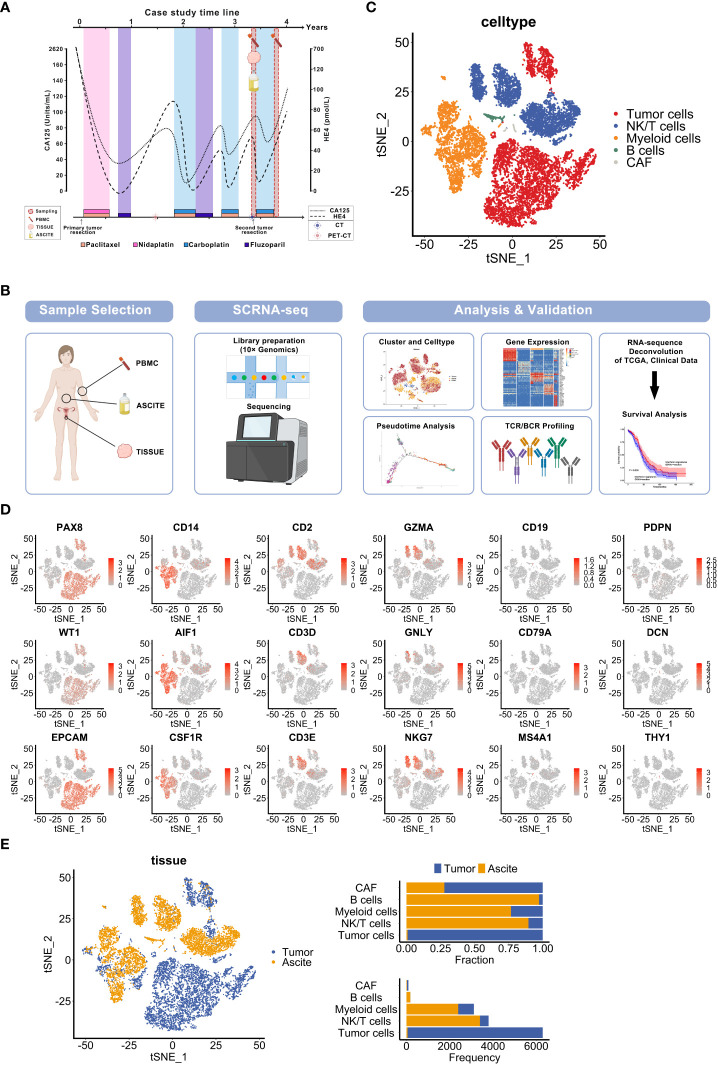
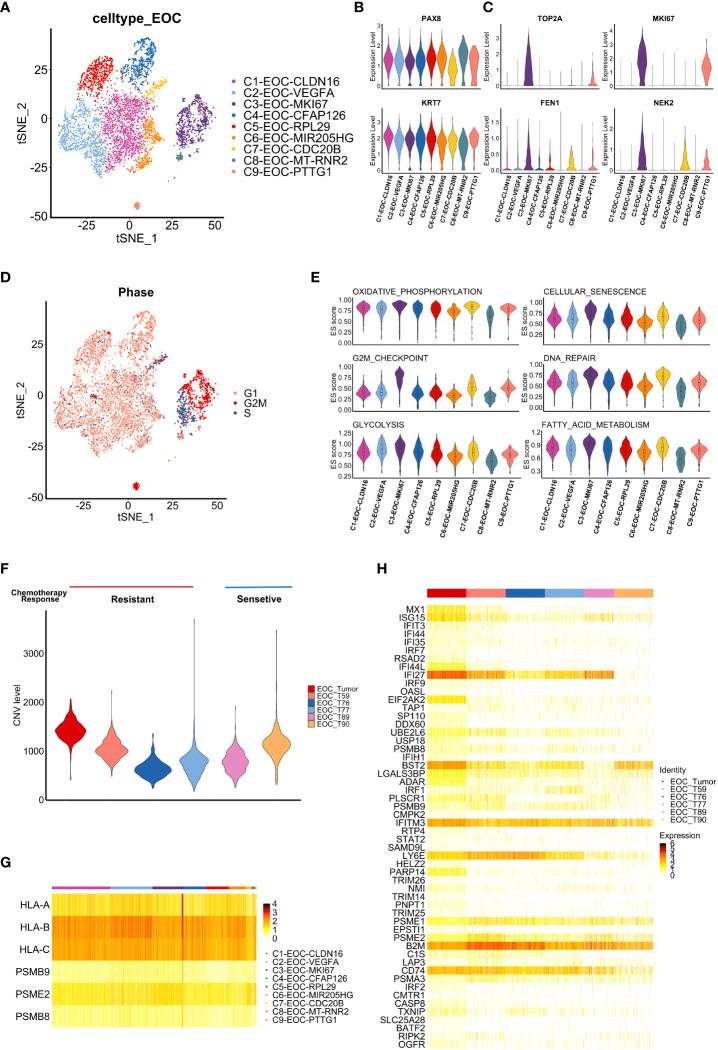
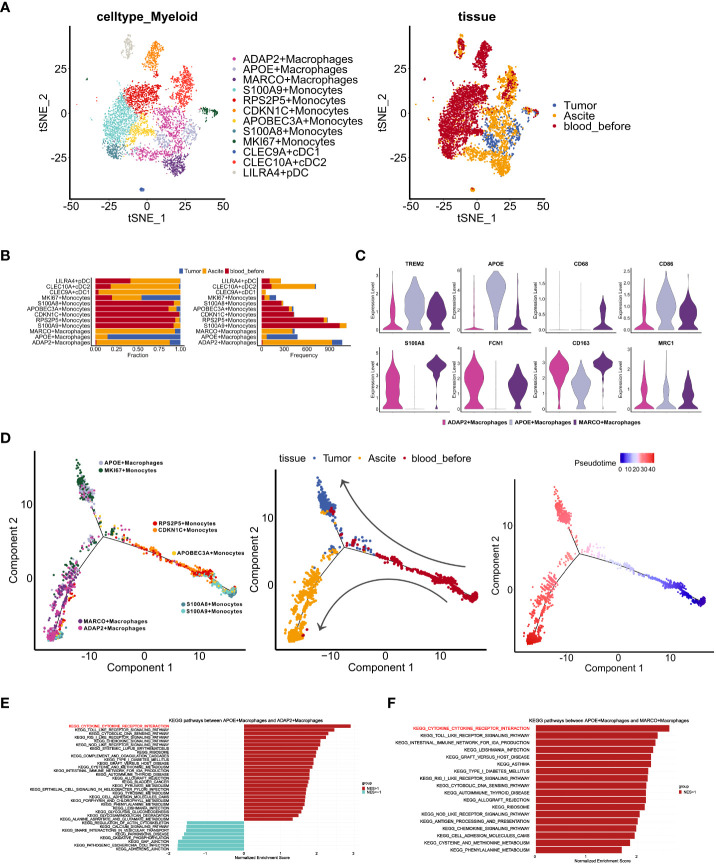
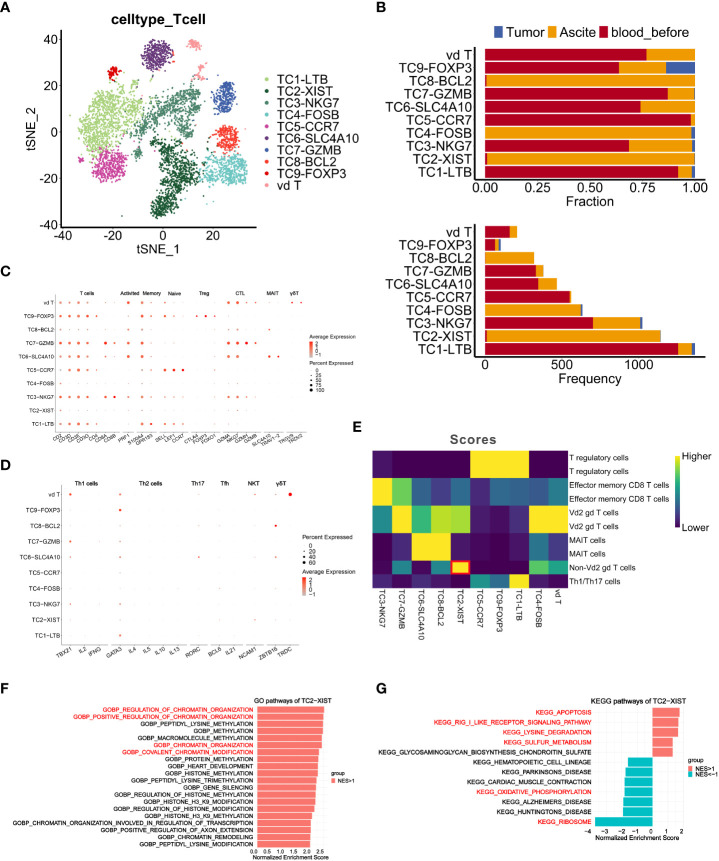
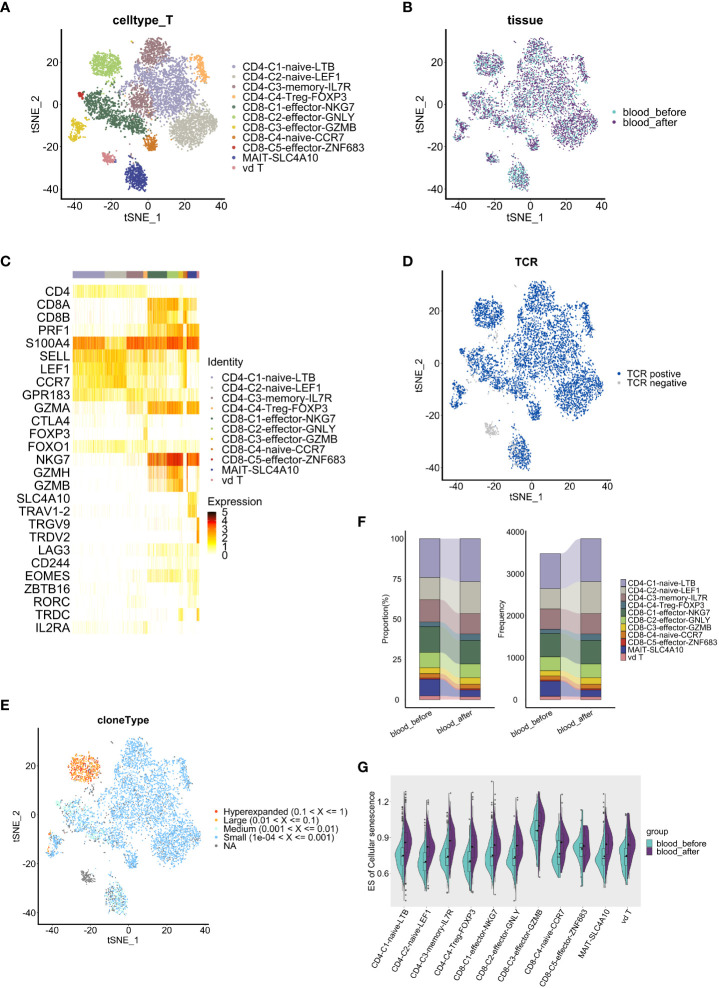
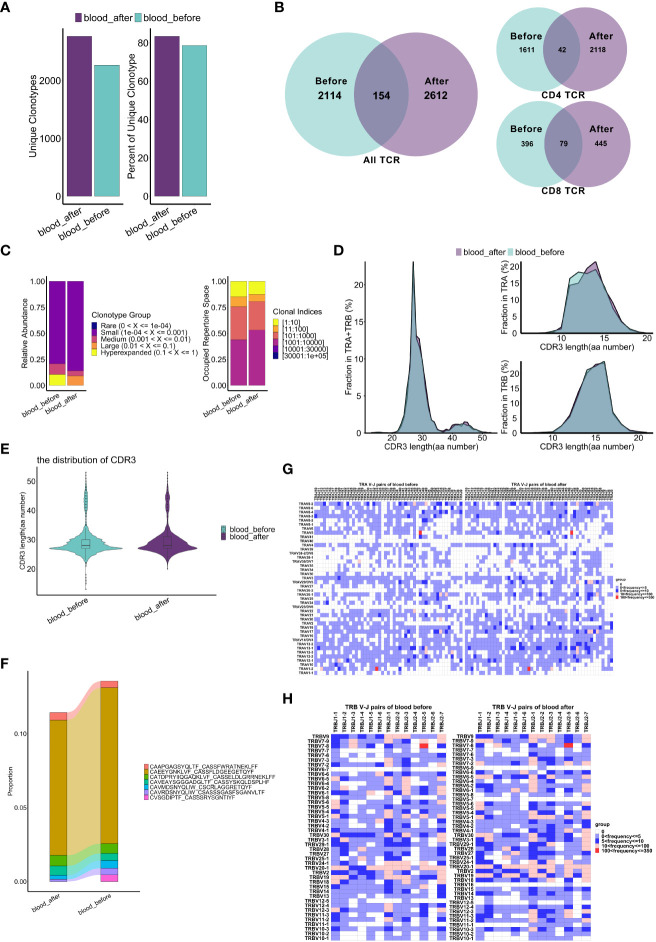
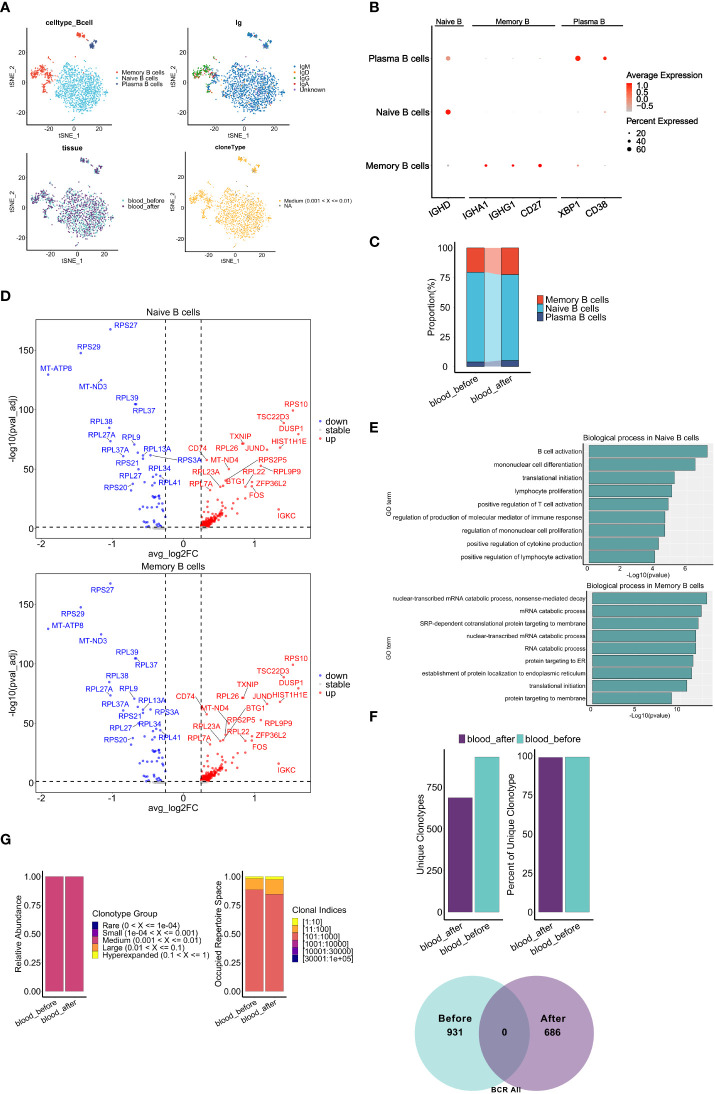
Cancer recurrence and chemoresistance are the leading causes of death in high-grade serous ovarian cancer (HGSOC) patients. However, the unique role of the immune environment in tumor progression for relapsed chemo-resistant patients remains elusive. In single-cell resolution, we characterized a comprehensive multi-dimensional cellular and immunological atlas from tumor, ascites, and peripheral blood of a chemo-resistant patient at different stages of treatment. Our results highlight a role in recurrence and chemoresistance of the immunosuppressive microenvironment in ascites, including MDSC-like myeloid and hypo-metabolic γδT cells, and of peripheral CD8+ effector T cells with chemotherapy-induced senescent/exhaustive. Importantly, paired TCR/BCR sequencing demonstrated relative conservation of TCR clonal expansion in hyper-expanded CD8+ T cells and extensive BCR clonal expansion without usage bias of V(D)J genes after chemotherapy. Thus, our study suggests strategies for ameliorating chemotherapy-induced immune impairment to improve the clinical outcome of HGSOC.

Keywords: TCR/BCR repertoire; chemotherapy; clonal expansion; immune microenvironment; ovarian cancer; single-cell sequencing.


Conflict of interest statement

The authors declare that the research was conducted in the absence of any commercial or financial relationships that could be construed as a potential conflict of interest.

Figures

Figure 1
Figure 1
Single-cell sequencing to characterize the diverse cellular components of specimens derived from a recurrent ovarian cancer patient. (A) Overview of the clinical course and sample collection time of an HGSOC patient. The curved lines indicate changes of tumor biomarkers (CA125, HE4). The timepoints of chemotherapy treatment are shown in the label. (B) Overview of the sample collection, profiling strategy and analysis workflow. (C) t-SNE visualization of diverse cell types in sample Tumor and Ascite, colored by each cell type. (D) t-SNE plots show cell-type marker genes expression level. (E) t-SNE visualization of cells from samples Tumor and Ascite, colored by sample origin (left panel). Fraction and frequency of cells (x axis) from tumor tissues and ascites in each cell type (y axis) (right panel).
Figure 2
Figure 2
Tumor-intrinsic features uncovered by single cell analysis. (A) t-SNE visualization of tumor cell subclusters from samples Tumor and Ascites, colored by tumor cell subclusters. (B, C) Violin plots display the expression of fallopian tube epithelium (FTE) markers (B) and chemotherapy resistance-related genes (C) in each tumor cell subclusters. Distribution of the per cell signature expression Is based on normalized data. (D) t-SNE visualization of cell cycle phases of tumor cells in sample Tumor and Ascites, colored by cell cycle phase. (E) Violin plots shows the enrichment level of specific pathways among each tumor cell subcluster. Distribution of the per cell signature expression was based on the GSVA scores. (F) Violin plot shows CNV level among tumor cells from our data and five additional HGSOC samples. (Tumor, T59, T76, T77: chemo-resistant; T89, T90: chemo-sensitive) (G) Heatmap shows the expression of antigen presentation related genes in tumor cell subclusters from sample Tumor. (H) Heatmap shows the expression of interferon response pathway-associated genes in tumor cells from six HGSOC samples (Tumor, T59, T76, T77, T89, T90).
Figure 3
Figure 3
Characteristics of myeloid cells in distinct TMEs of ascites, tumor and PBMCs. (A) t-SNE visualization of myeloid cells profiles from three samples (Tumor, Asicite, blood_before) before the fourth course of chemotherapy, colored by myeloid cell subclusters (left panel) and sample origins (right panel). (B) Fraction and frequency of myeloid cells (x axis) from samples (Tumor, Asicite, blood_before) in each myeloid subcluster (y axis). (C) Violin plots display the expression TAM- (TREM2, APOE), MDSC- (S100A8, FCN1) and M1-like (CD68, CD86), M2-like (CD163, MRC1) signatures expression among three macrophage subclusters (ADAP2+ Macrophages, APOE+ Macrophages, MARCO+ Macrophages). (D)Pseudotime analysis of monocytes and macrophages from samples (Tumor, Asicite, blood_before), colored by each myeloid subcluster (left panel), derived-samples (middle panel) and pseudotime trajectory (right panel). (E, F) Gene set enrichment analysis between APOE subcluster and ADAP2 subcluster (E), APOE and MARCO subcluster (F) using KEGG gene sets. Pathway enrichment is expressed as normalized enrichment score (NES).
Figure 4
Figure 4
Characteristics and dynamics of T cells from samples before chemotherapy at single-cell resolution. (A, B) t-SNE visualization of T cell clusters from samples (Tumor, Ascite, blood_before) before chemotherapy, colored by the identified T cell subclusters. (B) Fraction and frequency of T cells (x axis) from samples (Tumor, Ascite, blood_before) in each T cell subcluster (y axis). (C, D) Dot plots show expression level of signature genes in each T cell subcluster. (E) Heatmap shows the classification result of each T cell subclusters using singleR. (F, G) Gene set enrichment analysis of T cell subcluster TC2-XIST using GO gene sets (F) and KEGG gene sets (G). Pathway enrichment is expressed as normalized enrichment score (NES).
Figure 5
Figure 5
Comparative analysis of T cell features and dynamics in peripheral blood. (A, B) t-SNE visualization of T cells, colored by subclusters (A) and samples (B). (C) Heatmap shows the expression level of marker genes in each T cell subcluster. (D) t-SNE visualization of TCRs identified in T cells. (E) t-SNE visualization of clonal expansion detected in T cells. (F) Proportion(left panel) and frequency(right panel) of T cell subclusters (y axis) in two blood samples(x axis). (G) Split violin plots show the enrichment level of cell senescence grouped by T subclusters and colored by samples. The results above are generated by comparison between samples (blood_before, blood_after).
Figure 6
Figure 6
Comparative analysis of TCRs pre and post chemotherapy in peripheral blood. (A) Bar graphs show quantity and percentage of unique clonotypes. (B) Venn diagram showing the common and specific TCR of T cells (whole T cells, CD4+ T cells and CD8+ T cells). (C) Clonal homeostatic space representations (clonal space occupied by clonotypes of specific proportions) (left panel) and the relative proportional space occupied by specific clonotypes (right panel) of TCRs across samples. (D) Curve graphs show CDR3 aa length distribution of TCRs (TRA: α chains, TRB: β chains, aa: amino acid). (E) Violin plots show the CDR3 aa length distribution of TCR. (F) Dynamics of dominant CDR3 sequences of TCRs across samples pre and post chemotherapy, colored by the types of dominant sequences. (G, H) Heatmaps show frequency of V-J pairs in α chains (G) and β chains (H) among two samples. The results above are generated by comparison between samples (blood_before, blood_after).
Figure 7
Figure 7
Characteristics of B cell subclusters before and after chemotherapy. (A) t-SNE visualization of B cells colored by cell types (top left), BCR isotypes (top right), derived-samples (bottom left) and clonal expansion status(bottom right). (B) Dot plots show expression level of marker genes of B cell types. (C) Proportion of B cell subclusters (y axis) in two blood samples(x axis). (D) Volcano plots show DEGs of naive B cells (top panel) and memory B cells (bottom panel) after chemotherapy compared with those before chemotherapy. (E) Gene set enrichment analysis of naive B cells (top panel) and memory B cells (bottom panel) after chemotherapy. The analyses were based on the Msigdbr GO database. (F) Bar graphs top panel and venn diagram bottom panel show the change of frequency and fraction of unique clonotypes, colored by collection time. (G) Clonal homeostatic space representations (clonal space occupied by clonotypes of specific proportions) (left panel) and the relative proportional space occupied by specific clonotypes (right panel) of BCR across samples pre and post chemotherapy. The results above are generated by comparison between samples (blood_before, blood_after).

Similar articles

Cited by

References

    1. Sung H, Ferlay J, Siegel RL, Laversanne M, Soerjomataram I, Jemal A, et al. . Global cancer statistics 2020: GLOBOCAN estimates of incidence and mortality worldwide for 36 cancers in 185 countries. CA Cancer J Clin (2021) 71(3):209–49. doi: 10.3322/caac.21660 - DOI - PubMed
    1. Kuroki L, Guntupalli SR. Treatment of epithelial ovarian cancer. BMJ (2020) 371:m3773. doi: 10.1136/bmj.m3773 - DOI - PubMed
    1. Lheureux S, Gourley C, Vergote I, Oza AM. Epithelial ovarian cancer. Lancet (2019) 393(10177):1240–53. doi: 10.1016/S0140-6736(18)32552-2 - DOI - PubMed
    1. Palaia I, Tomao F, Sassu CM, Musacchio L, Benedetti Panici P. Immunotherapy for ovarian cancer: Recent advances and combination therapeutic approaches. Onco Targets Ther (2020) 13:6109–29. doi: 10.2147/OTT.S205950 - DOI - PMC - PubMed
    1. Ahmed N, Stenvers KL. Getting to know ovarian cancer ascites: opportunities for targeted therapy-based translational research. Front Oncol (2013) 3:256. doi: 10.3389/fonc.2013.00256 - DOI - PMC - PubMed

Publication types

MeSH terms

Substances