. 2022 Sep 29:13:999298.
doi: 10.3389/fimmu.2022.999298. eCollection 2022.

Peripheral blood marker of residual acute leukemia after hematopoietic cell transplantation using multi-plex digital droplet PCR

Affiliations

Peripheral blood marker of residual acute leukemia after hematopoietic cell transplantation using multi-plex digital droplet PCR

M Stanojevic et al. Front Immunol. .

Abstract

Background: Relapse remains the primary cause of death after hematopoietic cell transplantation (HCT) for acute leukemia. The ability to identify minimal/measurable residual disease (MRD) via the blood could identify patients earlier when immunologic interventions may be more successful. We evaluated a new test that could quantify blood tumor mRNA as leukemia MRD surveillance using droplet digital PCR (ddPCR).

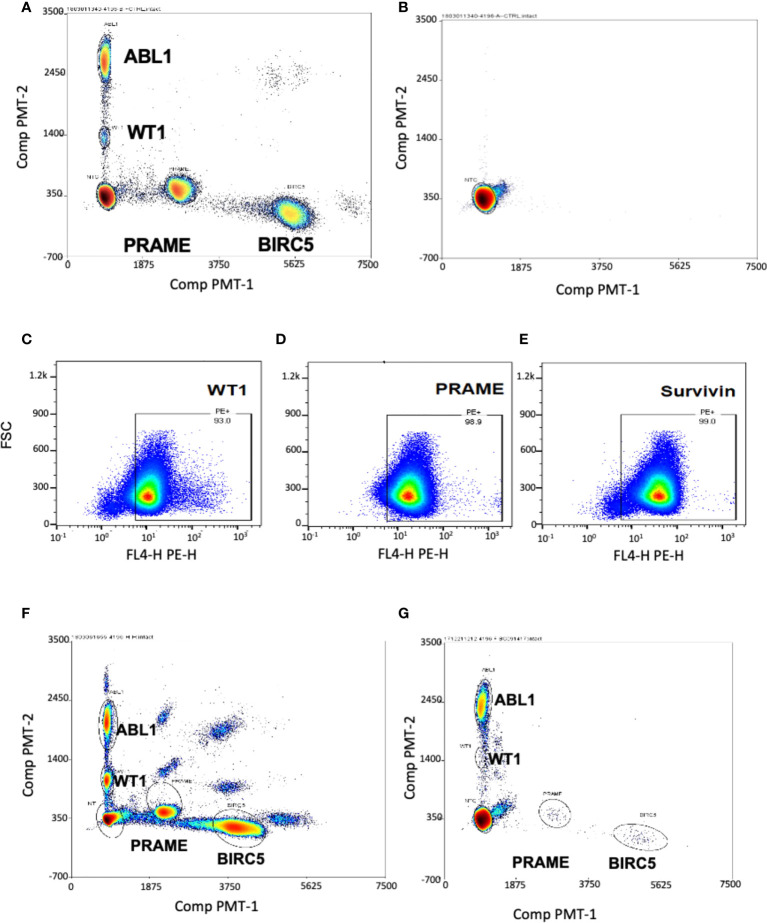
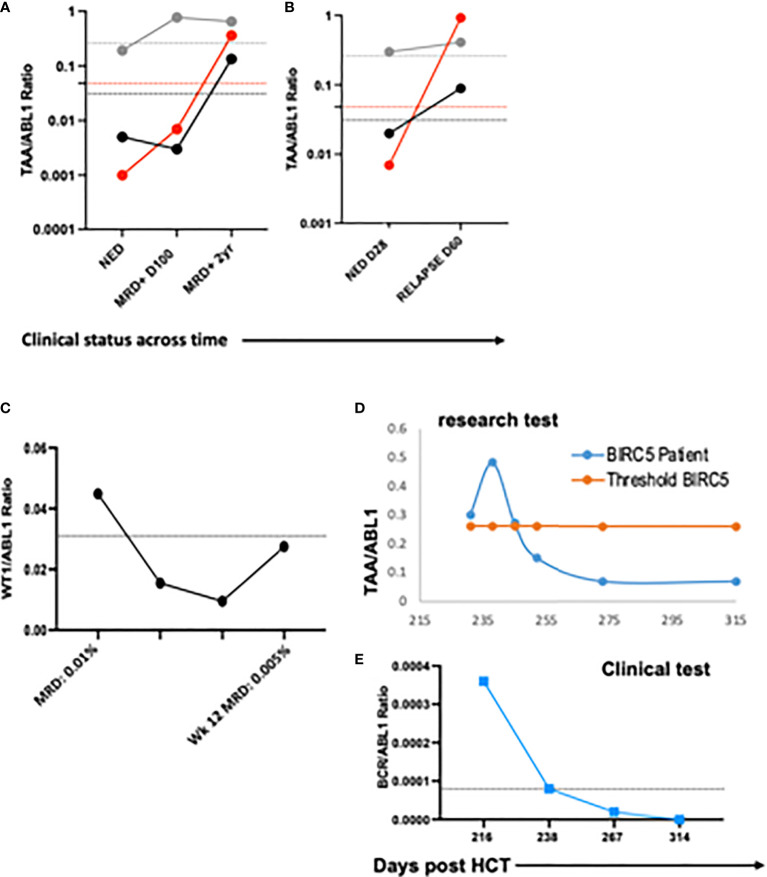
Methods: The multiplex ddPCR assay was developed using tumor cell lines positive for the tumor associated antigens (TAA: WT1, PRAME, BIRC5), with homeostatic ABL1. On IRB-approved protocols, RNA was isolated from mononuclear cells from acute leukemia patients after HCT (n = 31 subjects; n = 91 specimens) and healthy donors (n = 20). ddPCR simultaneously quantitated mRNA expression of WT1, PRAME, BIRC5, and ABL1 and the TAA/ABL1 blood ratio was measured in patients with and without active leukemia after HCT.

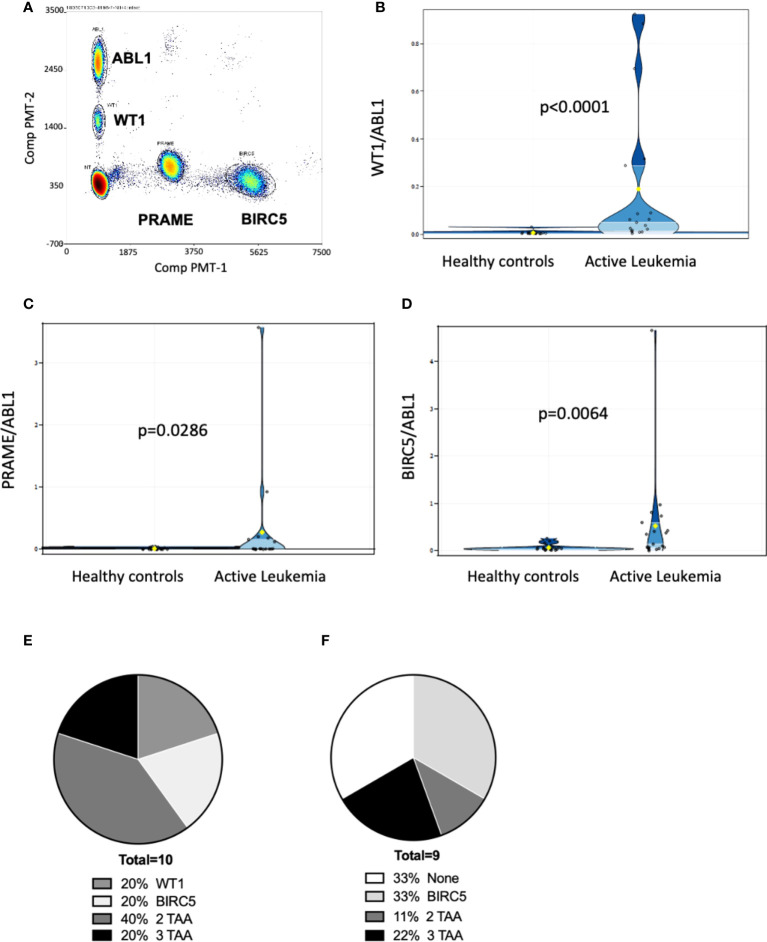
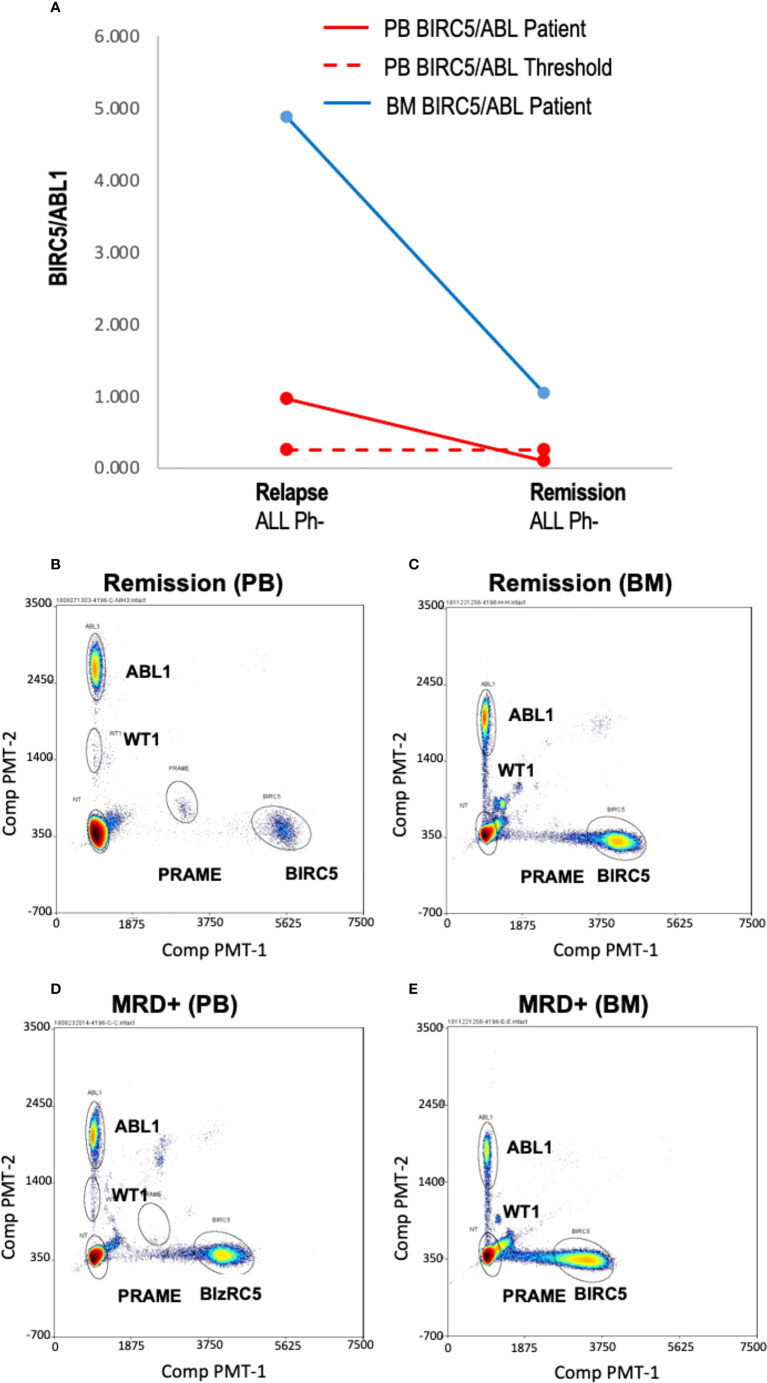
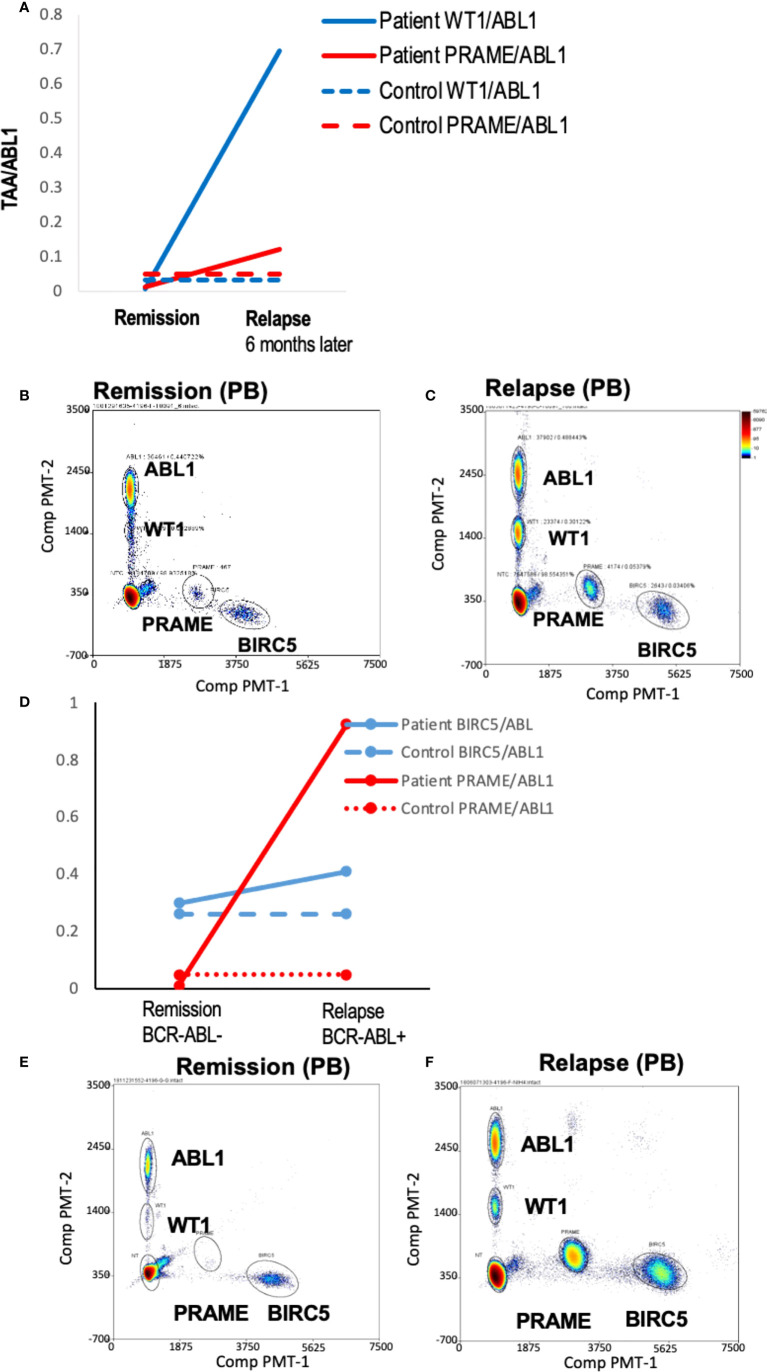
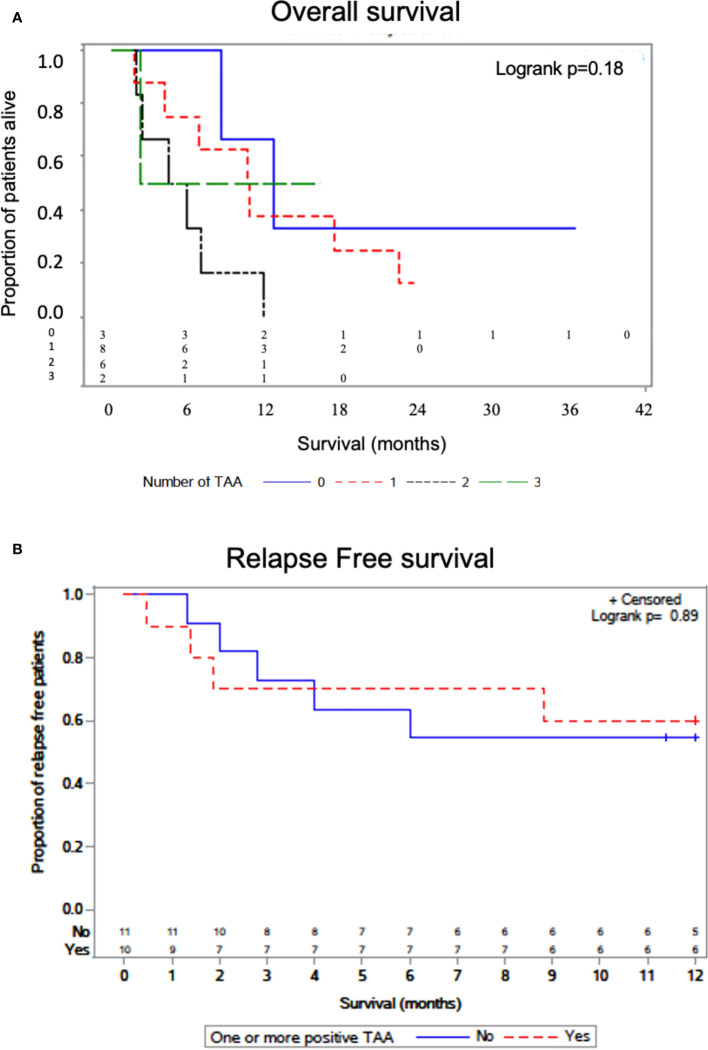
Results: Tumor cell lines confirmed quantitation of TAAs. In patients with active acute leukemia after HCT (MRD+ or relapse; n=19), the blood levels of WT1/ABL1, PRAME/ABL1, and BIRC5/ABL1 exceeded healthy donors (p<0.0001, p=0.0286, and p=0.0064 respectively). Active disease status was associated with TAA positivity (1+ TAA vs 0 TAA) with an odds ratio=10.67, (p=0.0070, 95% confidence interval 1.91 - 59.62). The area under the curve is 0.7544. Changes in ddPCR correlated with disease response captured on standard of care tests, accurately denoting positive or negative disease burden in 15/16 (95%). Of patients with MRD+ or relapsed leukemia after HCT, 84% were positive for at least one TAA/ABL1 in the peripheral blood. In summary, we have developed a new method for blood MRD monitoring of leukemia after HCT and present preliminary data that the TAA/ABL1 ratio may may serve as a novel surrogate biomarker for relapse of acute leukemia after HCT.

Keywords: acute leukemia; digital droplet PCR; hematopoietic cell transplantation; minimal residual disease; relapse.


Conflict of interest statement

The authors declare that the research was conducted in the absence of any commercial or financial relationships that could be construed as a potential conflict of interest.

Figures

Figure 1
Figure 1
Multiplex ddPCR simultaneously detected ABL1, PRAME, BIRC5 and WT1 in cell lines and at low levels in healthy donors. Separation of single-positive droplet clusters in dual color, four-target ddPCR concomitantly detected ABL1, BIRC5, PRAME and WT1. (A) Healthy control PBMCs were spiked with HEP3B (BIRC5+) and K562 (WT1+, PRAME+) tumor cell lines. Multiplex ddPCR simultaneously detected and discriminated the three TAA and the housekeeping gene ABL1. (B) Representative dot plot showing no transcript amplification in the No Template Control. WT1 (C), PRAME (D) and survivin (E) proteins were detected in the THP-1 leukemia cell line by Flow Cytometry. (F) All three TAA transcripts were detected in the THP-1 leukemia cell line by ddPCR. The appearance of double positive reflects artifact from the high mRNA copy numbers in the undiluted tumor which exceed the optimal threshold. (G) Minimal levels of the three transcripts were detected in peripheral blood of healthy donors.
Figure 2
Figure 2
Multiplex ddPCR derived TAA/ABL1 ratios in adult and pediatric patients of diverse acute leukemia subtypes. Discrete clusters of ABL1-, and/or BIRC5-, and/or PRAME- and/or WT1-positive droplets were observed in MRD+ leukemia samples. (A) Representative bivariate dot plot from patient with progressive relapsed refractory leukemia, who was positive for all 3 TAA. Summary data in violin plots of WT1/ABL1 (B), PRAME/ABL1 (C) and BIRC5/ABL1 (D) ratios in healthy donors (n=19) and patients who had active leukemia (MRD+: minimal residual disease or greater (relapse) by standard of care test (n=19). Where multiple timepoints existed the highest TAA/ABL1 value chosen. The mean, lower quartile, upper quartile were: 0.0976, 0.004, 0.0499 for WT1, 0.1437, 0.0019, 0.0366 for PRAME, 0.296, 0.0362, and 0.2627 for BIRC5. Summary data of TAA/ABL1 positivity for active AML [(E); n = 10] and ALL [(F); n = 9] in peripheral blood using the timepoint with greatest number of TAA/ABL1 if there was a change over time. TAA: tumor-associated antigen. Statistics = Wilcoxon two-sample test, t approximation.
Figure 3
Figure 3
Blood and marrow TAA/ABL1 ratios in a patient with responsive acute leukemia. (A) Summary data of BIRC5/ABL1 positive ratios for patient ALL-02 in both blood (grey line) and bone marrow (orange line) during MRD+ active disease (d 21 relapse) and remission (day 100 confirmed by flow cytometry). Dotted line indicates healthy donor blood threshold value. Threshold for BM unknown. (B–E) Representative bivariate dot plots from ALL-02 BM (B) and PB (D) with 2% marrow blasts and during remission (BM: C; PB: E).
Figure 4
Figure 4
Serial blood TAA/ABL1 ddPCR levels in patients with clinical evidence of acute leukemia. Positive blood TAA/ABL1 ratios graphed over time for patients with clinical evidence of progressive disease (A) AML-10 and (B) AML-6. Solid lines denote patient blood sample data and dotted lines healthy donor threshold values. Representative raw data bivariate dot plots for graphs A and B show AML-10 in remission (C) and relapse (D), and AML-6 in remission (E) and relapse (F). AML, acute myeloid leukemia; HCT, hematopoietic cell transplant; PB, peripheral blood; BM, bone marrow; Solid lines = patient ratios. Dotted lines = healthy donor thresholds. Grey: BIRC5. Red: PRAME. Black: WT1. Black open circles: BCR/ABL1 clinical test.
Figure 5
Figure 5
Serial blood TAA/ABL1 ratios and relationship to standard of care tests. The number of TAA/ABL1 ratios above the threshold of normal increased over time with concomitant clinical disease progression in two patients ALL-03 ((A) and AML-09 (B). Positive blood TAA-ABL1 ratios graphed over time for two patients with clinical evidence of responsive disease AML-15 (C), and ALL-11 (D). Clinical BCR/ABL ratios for patient ALL-11 (E) who experienced disease response. Y axes plotted on log scale to separate data points for easy visualization. Solid lines connect patient blood ratios and dotted lines indicate healthy donor thresholds for BIRC5 (grey), PRAME (red) and WT1 (black). TAA, Tumor-Associated Antigen; MRD+, minimal residual disease positive (by clinical BCR/ABL PCR); NED, no evidence of disease; DZ+, clinical evidence of disease.
Figure 6
Figure 6
Overall survival by number of TAAs detected by ddPCR. Kaplan-Meier curve with log-rank test showing survival of patients as a function of the number of TAA detected in active leukemia via TAA/ABL1 ratios (A). Relapse free survival curve as a function of the one or more TAA detected in active leukemia via TAA/ABL1 ratios (B). Number at risk below the graph grouped as per the number with each TAA (0,1,2 and 3).

Similar articles

Cited by

References

    1. Zuanelli Brambilla C, Lobaugh SM, Ruiz JD, Dahi PB, Goldberg AD, Young JW, et al. . Relapse after allogeneic stem cell transplantation of acute myelogenous leukemia and myelodysplastic syndrome and the importance of second cellular therapy. Transplant Cell Ther (2021) 27(9):771 e1– e10. doi: 10.1016/j.jtct.2021.05.011 - DOI - PMC - PubMed
    1. Styczynski J, Tridello G, Koster L, Iacobelli S, van Biezen A, van der Werf S, et al. . Death after hematopoietic stem cell transplantation: Changes over calendar year time, infections and associated factors. Bone marrow Transplant (2020) 55(1):126–36. doi: 10.1038/s41409-019-0624-z - DOI - PMC - PubMed
    1. Heuser M, Freeman SD, Ossenkoppele GJ, Buccisano F, Hourigan CS, Ngai LL, et al. . Update on MRD in acute myeloid leukemia: A consensus document from the European LeukemiaNet MRD working party. Blood (2021) 138(26):2753–67. doi: 10.1182/blood.2021013626 - DOI - PMC - PubMed
    1. Bastos-Oreiro M, Perez-Corral A, Martinez-Laperche C, Bento L, Pascual C, Kwon M, et al. . Prognostic impact of minimal residual disease analysis by flow cytometry in patients with acute myeloid leukemia before and after allogeneic hemopoietic stem cell transplantation. Eur J haematol (2014) 93(3):239–46. doi: 10.1111/ejh.12336 - DOI - PubMed
    1. Ravandi F, Walter RB, Freeman SD. Evaluating measurable residual disease in acute myeloid leukemia. Blood Adv (2018) 2(11):1356–66. doi: 10.1182/bloodadvances.2018016378 - DOI - PMC - PubMed

Publication types