. 2022 Sep 30:13:1021935.
doi: 10.3389/fimmu.2022.1021935. eCollection 2022.

Crosstalk of necroptosis and pyroptosis defines tumor microenvironment characterization and predicts prognosis in clear cell renal carcinoma

Affiliations

Crosstalk of necroptosis and pyroptosis defines tumor microenvironment characterization and predicts prognosis in clear cell renal carcinoma

Liangmin Fu et al. Front Immunol. .

Abstract

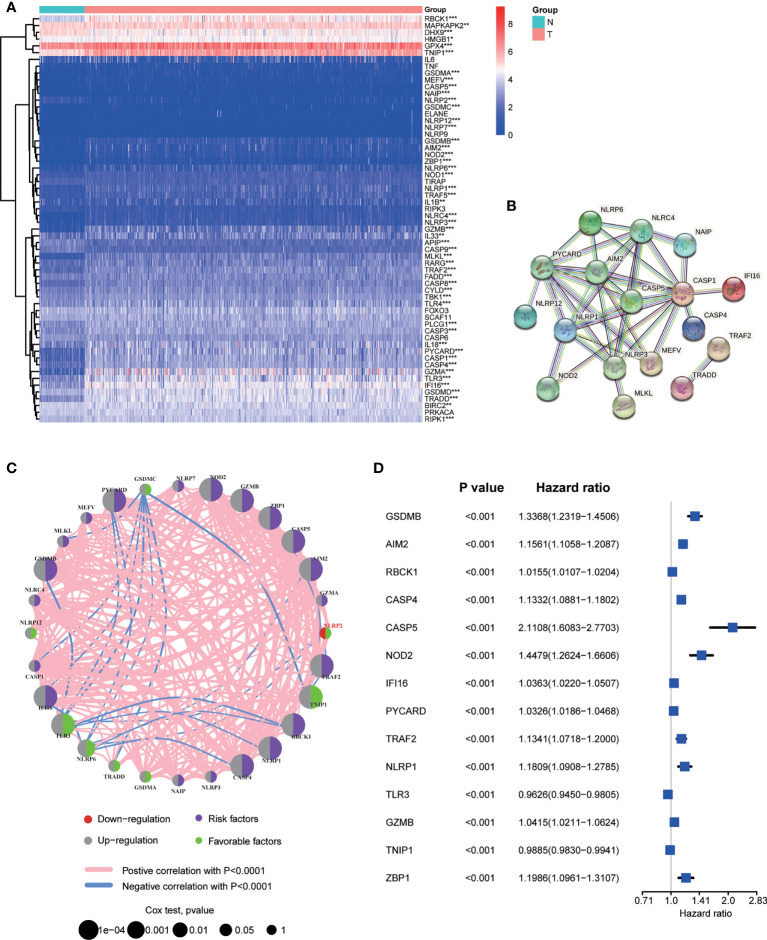
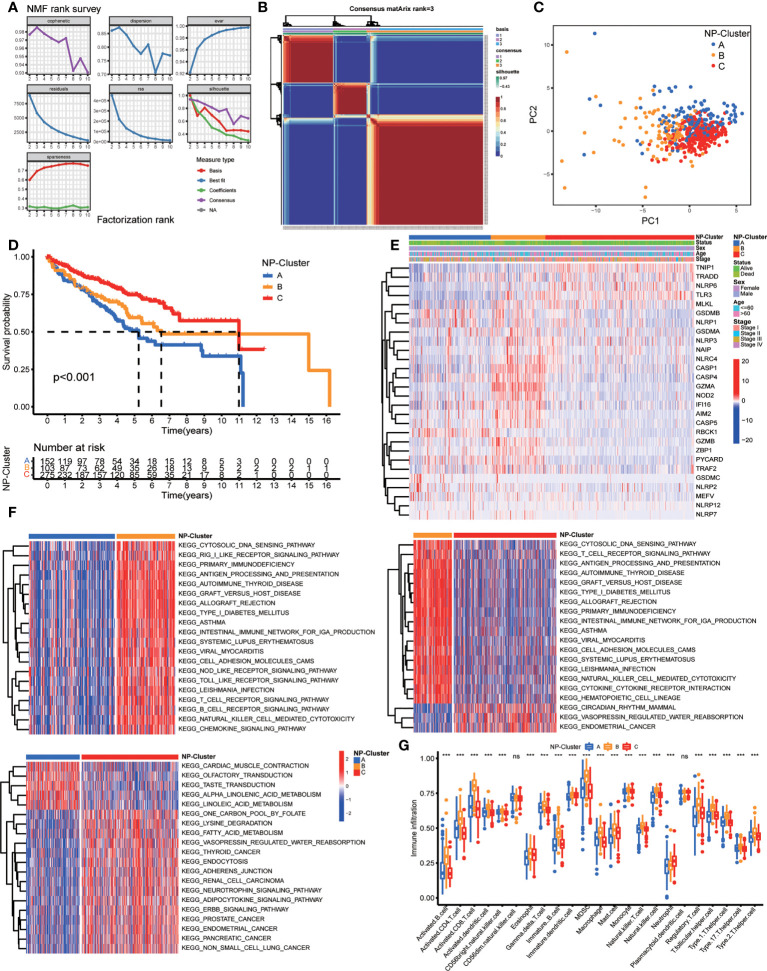
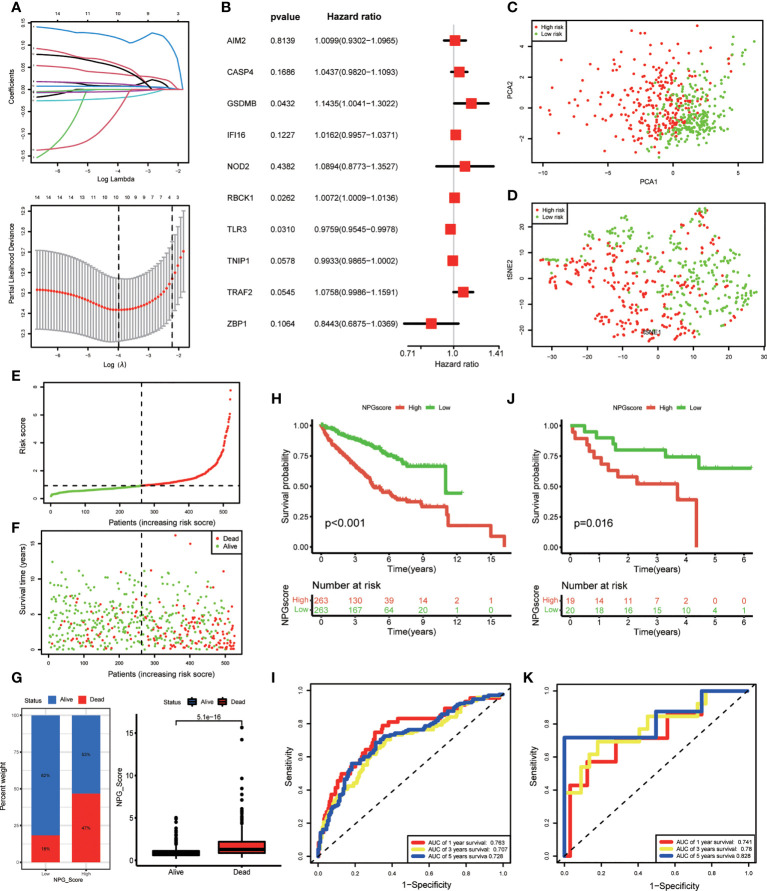
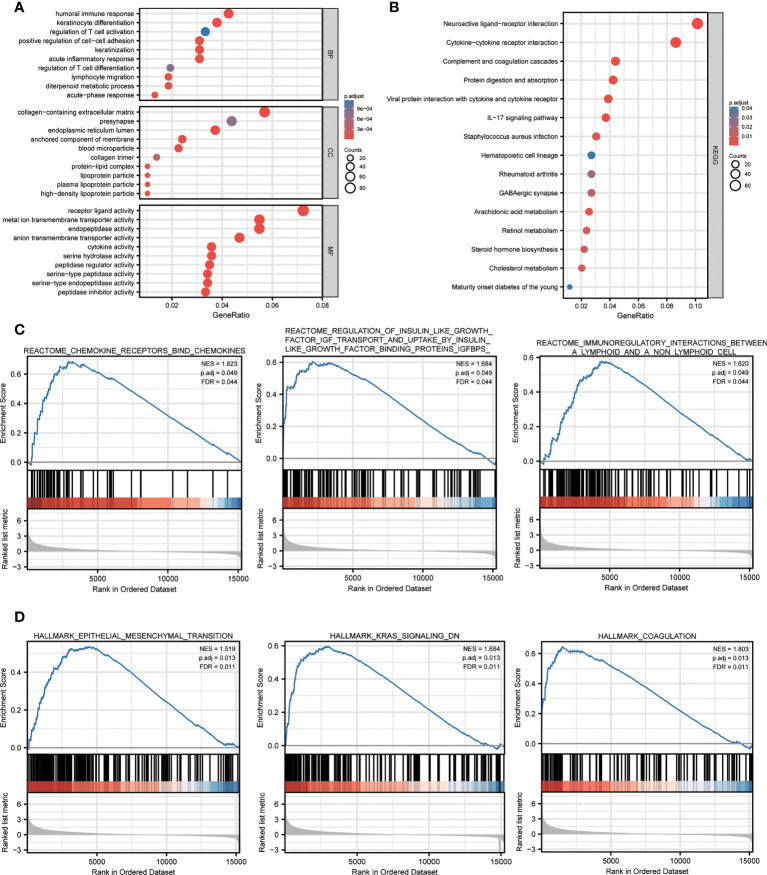
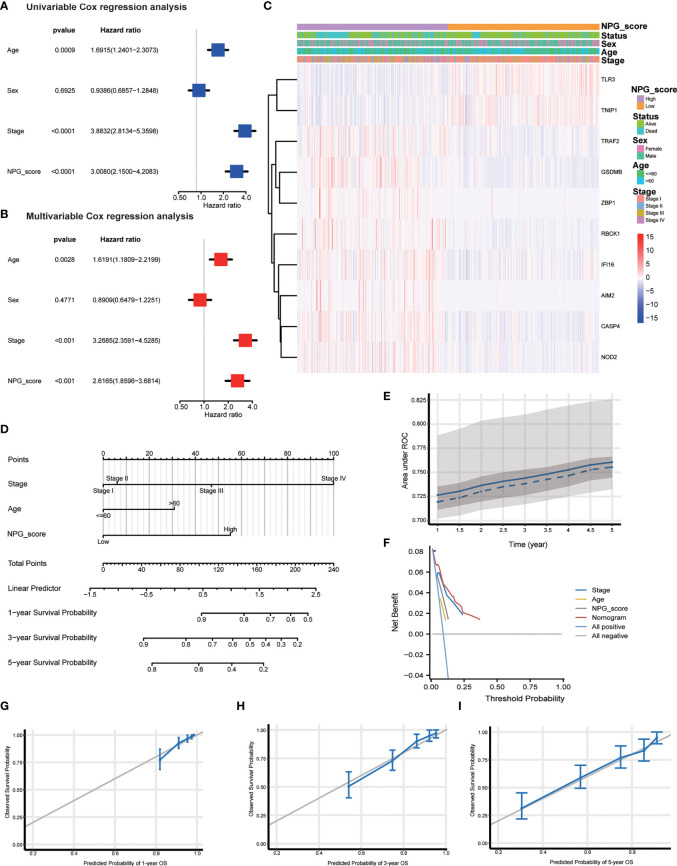
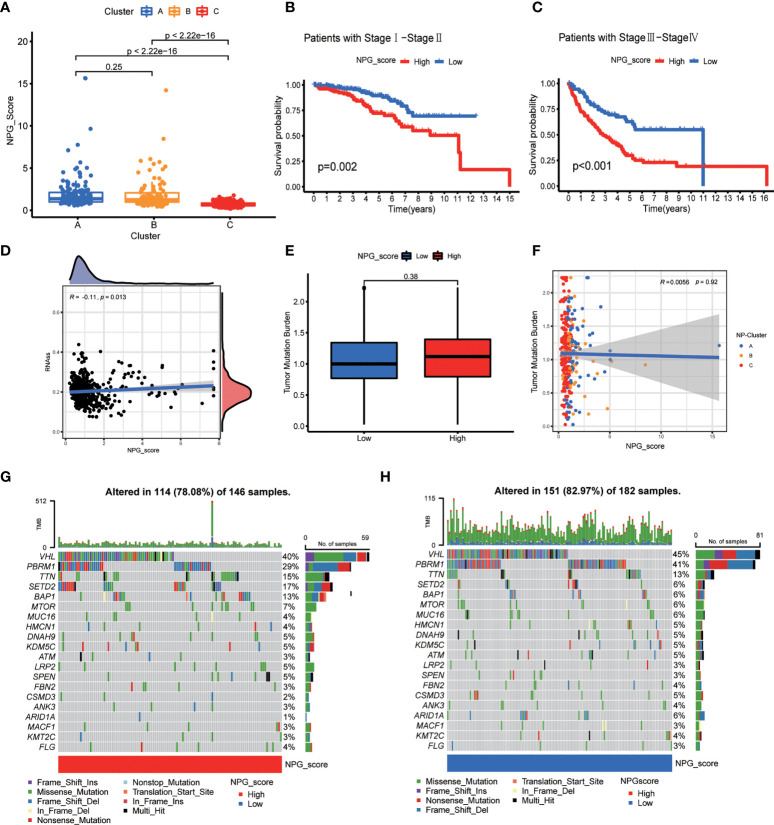
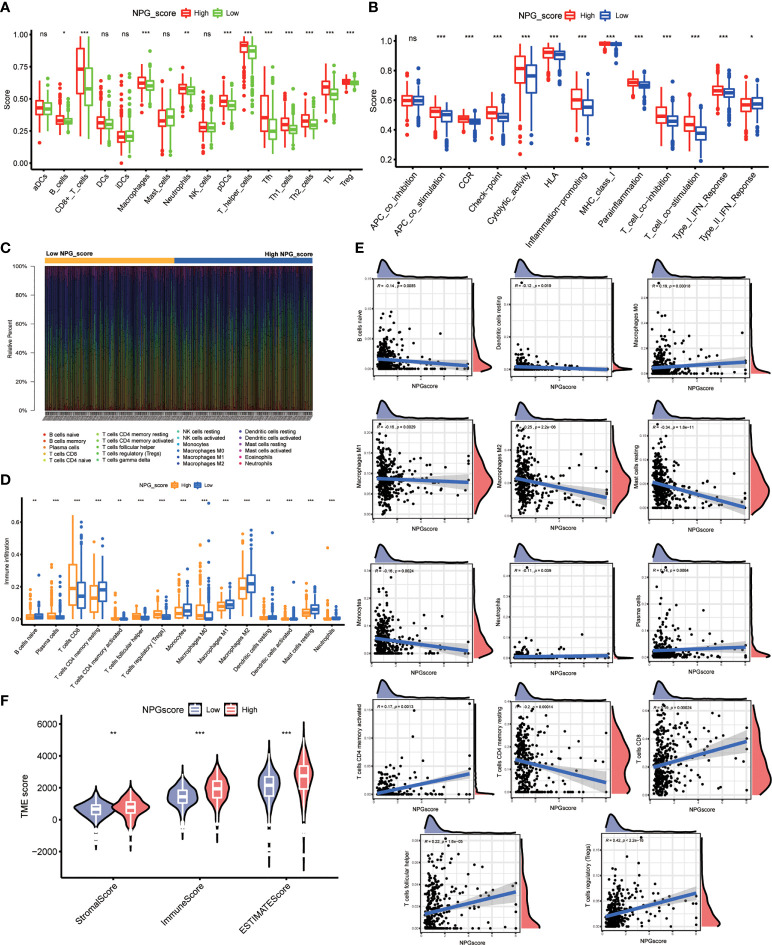
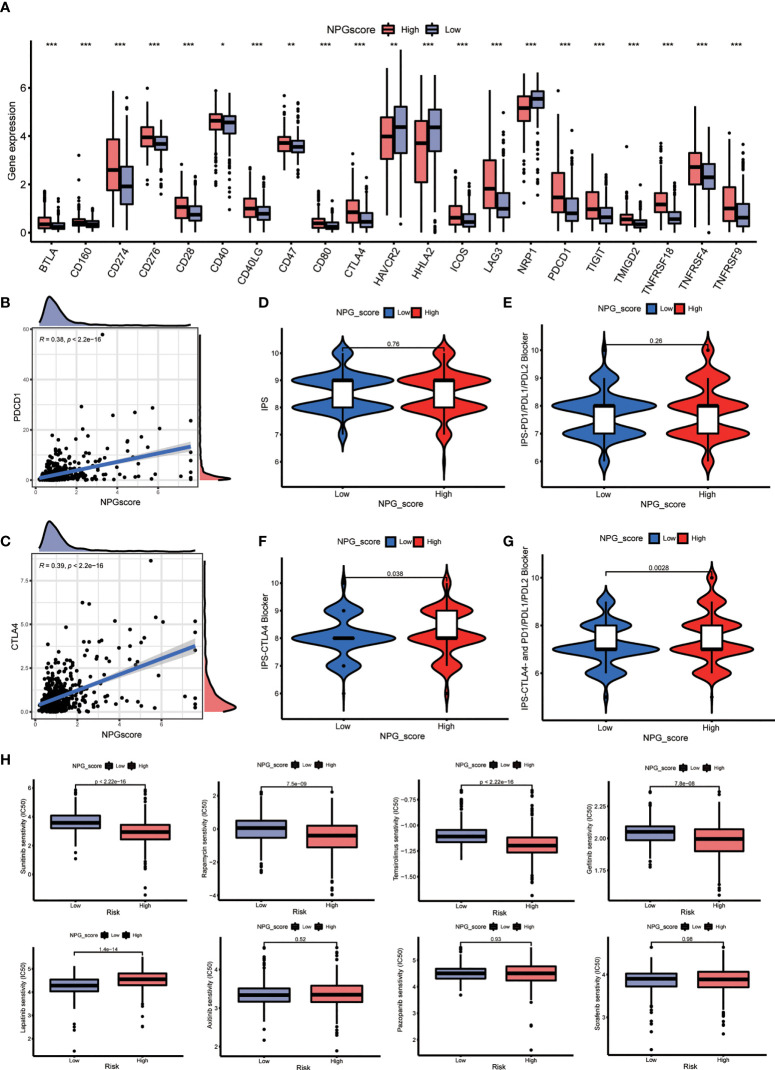
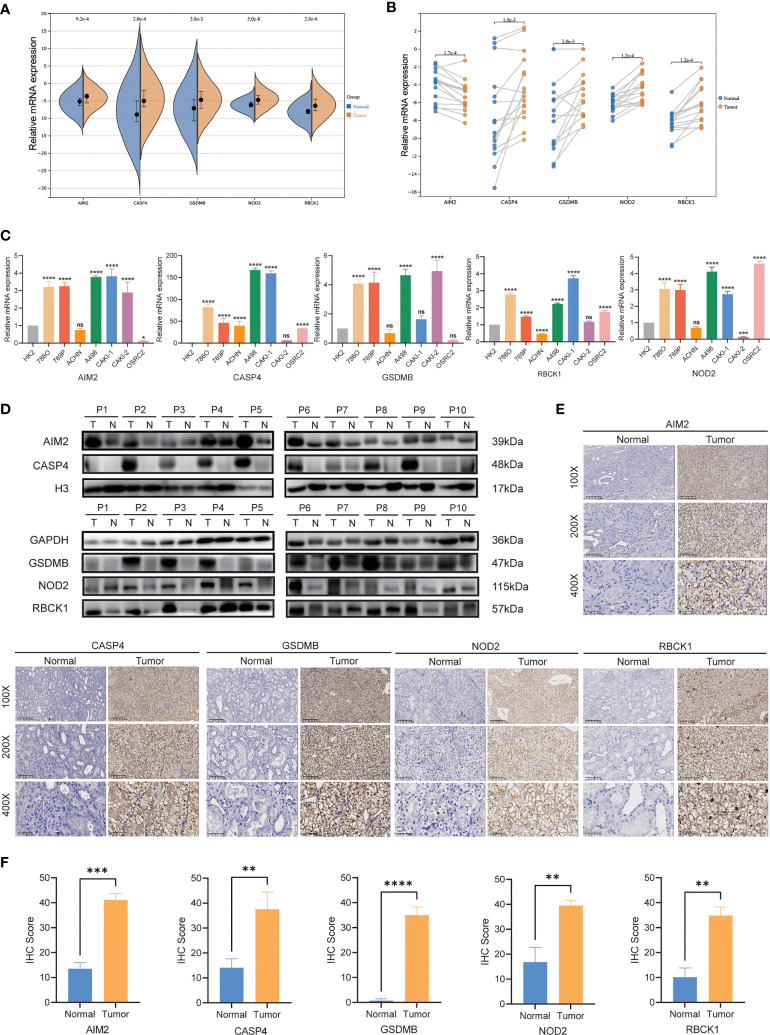
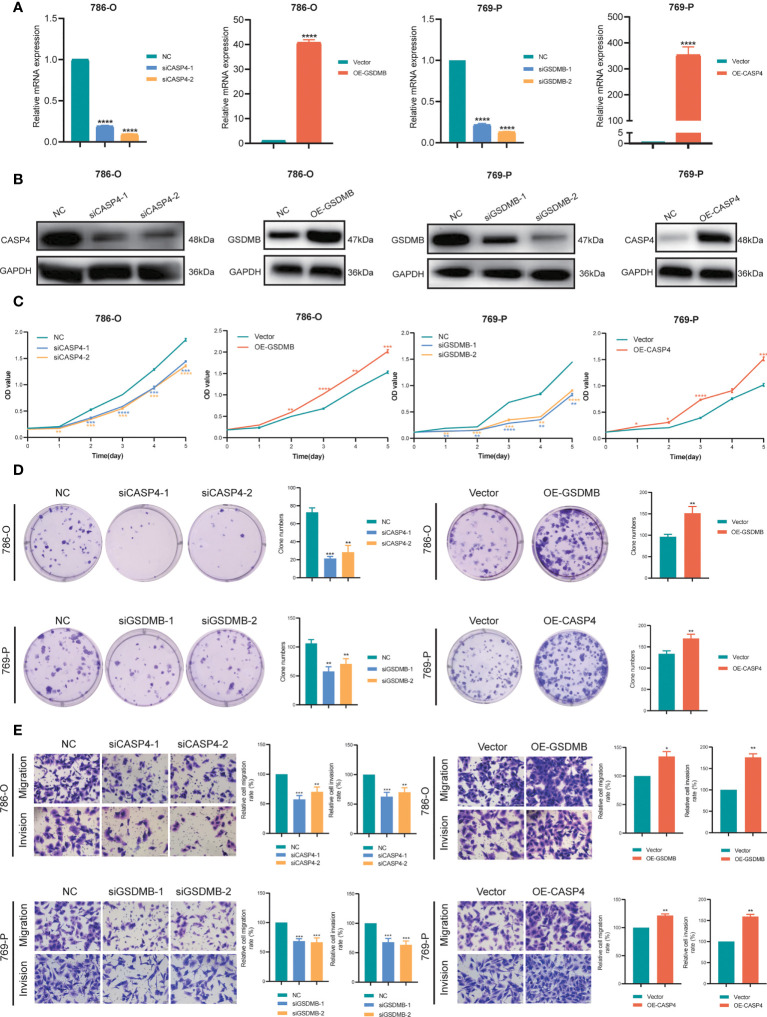
Pyroptosis and necroptosis are two recently identified forms of immunogenic cell death in the tumor microenvironment (TME), indicating a crucial involvement in tumor metastasis. However, the characteristics of necroptosis and pyroptosis that define tumor microenvironment and prognosis in ccRCC patients remain unknown. We systematically investigated the transcriptional variation and expression patterns of Necroptosis and Pyroptosis related genes (NPRGs). After screening the necroptosis-pyroptosis clusters, the potential functional annotation for clusters was explored by GSVA enrichment analysis. The Necroptosis-Pyroptosis Genes (NPG) scores were used for the prognosis model construction and validation. Then, the correlations of NPG score with clinical features, cancer stem cell (CSC) index, tumor mutation burden (TMB), TME, and Immune Checkpoint Genes (ICGs) were also individually explored to evaluate the prognosis predictive values in ccRCC. Microarray screenings identified 27 upregulated and 1 downregulated NPRGs. Ten overall survival associated NPRGs were filtered to construct the NPG prognostic model indicating a better prognostic signature for ccRCC patients with lower NPG scores (P< 0.001), which was verified using the external cohort. Univariate and multivariate analyses along with Kaplan-Meier survival analysis demonstrated that NPG score prognostic model could be applied as an independent prognostic factor, and AUC values of nomogram from 1- to 5- year overall survival with good agreement in calibration plots suggested that the proposed prognostic signature possessed good predictive capabilities in ccRCC. A high-/sNPG score is proven to be connected with tumor growth and immune-related biological processes, according to enriched GO, KEGG, and GSEA analyses. Comparing patients with a high-NPG score to those with a low-NPG score revealed significant differences in clinical characteristics, growth and recurrence of malignancies (CSC index), TME cell infiltration, and immunotherapeutic response (P< 0.005), potentially making the NPG score multifunctional in the clinical therapeutic setting. Furthermore, AIM2, CASP4, GSDMB, NOD2, and RBCK1 were also found to be highly expressed in ccRCC cell lines and tumor tissues, and GASP4 and GSDMB promote ccRCC cells' proliferation, migration, and invasion. This study firstly suggests that targeting the NPG score feature for TME characterization may lend novel insights into its clinical applications in the prognostic prediction of ccRCC.

Keywords: clear cell renal cell carcinoma; necroptosis; prognosis; pyroptosis; tumor microenvironment.


Conflict of interest statement

The authors declare that the research was conducted in the absence of any commercial or financial relationships that could be construed as a potential conflict of interest. The reviewer HL declared a shared affiliation with the authors JL, ML and BC to the handling editor at the time of review.

Figures

Figure 1
Figure 1
Screening necroptosis and pyroptosis related genes (NPRGs) in ccRCC. (A) Heat map of 60 NPRGs. (B) PPI network for the cross talks of NPRGs according to STRING database (cross talk score = 0.9). (C) The association network landscape of differentially Expressed NPRGs (DE-NPRGs): red dot, down-regulation; grey dot, up-regulation; purple dot, risk factors; green dot, favourable factors; pink line, positive correlation with P < 0.001; blue line, negative correlation with P< 0.0001; the size of dots represents the significance of the correlation. (D) Univariate Cox regression analysis of candidate NPRGs with the 14 ones were significantly selected in the model (P < 0.001).
Figure 2
Figure 2
Risk classifications and related functional annotation based on the DE-NPRGs. (A, B) Consensus clustering matrix in ccRCC patients with best cluster number of three (k = 3). (C) ccRCC patients in TCGA cohort were stratified into three groups. (D) Kaplan-Meier curves for the three clusters. (E) Heatmap showing the clinicopathologic characteristics formed by DE-NPRGs and clinical features in three NP-clusters. (F) Heatmap of GSVA enrichment scores comparisons for the differentially expressed pathways in three NP-clusters. (G) Comparison of ssGSEA scores for immune infiltration of ccRCC in three NP-clusters and results visualization. *** P< 0.001; ns, no significance.
Figure 3
Figure 3
NPG prognostic model construction and validation. (A) Cross-verification for fine-tune the selection of parameters in LASSSO regression and 10 NPRGs were obtained in TCGA cohort for the NPG prognostic model construction. (B) Multivariate Cox regression analysis of NPRGs for NPG score calculation in TCGA cohort. (C, D) PCA map and t-SNE plots for high- and low- risk groups based on the NPG score (red dot, high risk class; green dot, low risk class). (E, F) risk plot of NPG score The survival rate (low-NPG score group: on the left side of the dotted line; high-NPG score group: on the right side of the dotted line) and time (red dot, dead subjects; green dot, alive subjects) for each patient in TCGA cohort. (G) Correlation of NPG score and vital status of ccRCC patients. (H) Kaplan–Meier curves for comparison of NPG score risks between low-NPG score and high-NPG score groups in TCGA cohort. (I) ROC curves with the NPG score prediction efficiency in TCGA cohort. (J) Kaplan–Meier curves for comparison of NPG score risks between low-NPG score and high-NPG score groups in external validation cohort (GEO cohort). (K) ROC curves with the NPG score prediction efficiency in external validation cohort (GEO cohort).
Figure 4
Figure 4
Functional annotation of the DEGs between high- and low- NPG score groups. (A) The GO analysis with GO terms of biological processes, cell components, and molecular functions. (B) KEGG pathway enrichment analyses of DEGs between high- and low- NPG score groups. (C, D) GSEA analysis of tumor progression and immunity between low- and high- NPG score groups.
Figure 5
Figure 5
Independent prognostic validation and establish of nomogram. (A) Univariate cox regression for TCGA cohort based on the clinical characteristics (pathological stage, age, and sex) and NPG score. (B) Multivariate analysis for TCGA cohort. (C) Heatmap showing the clinicopathologic characteristics formed by 10 NPRGs and clinical features in low- and high- NPG score groups. (D) Nomogram. (E) ROC curves illustrating the prediction efficiency of nomogram (AUC, 0.72 to 0.76). (F) DCA curves illustrating the clinical effectiveness of the nomogram. (G–I) Nomogram to predict 1-, 3-, and 5- year overall survival rates of ccRCC patients. Calibration plots showed overall survival nomogram model to compare the nomogram-predicted probability (blue line) with ideal nomogram (grey line).
Figure 6
Figure 6
Correlation of NPG score with clinical features, CSC index, and TMB. (A) Comparison plot illustrating the differences of NPG score in three NP-Clusters. (B, C) Kaplan–Meier curves for comparison of NPG score risks between low-NPG score and high-NPG score groups by stratified analysis of pathological stages. (D) Correlation of NPG score and CSC index. (E, F) Tumor mutation burden analysis. (G, H) Landscape of tumor mutation burden between high- and low- NPG score groups.
Figure 7
Figure 7
Correlation of NPG score with TME cell infiltration. (A) ssGSEA analysis of NPG score and immune infiltration levels in ccRCC. (B) Comparison of immune-related functions scores in low- and high- NPG score groups. (C, D) Difference in immune cell infiltration levels evaluated by CIBERSORT in ccRCC. (E) The relationship of NPG score and different immune cell infiltration levels. (F) Correlation analysis between TME scores and NPG score in ccRCC *P < 0.05; ** P < 0.01; *** P< 0.001; ns, no significance.
Figure 8
Figure 8
Therapeutic response prediction. (A) Comparison the difference of ICGs expression between high- and low-NPG score groups. (B, C) The relationship of NPG score and PDCD1 and CTLA4. (D–G) Correlation analysis between NPG score and response to immunotherapy. (H) Comparison of the sensitivities to the chemotherapy drugs currently used for ccRCC treatment. *P < 0.05; ** P < 0.01; *** P < 0.001.
Figure 9
Figure 9
qRT-PCR, IHC and WB verification. (A, B) mRNA expression of AIM2, CASP4, GSDMB, NOD2, and RBCK1in ccRCC patients by qRT-PCR. (C) Levels of the mRNA expression in different cell lines as assessed by qRT-PCR analysis. (D) Protein expression of AIM2, CASP4, GSDMB, NOD2, and RBCK1 in ccRCC patients by Western blot. (E, F) Expression of AIM2, CASP4, GSDMB, NOD2, and RBCK1 makers in ccRCC tumor tissue and normal tissues by IHC. *P < 0.05; ** P < 0.01; *** P< 0.001; **** P< 0.001; ns, no significance.
Figure 10
Figure 10
Verification of CASP4 and GSDMB for proliferation, migration, and invasion in ccRCC. (A, B) Construction and verification of two siRNA specifically targeting at CASP4 (siCASP4-1, si-CASP4-2) and GSDMB (siGSDMB-1, siGSDMB-2) respectively, and overexpressing vector (OE-CASP4 and OE-GSDMB). (C, D) CCK-8 assays, and colony formation assays to detect ccRCC cell proliferation. (E) Transwell migration/invasion assay to analyse the ability of ccRCC cell migration and invasion. *P < 0.05; ** P < 0.01; *** P< 0.001; **** P< 0.001.

Similar articles

Cited by

References

    1. Sung H, Ferlay J, Siegel RL, Laversanne M, Soerjomataram I, Jemal A, et al. . Global cancer statistics 2020: GLOBOCAN estimates of incidence and mortality worldwide for 36 cancers in 185 countries. CA Cancer J Clin (2021) 71(3):209–49. doi: 10.3322/caac.21660 - DOI - PubMed
    1. Znaor A, Lortet-Tieulent J, Laversanne M, Jemal A, Bray F. International variations and trends in renal cell carcinoma incidence and mortality. Eur Urol (2015) 67(3):519–30. doi: 10.1016/j.eururo.2014.10.002 - DOI - PubMed
    1. Key statistics about kidney cancer . Available at: https://www.cancer.org/cancer/kidney-cancer/about/key-statistics.html.
    1. Kidney cancer: Statistics . Available at: https://www.cancer.net/cancer-types/kidney-cancer/statistics#:~:text=Thi....
    1. Xia C, Dong X, Li H, Cao M, Sun D, He S, et al. . Cancer statistics in China and united states, 2022: profiles, trends, and determinants. Chin Med J (Engl) (2022) 135(5):584–90. doi: 10.1097/CM9.0000000000002108 - DOI - PMC - PubMed

Publication types