

Malnutrition leads to increased inflammation and expression of tuberculosis risk signatures in recently exposed household contacts of pulmonary tuberculosis
- PMID: 36248906
- PMCID: PMC9554585
- DOI: 10.3389/fimmu.2022.1011166
Malnutrition leads to increased inflammation and expression of tuberculosis risk signatures in recently exposed household contacts of pulmonary tuberculosis
Erratum in
-
Corrigendum: Malnutrition leads to increased inflammation and expression of tuberculosis risk signatures in recently exposed household contacts of pulmonary tuberculosis.Front Immunol. 2022 Oct 20;13:1064883. doi: 10.3389/fimmu.2022.1064883. eCollection 2022. Front Immunol. 2022. PMID: 36341454 Free PMC article.
Abstract
Background: Most individuals exposed to Mycobacterium tuberculosis (Mtb) develop latent tuberculosis infection (LTBI) and remain at risk for progressing to active tuberculosis disease (TB). Malnutrition is an important risk factor driving progression from LTBI to TB. However, the performance of blood-based TB risk signatures in malnourished individuals with LTBI remains unexplored. The aim of this study was to determine if malnourished and control individuals had differences in gene expression, immune pathways and TB risk signatures.
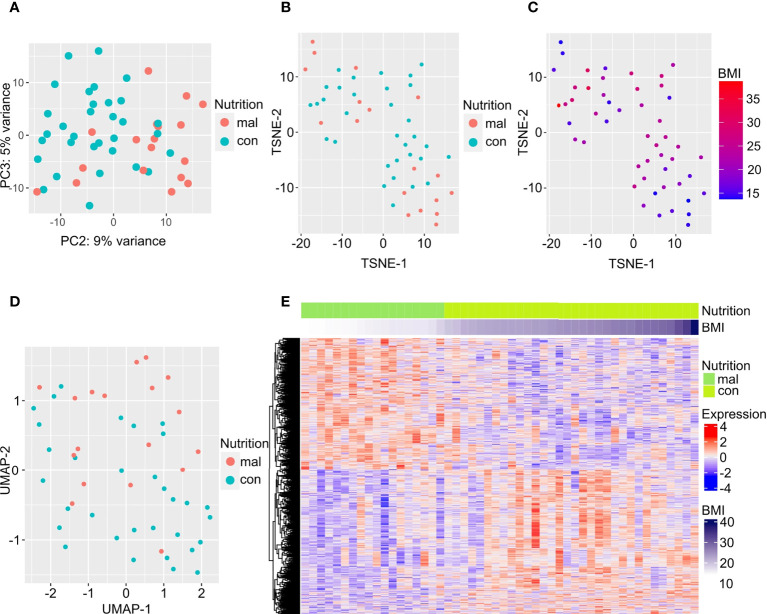
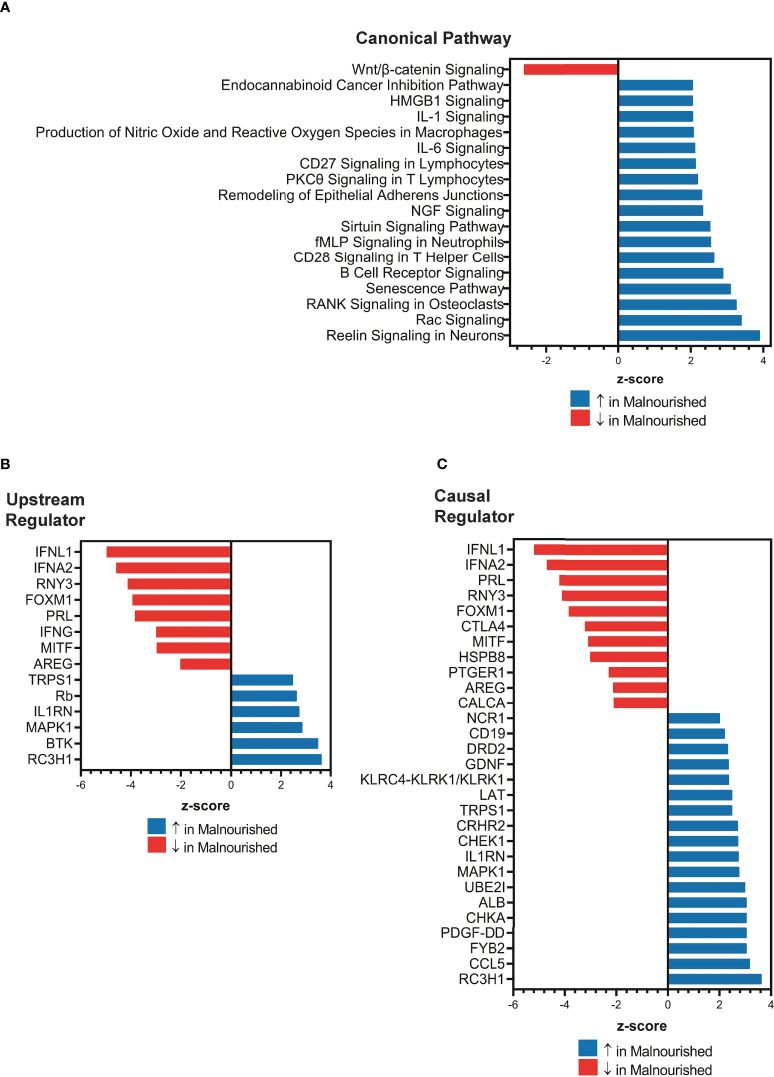
Methods: We utilized data from 50 tuberculin skin test positive household contacts of persons with TB - 18 malnourished participants (body mass index [BMI] < 18.5 kg/m2) and 32 controls (individuals with BMI ≥ 18.5 kg/m2). Whole blood RNA-sequencing was conducted to identify differentially expressed genes (DEGs). Ingenuity Pathway Analysis was applied to the DEGs to identify top canonical pathways and gene regulators. Gene enrichment methods were then employed to score the performance of published gene signatures associated with progression from LTBI to TB.
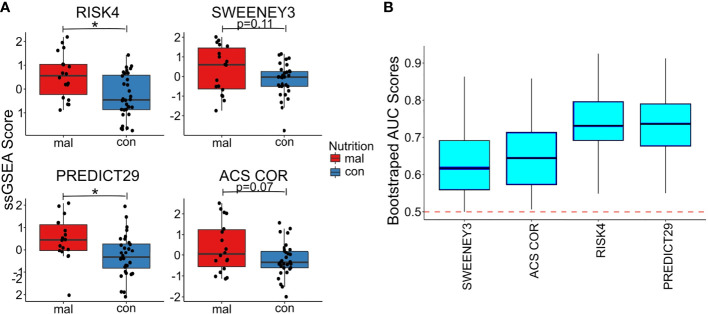
Results: Malnourished individuals had increased activation of inflammatory pathways, including pathways involved in neutrophil activation, T-cell activation and proinflammatory IL-1 and IL-6 cytokine signaling. Consistent with known association of inflammatory pathway activation with progression to TB disease, we found significantly increased expression of the RISK4 (area under the curve [AUC] = 0.734) and PREDICT29 (AUC = 0.736) progression signatures in malnourished individuals.
Conclusion: Malnourished individuals display a peripheral immune response profile reflective of increased inflammation and a concomitant increased expression of risk signatures predicting progression to TB. With validation in prospective clinical cohorts, TB risk biomarkers have the potential to identify malnourished LTBI for targeted therapy.
Keywords: TB biomarkers; immunoregulation; inflammation; malnutrition; tuberculosis.
Copyright © 2022 VanValkenburg, Kaipilyawar, Sarkar, Lakshminarayanan, Cintron, Prakash Babu, Knudsen, Joseph, Horsburgh, Ellner, Narasimhan, Johnson, Hochberg and Salgame.
Conflict of interest statement
The authors declare that the research was conducted in the absence of any commercial or financial relationships that could be construed as a potential conflict of interest.
Figures
Similar articles
-
Cross-validation of existing signatures and derivation of a novel 29-gene transcriptomic signature predictive of progression to TB in a Brazilian cohort of household contacts of pulmonary TB.Tuberculosis (Edinb). 2020 Jan;120:101898. doi: 10.1016/j.tube.2020.101898. Epub 2020 Jan 7. Tuberculosis (Edinb). 2020. PMID: 32090859 Free PMC article.
-
Exploring T-cell metabolism in tuberculosis: development of a diagnostic model using metabolic genes.Eur J Med Res. 2025 Jun 16;30(1):483. doi: 10.1186/s40001-025-02768-0. Eur J Med Res. 2025. PMID: 40524207 Free PMC article.
-
Gene expression profiling identifies candidate biomarkers for new latent tuberculosis infections. A cohort study.PLoS One. 2022 Sep 28;17(9):e0274257. doi: 10.1371/journal.pone.0274257. eCollection 2022. PLoS One. 2022. PMID: 36170228 Free PMC article.
-
Host-response-based gene signatures for tuberculosis diagnosis: A systematic comparison of 16 signatures.PLoS Med. 2019 Apr 23;16(4):e1002786. doi: 10.1371/journal.pmed.1002786. eCollection 2019 Apr. PLoS Med. 2019. PMID: 31013272 Free PMC article.
-
[Characteristics of a diagnostic method for tuberculosis infection based on whole blood interferon-gamma assay].Kekkaku. 2006 Nov;81(11):681-6. Kekkaku. 2006. PMID: 17154047 Review. Japanese.
Cited by
-
Integrative analysis of multimodal patient data identifies personalized predictors of tuberculosis treatment prognosis.iScience. 2024 Jan 29;27(2):109025. doi: 10.1016/j.isci.2024.109025. eCollection 2024 Feb 16. iScience. 2024. PMID: 38357663 Free PMC article.
-
New genetic biomarkers from transcriptome RNA-sequencing for Mycobacterium tuberculosis complex and Mycobacterium avium complex infections by bioinformatics analysis.Sci Rep. 2024 Jul 29;14(1):17385. doi: 10.1038/s41598-024-68242-9. Sci Rep. 2024. PMID: 39075154 Free PMC article.
-
Latent Tuberculosis: Challenges in Diagnosis and Treatment, Perspectives, and the Crucial Role of Biomarkers.Curr Microbiol. 2023 Oct 27;80(12):392. doi: 10.1007/s00284-023-03491-x. Curr Microbiol. 2023. PMID: 37884822 Review.
-
Inclusion of patient-centered, non-microbiological endpoints and biomarkers in tuberculosis drug trials.Front Antibiot. 2025 May 22;4:1570989. doi: 10.3389/frabi.2025.1570989. eCollection 2025. Front Antibiot. 2025. PMID: 40475250 Free PMC article. Review.
-
COVID-19 and Tuberculosis: Unveiling the Dual Threat and Shared Solutions Perspective.J Clin Med. 2023 Jul 19;12(14):4784. doi: 10.3390/jcm12144784. J Clin Med. 2023. PMID: 37510899 Free PMC article.
References
-
- World health organization, global tuberculosis report 2021 (2021). Available at: https://www.who.int/teams/global-tuberculosis-programme/tb-reports/globa....
-
- WHO . WHO consolidated guidelines on tuberculosis: Module 2: screening - systematic screening for tuberculosis disease. Geneva: World Health Organization: (2021). - PubMed
-
- Bhargava A, Bhargava M, Beneditti A, Kurpad A. Attributable is preventable: Corrected and revised estimates of population attributable fraction of TB related to undernutrition in 30 high TB burden countries. J Clin Tuberc Other Mycobact Dis (2022) 27:100309. doi: 10.1016/j.jctube.2022.100309 - DOI - PMC - PubMed
Publication types
MeSH terms
Substances
Grants and funding
LinkOut - more resources
Full Text Sources
Medical
Molecular Biology Databases