. 2022 Sep 30:13:869061.
doi: 10.3389/fimmu.2022.869061. eCollection 2022.

Metabolic-related gene pairs signature analysis identifies ABCA1 expression levels on tumor-associated macrophages as a prognostic biomarker in primary IDHWT glioblastoma

Affiliations

Metabolic-related gene pairs signature analysis identifies ABCA1 expression levels on tumor-associated macrophages as a prognostic biomarker in primary IDHWT glioblastoma

Shiqun Wang et al. Front Immunol. .

Abstract

Background: Although isocitrate dehydrogenase (IDH) mutation serves as a prognostic signature for routine clinical management of glioma, nearly 90% of glioblastomas (GBM) patients have a wild-type IDH genotype (IDHWT) and lack reliable signatures to identify distinct entities.

Methods: To develop a robust prognostic signature for IDHWT GBM patients, we retrospectively analyzed 4 public datasets of 377 primary frozen tumor tissue transcriptome profiling and clinical follow-up data. Samples were divided into a training dataset (204 samples) and a validation (173 samples) dataset. A prognostic signature consisting of 21 metabolism-related gene pairs (MRGPs) was developed based on the relative ranking of single-sample gene expression levels. GSEA and immune subtype analyses were performed to reveal differences in biological processes between MRGP risk groups. The single-cell RNA-seq dataset was used to examine the expression distribution of each MRG constituting the signature in tumor tissue subsets. Finally, the association of MRGs with tumor progression was biologically validated in orthotopic GBM models.

Results: The metabolic signature remained an independent prognostic factor (hazard ratio, 5.71 [3.542-9.218], P < 0.001) for stratifying patients into high- and low-risk levels in terms of overall survival across subgroups with MGMTp methylation statuses, expression subtypes, and chemo/ratio therapies. Immune-related biological processes were significantly different between MRGP risk groups. Compared with the low-risk group, the high-risk group was significantly enriched in humoral immune responses and phagocytosis processes, and had more monocyte infiltration and less activated DC, NK, and γδ T cell infiltration. scRNA-seq dataset analysis identified that the expression levels of 5 MRGs (ABCA1, HMOX1, MTHFD2, PIM1, and PTPRE) in TAMs increased with metabolic risk. With tumor progression, the expression level of ABCA1 in TAMs was positively correlated with the population of TAMs in tumor tissue. Downregulation of ABCA1 levels can promote TAM polarization towards an inflammatory phenotype and control tumor growth.

Conclusions: The metabolic signature is expected to be used in the individualized management of primary IDHWT GBM patients.

Keywords: ABCA1; metabolic-related gene pairs; primary glioblastoma; prognosis; tumor-associated macrophages; wild-type isocitrate dehydrogenase.


Conflict of interest statement

The authors declare that the research was conducted in the absence of any commercial or financial relationships that could be construed as a potential conflict of interest.

Figures

Figure 1
Figure 1
Construction and Evaluation of an Individualized Prognostic MRGPs Signature. (A) Overview of the study design. Four datasets were collected in the study, including one TCGA GBM dataset and three CGGA GBM datasets. The transformed gene expression matrix and clinical characteristics that removed nonconditional factors were integrated into a meta dataset and randomly divided into a training dataset (204 samples) and a validation dataset (173 samples). A total of 802 metabolism-related genes shared in the training and validation datasets were extracted for pairwise ranking in a single primary IDHWT GBM sample. A total of 135,026 gene pairs were generated for each sample to construct an individualized MRGP prognostic model. Principal component analysis (B) was performed to evaluate batch effects of different pairwise transformed datasets. Each color represents a dataset, and every point comes from a sample. LASSO regression was performed to construct a prognostic model based on MRGPs. (C) 10,000-fold cross-validation for LASSO variable selection was plotted. Each red point indicates a λ value. The vertical line on the left represents the minimum error, and the vertical line on the right represents the maximum value of λ. (D) LASSO coefficients of prognostic MRGPs. (E) The 1-year time-dependent ROC curve for the MRGP signature in the training dataset. AUC represents the area under the curve.
Figure 2
Figure 2
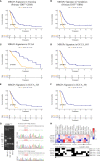
MRGPs Signature Stratifies the Overall Survival of IDHWT GBM With Different MRGP Risks. Kaplan–Meier curves of overall survival in IDHWT GBM patients in the MRGP risk groups. The overall survival of patients in the training (A) and validation (B) datasets was stratified by the MRGP risk score. The overall survival of IDHWT GBM in TCGA (C), CGGA_693 (D), CGGA_325 (E), and CGGA_301 (F) datasets was stratified into high- and low-risk groups based on MRGP risk score (P values are all < 0.001, log-rank test). (G) Identification of IDH1 gene status in human GBM cells. No mutations were observed at the R132 site in the U87-MG and U251-MG cell lines. (H) Validation of the predictive efficacy of the MRGPI for human GBM cell lines. RT–PCR assays were performed to identify the expression levels of 38 MRGs relative to GAPDH in GBM cell lines and the control cell lines (HeLa S3, HEK293, and HA1800). The relative expression data between MRGs were used to calculate the risk level of cell lines in vitro. The cut-off value is equal to -0.211. GBM cell risk scores were all greater than the cut-off value (U87-MG = 0.284, U251-MG = 0.204), indicating high risk.
Figure 3
Figure 3
Kaplan–Meier Overall Survival Curve Analysis of the Responses of IDHWT GBM With Different MRGP Risks to Chemotherapy/Radiotherapy. Patients from the training and validation datasets were integrated into a meta-dataset. Patients receiving chemotherapy only (A), radiotherapy only (B), and radiotherapy combined with chemotherapy (C) were further divided into high- and low-risk groups based on the MRGP score. Kaplan–Meier overall survival curves were generated to show the risk stratification of the prognostic model. CI indicates the C-index, which was used to evaluate the accuracy of the prognostic model in datasets. The performance of the MRGP model in the combination therapy group (CI = 0.767, P < 0.001) was superior to that in the single therapy groups (Chem, CI = 0.738, P = 0.069; Radio, CI = 0.679, P < 0.001).
Figure 4
Figure 4
Differences in Immune Infiltration Profiles Between Risk Groups Defined by Metabolic Signature. (A) GSEA of MRGP risk groups in the meta dataset (P < 0.05). The top 20 GO biological processes are shown. Multiple GO biological processes related to immunology, including immunoglobulin-mediated responses, were enriched in high-risk patients. (B, C) xCELL (B) and ESTIMATE (C) analyses of tumor purity between MRGP risk groups in the meta dataset. No significant differences between risk groups were observed (Mann–Whitney test). (D) Pearson correlation heatmaps of the expression of 38 MRGs and tumor purity in the risk groups of the meta-dataset. Value > 0 indicates that gene expression is positively correlated with tumor purity, indicating less immune infiltration. *P < 0.05; **P < 0.01. (E) xCell heatmap of the abundance of 64 immune and stroma cells in IDHWT GBM patients within risk groups in the meta dataset. (F) CIBERSORT analysis of the abundance of 22 immune cells in IDHWT GBM patients within risk groups in the meta dataset. (G) Immune cell subtypes significantly different between risk groups. Data is related to (E, F). # indicates the same immune subtype in xCell and CIBERSORT analyses. The difference between risk groups was calculated by the Mann–Whitney test (*P < 0.05, **P < 0.01, ***P < 0.001, ****P < 0.0001).
Figure 5
Figure 5
Differences in the Expression Distribution of 38 MRGs Between Risk Groups in the Single-cell RNA-seq IDHWT GBM Dataset. The risk level of each sample in the single-cell RNA-seq IDHWT GBM dataset (n = 28) was defined based on the relative expression distribution of the 38 MRGs ( Figure S8 ). The data indicated that four main cell types are present in GBM tissue: macrophages, malignancies, oligodendrocytes, and T cells. (A) Overall expression distribution of signature genes (all 38 MRGs) in four main cell types. (B) Expression distribution of 38 MRGs in four main cell types. (C) Expression alterations of 38 MRGs in four main cell types with increased metabolic risk. (D) Protein–protein interaction network of the 38 MRGs. The thickness of the line indicates the level of the combined score (0.4~1.0). Red indicates MRGs that are differentially expressed in macrophages between different risk groups (|△ robust z score| > 0.5, (C). Blue indicates the MRG in malignant cells. Green indicates the MRG in oligodendrocytes. Purple indicates the MRG in T cells.
Figure 6
Figure 6
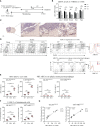
The Expression Level of ABCA1 in TAMs Positively Correlated with the Population of TAMs with IDHWT GBM Tumor Progression. (A) Experimental setup to study the links between MRGs expression in macrophage and tumor progression. (B) Quantitative analysis of mRNA expression levels of 5 MRGs in TAMs with tumor progression. C57 mice were intracranially inoculated with GL261 cells. On day 7, day 14 and day 21, mice were sacrificed and collected tumor tissues. TAMs were isolated from tumors by anti-F4/80 microbeads and subjected to qPCR to detect mRNA expression (n = 3). (C) Immunohistochemical analysis of the expression levels of ABCA1 in mouse tumor and normal brain tissue. (D, E) Representative flow cytometry plots (D) and quantitative analysis (E) of TAMs and peripherally splenic monocytes/macrophage ABCA1 expression levels with tumor progression. Orthotopic tumors were collected on days 7, 14 and 21 after tumor inoculation. n = 8. f-g: Quantitative analysis of TAM populations (F) and pearson correlation analysis of TAM populations and TAM ABCA1 expression levels (G). Data is related to (D, E). The difference between risk groups was calculated by the Mann–Whitney test (NS, no statistical significance, *P < 0.05, **P < 0.01, ***P < 0.001, ****P < 0.0001).
Figure 7
Figure 7
Pharmacological Inhibition of ABCA1 Enhances the Inflammatory Polarization of TAMs In Vivo(A): Quantification of ABCA1 expression in cholesterol-treated BMDMs ex vivo. BMDMs were treated with the indicated concentrations of cholesterol for 24 h. Cells were harvested and FCM was performed to identify the expression level of ABCA1 (n = 3). (B, C): Quantification of ABCA1 expression (B) and CD86 and CD206 expression (C) in lovastatin-treated TAMs ex vivo. TAMs were treated with the indicated concentrations of lovastatin for 24 h. FCM was performed to identify these molecular expressions. (D): Experimental setup of lovastatin-treated murine IDHWT GBM model. Eight mice per group. (E, F): Representative flow cytometry plots (E) and quantification of ABCA1 expression levels in TAMs (F). (G–J): Representative flow cytometry plots (G) and quantification of TAM functional polarization (H–J). ARG1 (H) were identified as anti-inflammatory macrophage markers; IFN-γ (I) and TNF-α (J) were identified as inflammatory macrophage markers. (K–M): Experimental setup (K) and tumor growth and survival monitoring (L, M) of lovastatin-treated murine GL261IDH-WT-Luc model. Eight mice per group. The difference between risk groups was calculated by the Mann–Whitney test and log-rank test (NS, no statistical significance, *P < 0.05, **P < 0.01, ***P < 0.001, ****P < 0.0001).

Similar articles

Cited by

References

    1. Louis DN, Perry A, Reifenberger G, von Deimling A, Figarella-Branger D, Cavenee WK, et al. . The 2016 world health organization classification of tumors of the central nervous system: A summary. Acta Neuropathol (2016) 131(6):803–20. doi: 10.1007/s00401-016-1545-1 - DOI - PubMed
    1. Reifenberger G, Wirsching HG, Knobbe-Thomsen CB, Weller M. Advances in the molecular genetics of gliomas - implications for classification and therapy. Nat Rev Clin Oncol (2017) 14(7):434–52. doi: 10.1038/nrclinonc.2016.204 - DOI - PubMed
    1. Stupp R, Mason WP, van den Bent MJ, Weller M, Fisher B, Taphoorn MJ, et al. . Radiotherapy plus concomitant and adjuvant temozolomide for glioblastoma. N Engl J Med (2005) 352(10):987–96. doi: 10.1056/NEJMoa043330 - DOI - PubMed
    1. Simon M, Hosen I, Gousias K, Rachakonda S, Heidenreich B, Gessi M, et al. . TERT promoter mutations: A novel independent prognostic factor in primary glioblastomas. Neuro Oncol (2015) 17(1):45–52. doi: 10.1093/neuonc/nou158 - DOI - PMC - PubMed
    1. Cheng Q, Huang C, Cao H, Lin J, Gong X, Li J, et al. . A novel prognostic signature of transcription factors for the prediction in patients with GBM. Front Genet (2019) 10:906. doi: 10.3389/fgene.2019.00906 - DOI - PMC - PubMed

Publication types