

A novel cuproptosis-related molecular pattern and its tumor microenvironment characterization in colorectal cancer
- PMID: 36248908
- PMCID: PMC9561547
- DOI: 10.3389/fimmu.2022.940774
A novel cuproptosis-related molecular pattern and its tumor microenvironment characterization in colorectal cancer
Abstract
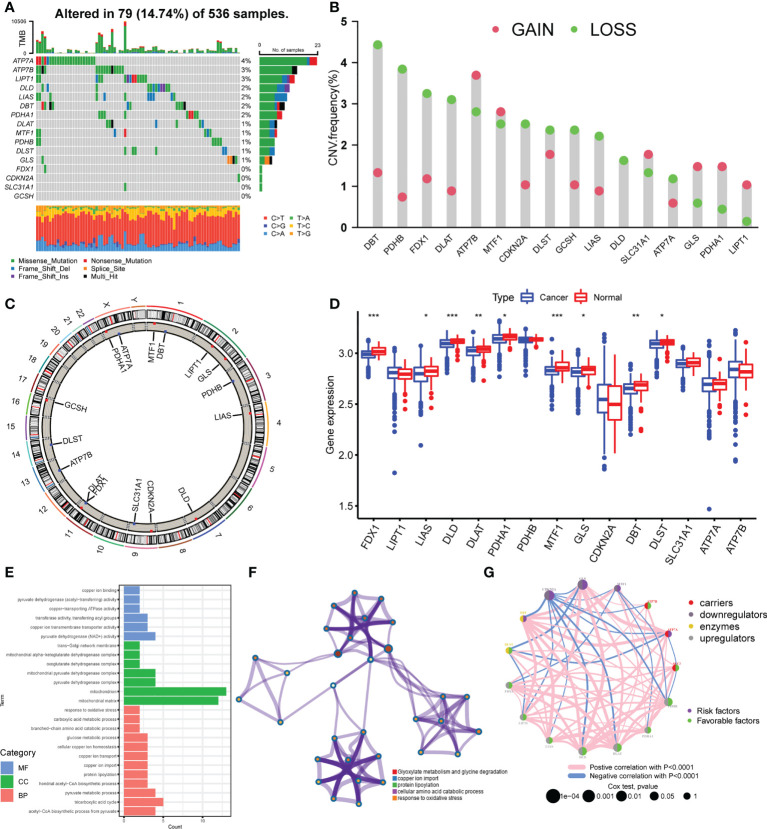
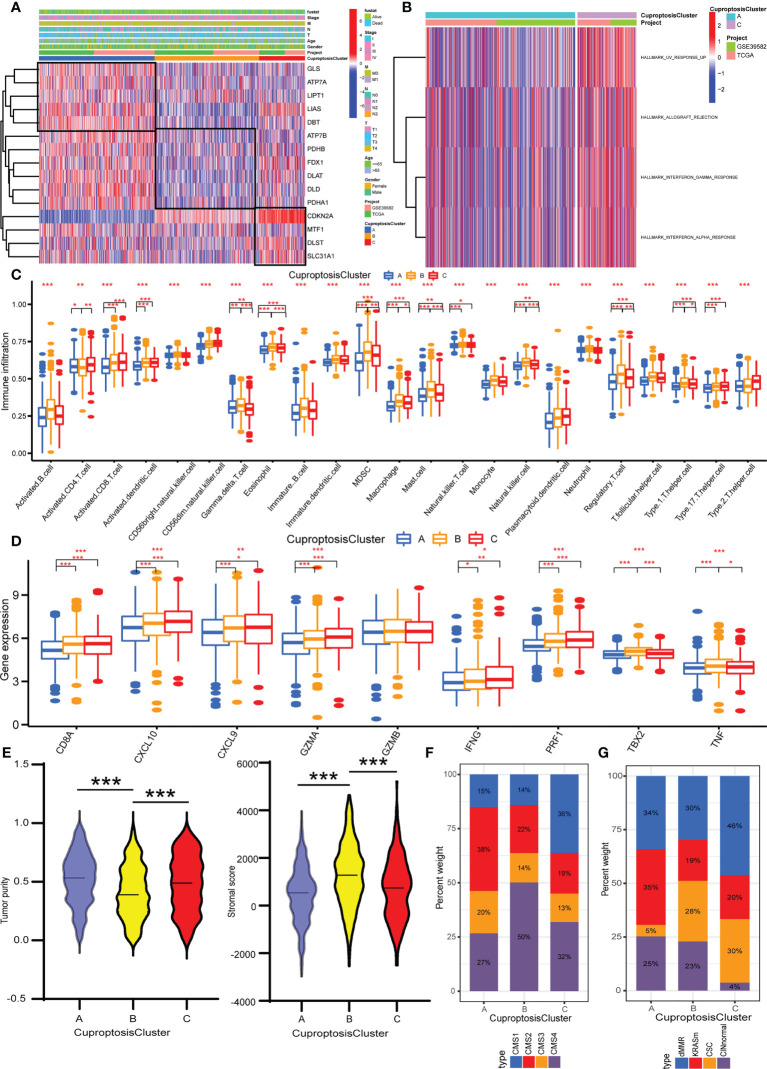
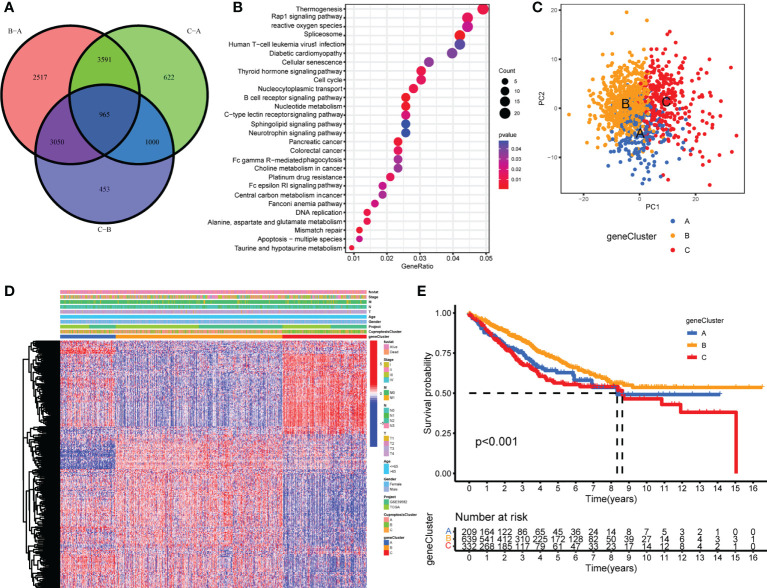
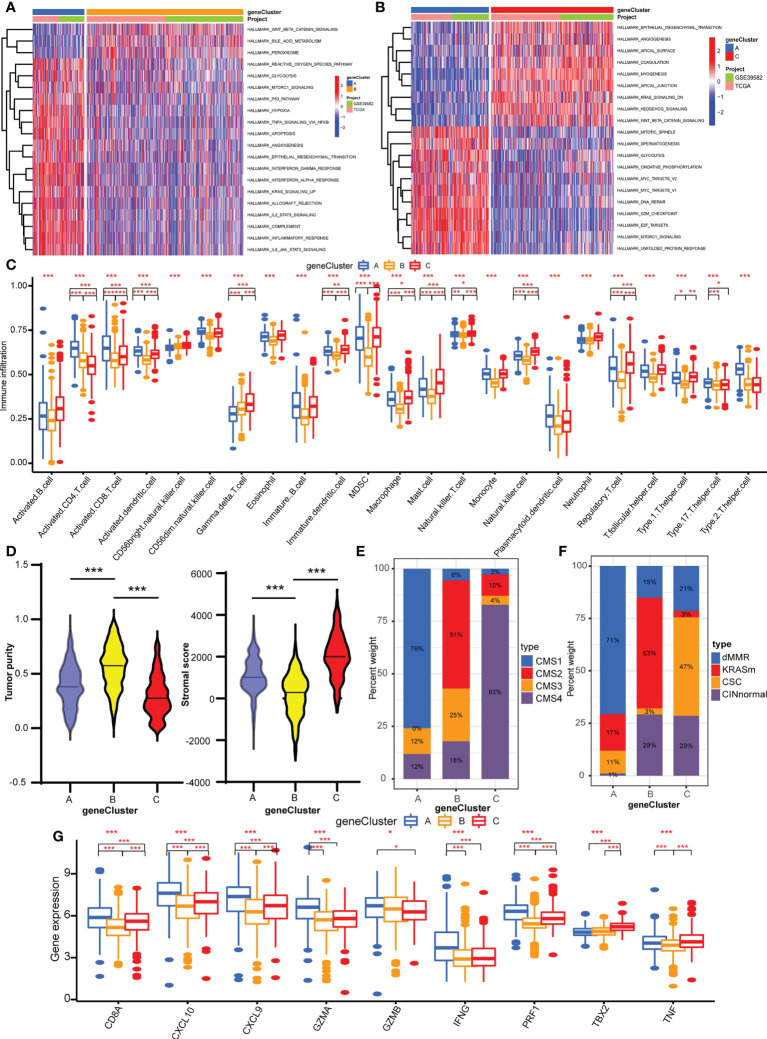
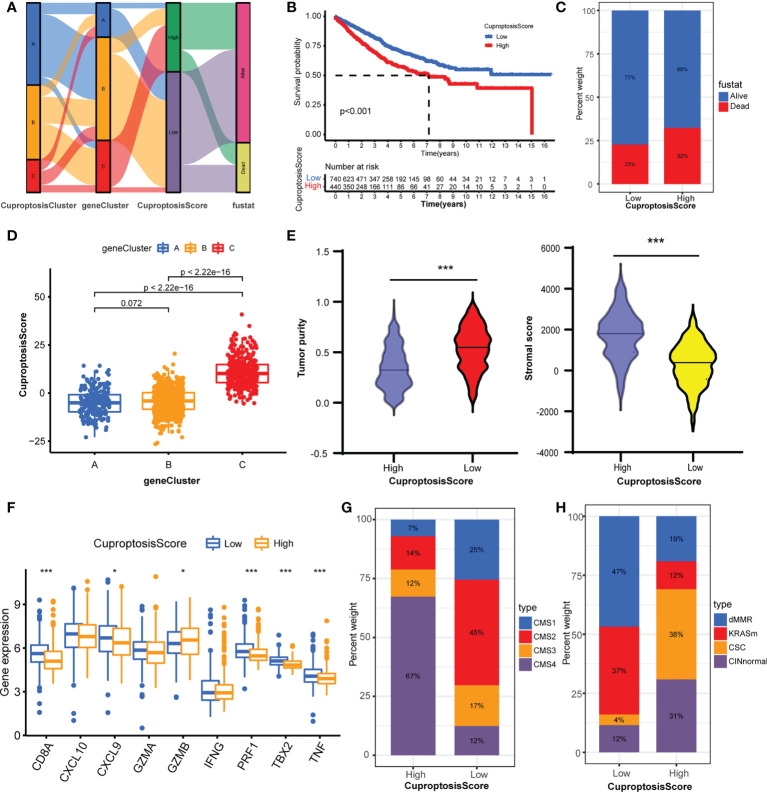
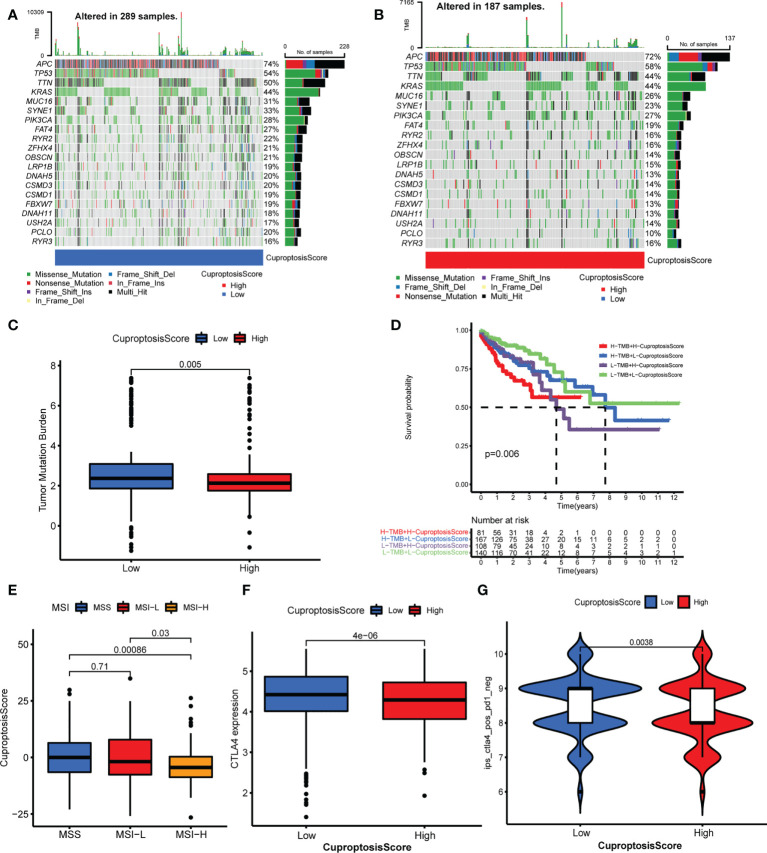
Cuproptosis, or copper-induced cell death, has been reported as a novel noncanonical form of cell death in recent times. However, the potential roles of cuproptosis in the alteration of tumor clinicopathological features and the formation of a tumor microenvironment (TME) remain unclear. In this study, we comprehensively analyzed the cuproptosis-related molecular patterns of 1,274 colorectal cancer samples based on 16 cuproptosis regulators. The consensus clustering algorithm was conducted to identify cuproptosis-related molecular patterns and gene signatures. The ssGSEA and ESTIMATE algorithms were used to evaluate the enrichment levels of the infiltrated immune cells and tumor immune scores, respectively. The cuproptosis score was established to assess the cuproptosis patterns of individuals with principal component analysis algorithms based on the expression of cuproptosis-related genes. Three distinct cuproptosis patterns were confirmed and demonstrated to be associated with distinguishable biological processes and clinical prognosis. Interestingly, the three cuproptosis patterns were revealed to be consistent with three immune infiltration characterizations: immune-desert, immune-inflamed, and immune-excluded. Enhanced survival, activation of immune cells, and high tumor purity were presented in patients with low cuproptosisScore, implicating the immune-inflamed phenotype. In addition, low scores were linked to high tumor mutation burden, MSI-H and high CTLA4 expression, showing a higher immune cell proportion score (IPS). Taken together, our study revealed a novel cuproptosis-related molecular pattern associated with the TME phenotype. The formation of cuproptosisScore will further strengthen our understanding of the TME feature and instruct a more personalized immunotherapy schedule in colorectal cancer.
Keywords: colorectal cancer; cuproptosis; immunotherapy; molecular subtype; tumor microenvironment.
Copyright © 2022 Zhu, Zhao, Song, Weng, Li, Guo, Zhu and Xu.
Conflict of interest statement
The authors declare that the research was conducted in the absence of any commercial or financial relationships that could be construed as a potential conflict of interest.
Figures
Similar articles
-
Cuproptosis-related molecular patterns and gene (ATP7A) in hepatocellular carcinoma and their relationships with tumor immune microenvironment and clinical features.Cancer Rep (Hoboken). 2023 Dec;6(12):e1904. doi: 10.1002/cnr2.1904. Epub 2023 Oct 26. Cancer Rep (Hoboken). 2023. PMID: 37885090 Free PMC article.
-
Identification of cuproptosis-related subtypes, construction of a prognosis model, and tumor microenvironment landscape in gastric cancer.Front Immunol. 2022 Nov 21;13:1056932. doi: 10.3389/fimmu.2022.1056932. eCollection 2022. Front Immunol. 2022. PMID: 36479114 Free PMC article.
-
Comprehensive analysis of cuproptosis-related genes and tumor microenvironment infiltration characterization in breast cancer.Front Immunol. 2022 Oct 20;13:978909. doi: 10.3389/fimmu.2022.978909. eCollection 2022. Front Immunol. 2022. PMID: 36341328 Free PMC article.
-
Identification of a novel cuproptosis-related gene signature and integrative analyses in patients with lower-grade gliomas.Front Immunol. 2022 Aug 15;13:933973. doi: 10.3389/fimmu.2022.933973. eCollection 2022. Front Immunol. 2022. PMID: 36045691 Free PMC article. Review.
-
Cuproptosis: molecular mechanisms, cancer prognosis, and therapeutic applications.J Transl Med. 2025 Jan 22;23(1):104. doi: 10.1186/s12967-025-06121-1. J Transl Med. 2025. PMID: 39844182 Free PMC article. Review.
Cited by
-
Predictors based on cuproptosis closely related to angiogenesis predict colorectal cancer recurrence.Front Oncol. 2024 Jan 9;13:1322421. doi: 10.3389/fonc.2023.1322421. eCollection 2023. Front Oncol. 2024. PMID: 38264748 Free PMC article.
-
The signature of cuproptosis-related immune genes predicts the tumor microenvironment and prognosis of prostate adenocarcinoma.Front Immunol. 2023 Aug 2;14:1181370. doi: 10.3389/fimmu.2023.1181370. eCollection 2023. Front Immunol. 2023. PMID: 37600770 Free PMC article.
-
Effect of cuproptosis on acute kidney injury after cardiopulmonary bypass in diabetic patients.World J Diabetes. 2024 Oct 15;15(10):2123-2134. doi: 10.4239/wjd.v15.i10.2123. World J Diabetes. 2024. PMID: 39493567 Free PMC article.
-
Systematic analysis based on the cuproptosis-related genes identifies ferredoxin 1 as an immune regulator and therapeutic target for glioblastoma.BMC Cancer. 2023 Dec 19;23(1):1249. doi: 10.1186/s12885-023-11727-z. BMC Cancer. 2023. PMID: 38114959 Free PMC article.
-
Cuproptosis-related molecular patterns and gene (ATP7A) in hepatocellular carcinoma and their relationships with tumor immune microenvironment and clinical features.Cancer Rep (Hoboken). 2023 Dec;6(12):e1904. doi: 10.1002/cnr2.1904. Epub 2023 Oct 26. Cancer Rep (Hoboken). 2023. PMID: 37885090 Free PMC article.
References
Publication types
MeSH terms
Substances
LinkOut - more resources
Full Text Sources
Medical