. 2022 Sep 27:12:1000993.
doi: 10.3389/fonc.2022.1000993. eCollection 2022.

A novel signature of combing cuproptosis- with ferroptosis-related genes for prediction of prognosis, immunologic therapy responses and drug sensitivity in hepatocellular carcinoma

Affiliations

A novel signature of combing cuproptosis- with ferroptosis-related genes for prediction of prognosis, immunologic therapy responses and drug sensitivity in hepatocellular carcinoma

Chuanbing Zhao et al. Front Oncol. .

Abstract

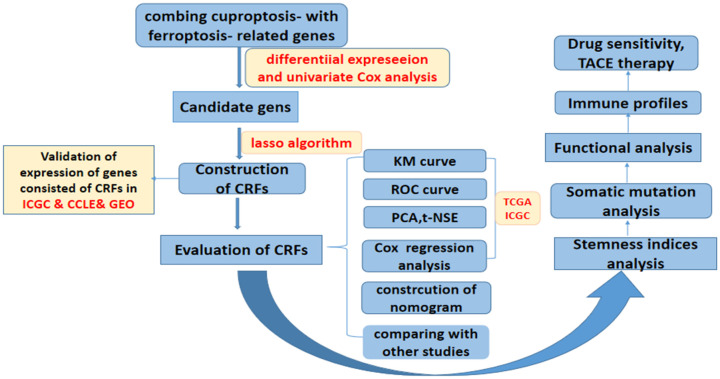
Background: Our study aimed to construct a novel signature (CRFs) of combing cuproptosis-related genes with ferroptosis-related genes for the prediction of the prognosis, responses of immunological therapy, and drug sensitivity of hepatocellular carcinoma (HCC) patients.

Methods: The RNA sequencing and corresponding clinical data of patients with HCC were downloaded from The Cancer Genome Atlas (TCGA), International Cancer Genome Consortium (ICGC), GSE76427, GSE144269, GSE140580, Cancer Cell Line Encyclopedia (CCLE), and IMvigor210 cohorts. CRFs was constructed using the least absolute shrinkage and selection operator (LASSO) algorithm. The analyses involved in the prognosis, response to immunologic therapy, efficacy of transcatheter arterial chemoembolization (TACE) therapy, and drug sensitivity were performed. Furthermore, the molecular function, somatic mutation, and stemness analyses were further performed between the low- and high-risk groups, respectively. In this study, the statistical analyses were performed by using the diverse packages of R 4.1.3 software and Cytoscape 3.8.0.

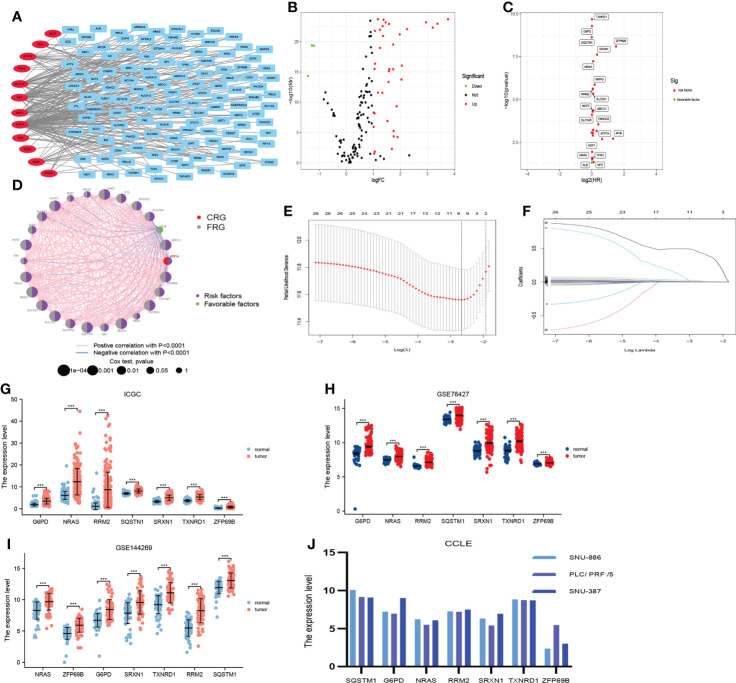
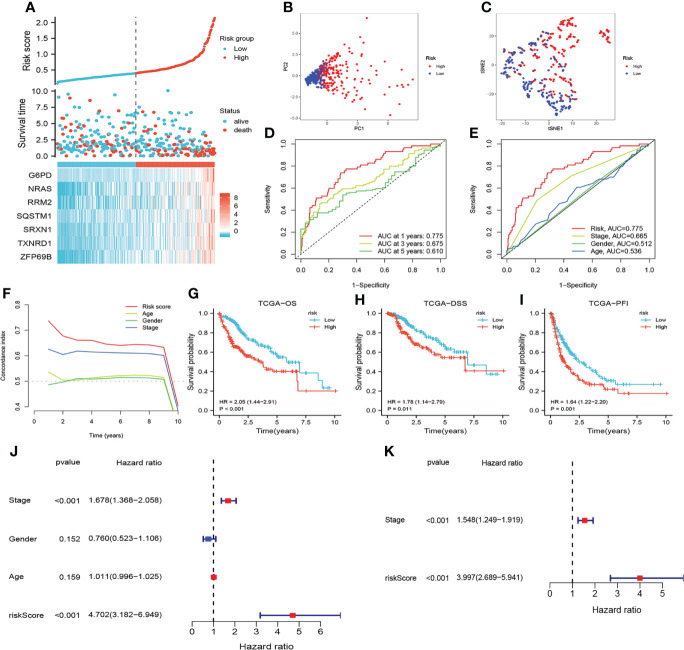
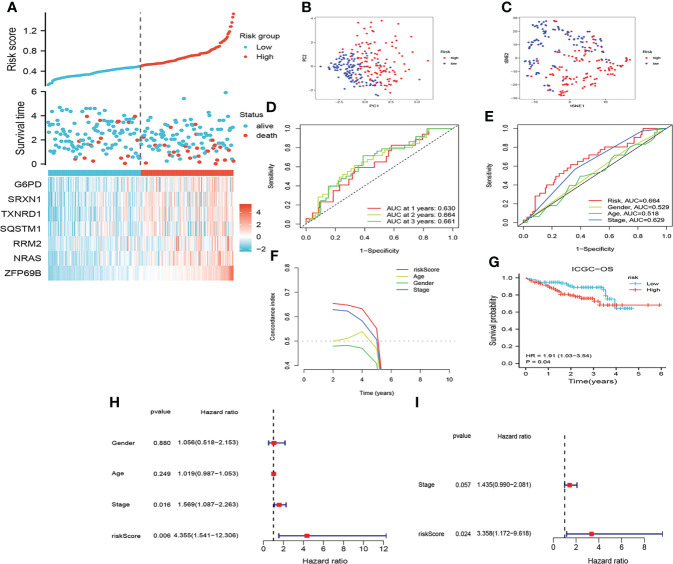
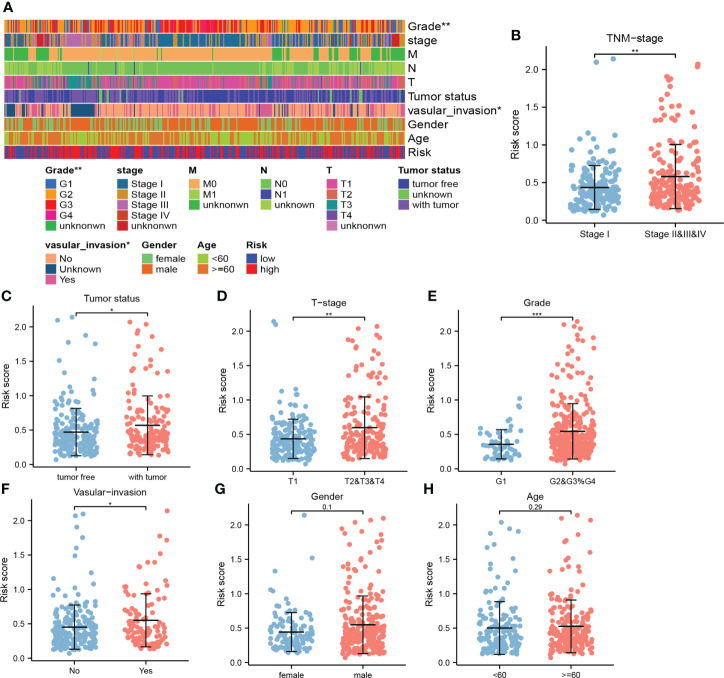
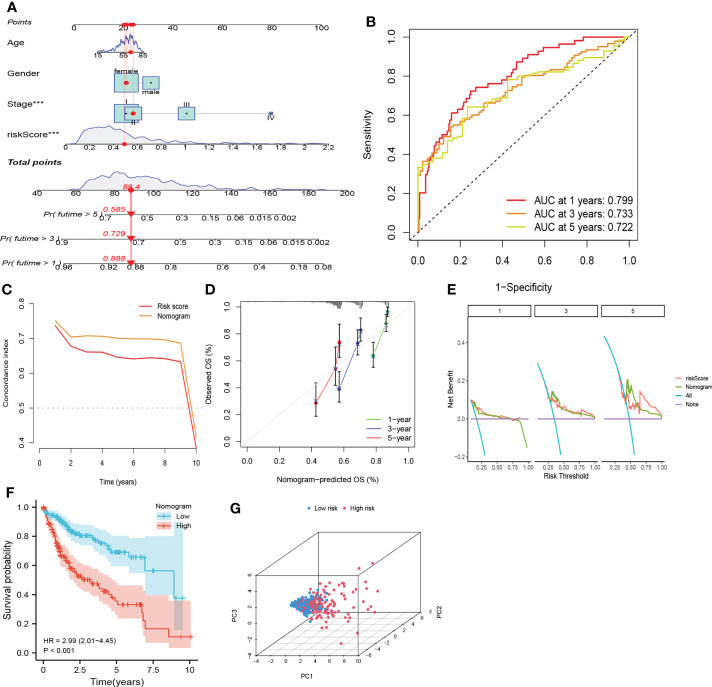
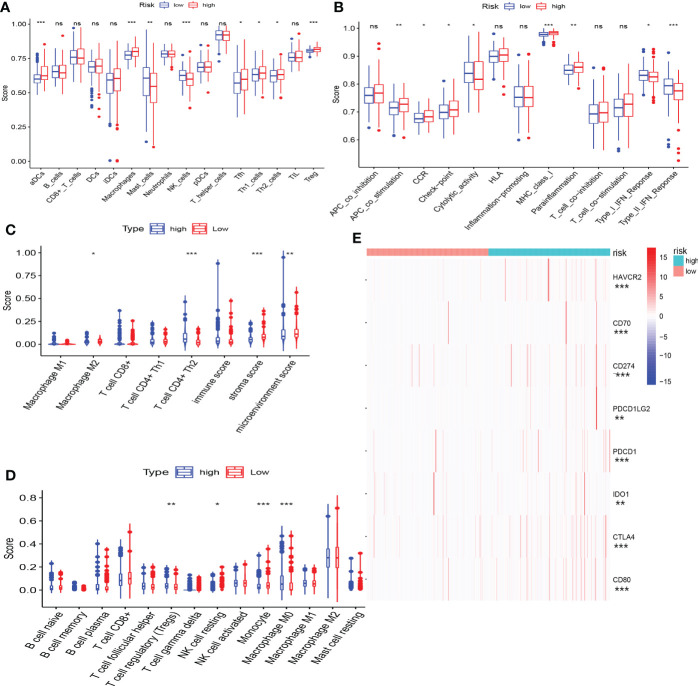
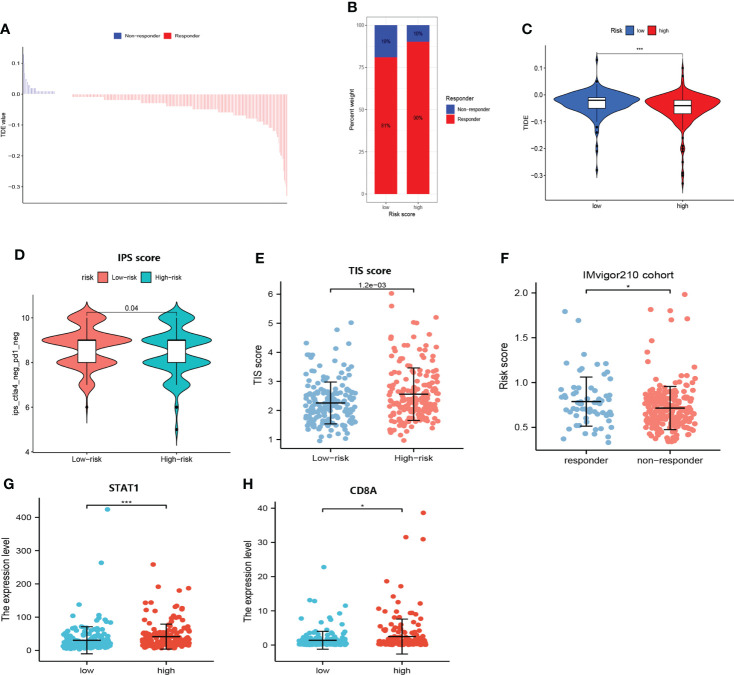
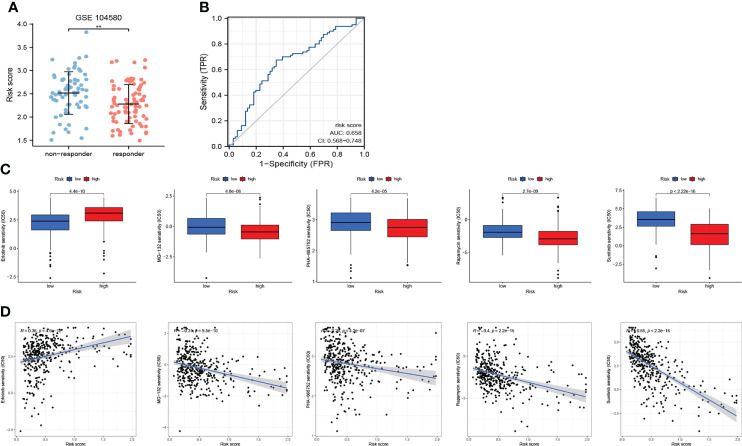
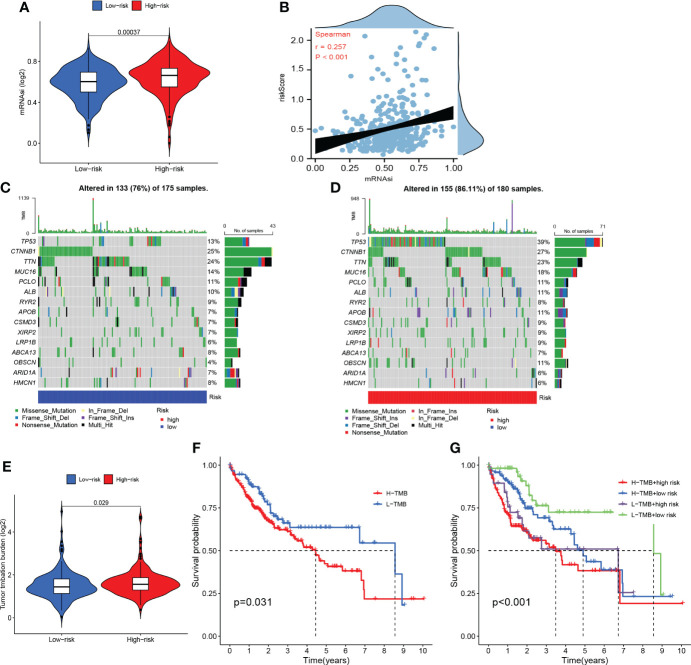
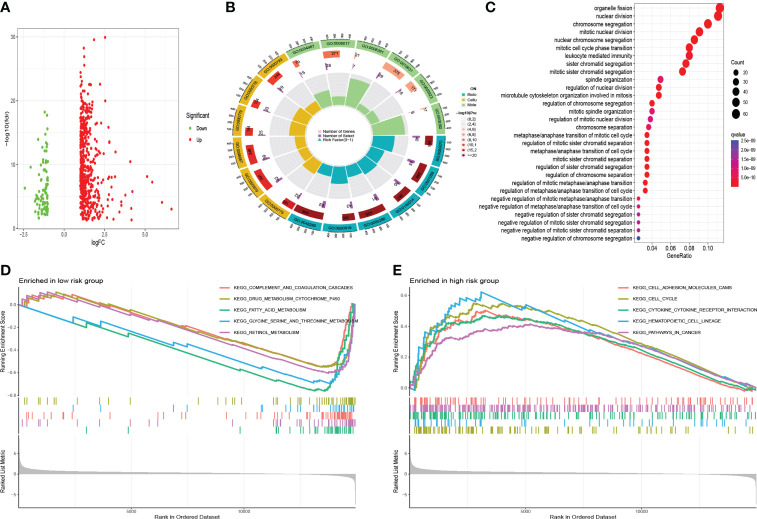
Results: CRFs included seven genes (G6PD, NRAS, RRM2, SQSTM1, SRXN1, TXNRD1, and ZFP69B). Multivariate Cox regression analyses demonstrated that CRFs were an independent risk factor for prognosis. In addition, these patients in the high-risk group presented with worse prognoses and a significant state of immunosuppression. Moreover, patients in the high-risk group might achieve greater outcomes after receiving immunologic therapy, while patients in the low-risk group are sensitive to TACE. Furthermore, we discovered that patients in the high-risk group may benefit from the administration of sunitinib. In addition, enhanced mRANsi and tumor mutation burden (TMB) yielded in the high-risk group. Additionally, the functions enriched in the low-risk group differed from those in the other group.

Conclusion: In summary, CRFs may be regarded not only as a novel biomarker of worse prognosis, but also as an excellent predictor of immunotherapy response, efficacy of TACE and drug sensitivity in HCC, which is worthy of clinical promotion.

Keywords: CRFs; cuproptosis; drug sensitivity; ferroptosis; immunotherapy.


Conflict of interest statement

The authors declare that the research was conducted in the absence of any commercial or financial relationships that could be construed as a potential conflict of interest.

Figures

Figure 1
Figure 1
Flowchart of overall study design.
Figure 2
Figure 2
Construction of the prognostic signature (CRFs) in TCGA. (A) The correlation between cuproptosis-related genes and ferroptosis-related genes. (B) Differential expression of cuproptosis-related genes and cuproptosis–ferroptosis-related genes in hepatocellular carcinoma (HCC) versus normal tissues. (C) Univariate regression analysis of differentially expressed genes (DEGs). (D) The network of candidate genes. (E) Least absolute shrinkage and selection operator (LASSO) coefficient profiles. (F) Candidate genes were filtered by the LASSO algorithm. (G) Verification of the expression of genes constituting CRFs on patients with HCC in ICGC. (H) Verification of the expression of genes constituting CRFs on patients with HCC in GSE76427. (I) Verification of the expression of genes constituting CRFs on patients with HCC in GSE144269. (J) Verification of the expression of genes constituting CRFs on patients with HCC in CCLE.
Figure 3
Figure 3
Assessment of the prognostic signature (CRFs) in TCGA. (A) survival status distribution. (B) Principal component analysis (PCA) plot. (C) t-Distributed stochastic neighbor embedding (t-NSE) plot. (D) timeROC curve of the risk score. (E) Receiver operating characteristic (ROC) curve of the age, gender, stage and riskScore. (F) C-index curve of the age, gender, stage and risk scores. (G) Kaplan–Meier (KM) curves of overall survival (OS). (H) KM curves of disease-specific survival (DSS). (I) KM curves of progression-free interval. (J) Univariate Cox regression analysis of the age, gender, stage, and risk score in TCGA. (K) Multivariate Cox regression analysis of stage and risk scores in TCGA.
Figure 4
Figure 4
Assessment of the prognostic signature (CRFs) in ICGC. (A) Survival status distribution. (B) PCA plot. (C) t-NSE plot. (D) timeROC curve of the risk score.(E) ROC curve of the age, gender, stage, and risk scores. (F) C-index curve of the age, gender, stage, and risk scores. (G) KM curves of OS. (H) Univariate Cox regression analysis of the age, gender, stage, and risk score in ICGC. (I) Multivariate Cox regression analysis of the stage and risk scores in ICGC.
Figure 5
Figure 5
The correlation between the risk score and clinical indicators. (A) The correlation heat map. (B) Comparison of risk scores in stage I and stage II, III, and IV. (C) Comparison of risk scores in tumor- free and tumor status. (D) Comparison of risk scores in T1 and T2, 3, and 4. (E) Comparison of risk scores in G1 and G2, G3, and G4. (F) Comparison of risk scores in the presence and absence of vascular invasion. (G) Comparison of risk scores in men and women. (H) Comparison of risk scores at ages ≥60 vs ≤60 years old. (*, **, and *** represent p < 0.05, p < 0.01, and p < 0.001, respectively).
Figure 6
Figure 6
Comparison of CRFs with other gene signatures.
Figure 7
Figure 7
Nomogram based on CRFs, gender, and stage. (A) Nomogram. (B) timeROC curve of the nomogram. (C) C-index curve of the nomogram. (D)Calibration curve of the nomogram. (E) Decision curve analysis of the nomogram. (F) PCA curve of the nomogram. (G) KM curve of the nomogram.
Figure 8
Figure 8
The correlation between CRFs and immune features. (A) Comparison of immune cell infiltration in high- and low-risk groups using single-sample gene set enrichment analysis. (B) Comparison of immune function in high- and low-risk groups using gene set enrichment analysis (GSEA). (C) Comparison of immune cell infiltration in high- and low-risk groups using xCELL. (D) Comparison of immune cell infiltration in high- and low-risk groups using CIBERSORT. (E) Comparison of the expression level of common immune checkpoints in high- and low-risk groups. (*, **, ***, and ns represent p < 0.05, p < 0.01, p < 0.001, and “not statistically” ,respectively.
Figure 9
Figure 9
Responses of immunologic therapy. (A) The distribution of the TIDE score in responders and non-responders. (B) The proportion of responders and non-responders in the high- and low- risk groups, respectively. (C) Comparison of the TIDE score in high- and low-risk groups. (D) Comparison of the IPS score in high- and low-risk groups. (E) Comparison of the TIS score in high- and low-risk groups. (F) Comparison of risk scores in responders and non-responders to immunotherapy in the IMvigor210 cohort. (G) Comparison of the expression level of STAT1 in high- and low-risk groups. (H) Comparison of the expression level of CD8A in high- and low-risk groups. (* and *** represent p < 0.05 and p < 0.001, respectively.).
Figure 10
Figure 10
The role of CRFs in drug sensitivity and responses to transcatheter arterial chemoembolization (TACE). (A) Comparison of the risk score in responders and non-responders to TACE in GSE140580. (B) ROC curve of the risk score in determining the responses to TACE. (C) Comparison of drug sensitivity in high- and low-risk groups. (D) The correlation of risk scores and drug sensitivity.
Figure 11
Figure 11
Somatic mutation and stemness analysis. (A) Comparison of mRNAsi in high- and low-risk groups. (B) The correlation between the risk score and mRNAsi. (C) The top 20 mutated genes in the high-risk group. (D) The top 20 mutated genes in the low-risk group. (E) Comparison of tumor mutation burden (TMB) in high- and low-risk groups. (F) KM curve of TMB. (G) KM curve of TMB + CRFs.
Figure 12
Figure 12
Functional analysis. (A) The volcano of DEGs. (B) Gene Ontology analysis. (C) KEGG analysis. (D) GSEA in the low-risk group. (E) GSEA in the high-risk group.

References

    1. Cronin KA, Lake AJ, Scott S, Sherman RL, Noone A-M, Howlader N, et al. . Annual report to the nation on the status of cancer, part I: National cancer statistics. Cancer (2018) 124(13):2785–800. doi: 10.1002/cncr.31551 - DOI - PMC - PubMed
    1. Cheng AL, Kang YK, Chen Z, Tsao CJ, Qin S, Kim JS, et al. . Efficacy and safety of sorafenib in patients in the Asia-pacific region with advanced hepatocellular carcinoma: A phase III randomised, double-blind, placebo-controlled trial. Lancet Oncol (2009) 10(1):25–34. doi: 10.1016/S1470-2045(08)70285-7 - DOI - PubMed
    1. Kudo M, Finn RS, Qin S, Han KH, Ikeda K, Piscaglia F, et al. . Lenvatinib versus sorafenib in first-line treatment of patients with unresectable hepatocellular carcinoma: A randomised phase 3 non-inferiority trial. Lancet (2018) 391(10126):1163–73. doi: 10.1016/S0140-6736(18)30207-1 - DOI - PubMed
    1. Bruix J, Qin S, Merle P, Granito A, Huang YH, Bodoky G, et al. . Regorafenib for patients with hepatocellular carcinoma who progressed on sorafenib treatment (RESORCE): A randomised, double-blind, placebo-controlled, phase 3 trial. Lancet (2017) 389(10064):56–66. doi: 10.1016/S0140-6736(16)32453-9 - DOI - PubMed
    1. El-Khoueiry AB, Sangro B, Yau T, Crocenzi TS, Kudo M, Hsu C, et al. . Nivolumab in patients with advanced hepatocellular carcinoma (CheckMate 040): An open-label, non-comparative, phase 1/2 dose escalation and expansion trial. Lancet (2017) 389(10088):2492–502. doi: 10.1016/S0140-6736(17)31046-2 - DOI - PMC - PubMed