Review
. 2022 Sep 28;7(40):35387-35445.
doi: 10.1021/acsomega.2c03171. eCollection 2022 Oct 11.

An Update on Graphene Oxide: Applications and Toxicity

Affiliations
Review

An Update on Graphene Oxide: Applications and Toxicity

Sandeep Yadav et al. ACS Omega. .

Abstract

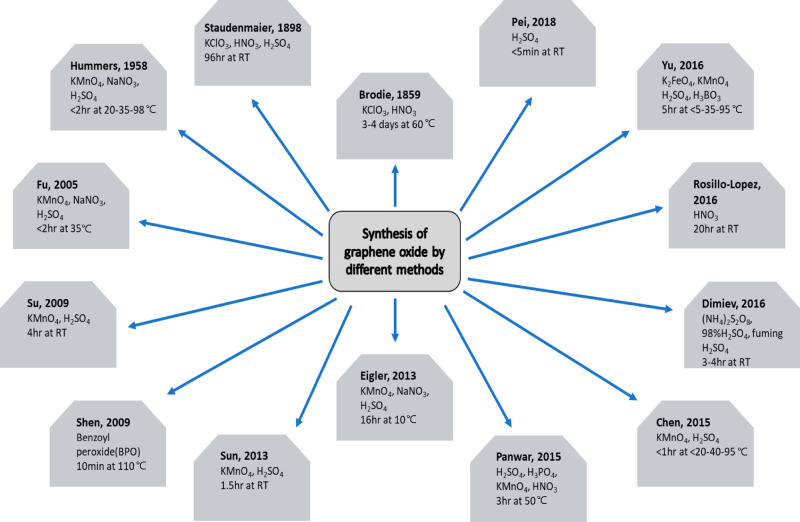
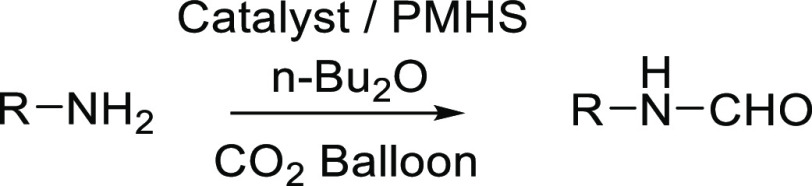
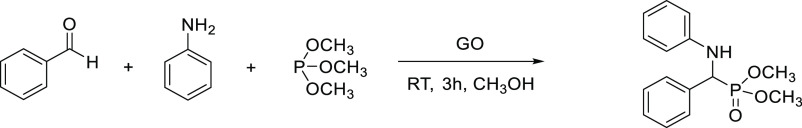
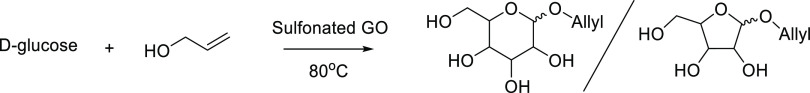
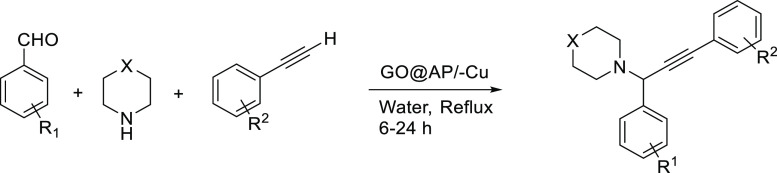
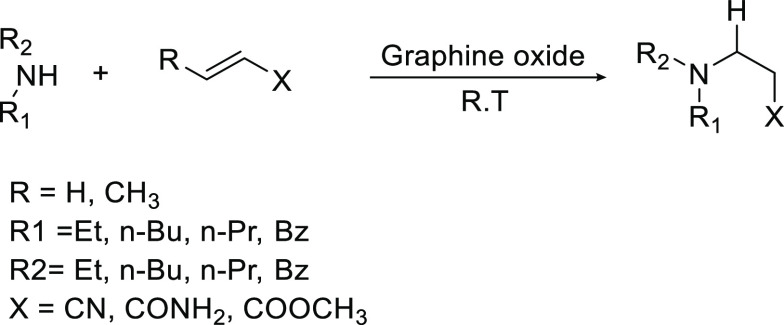
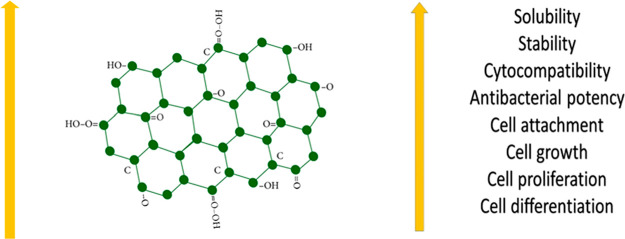
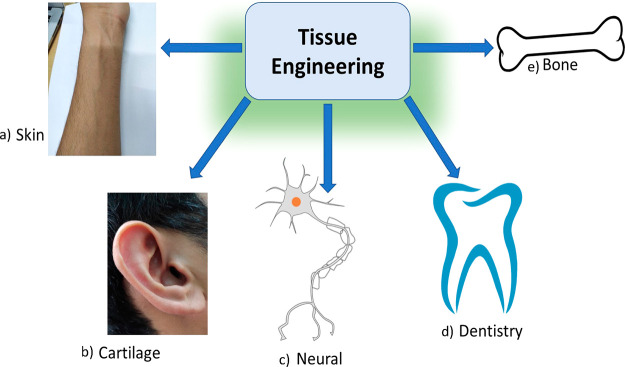
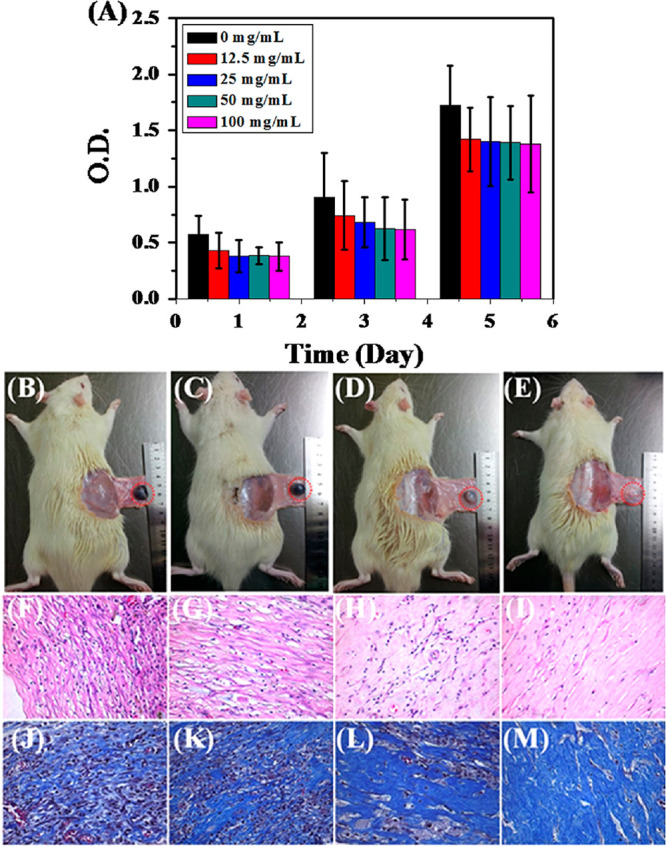
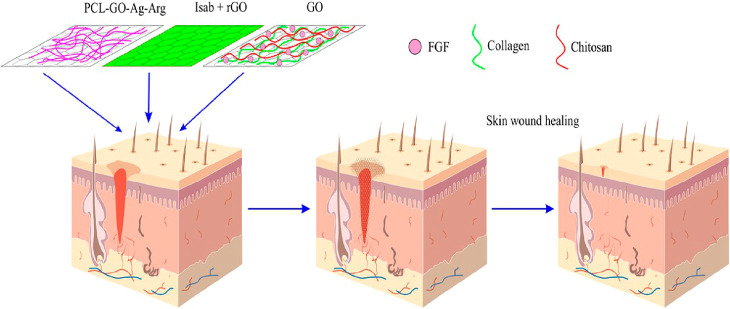
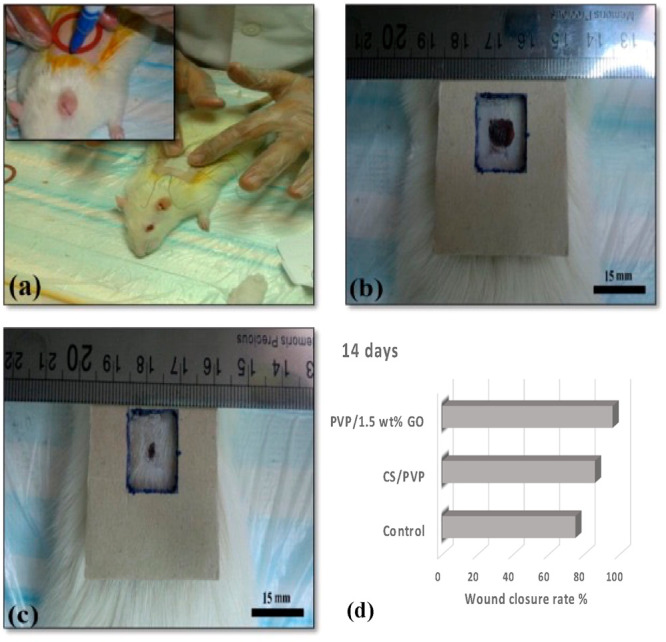
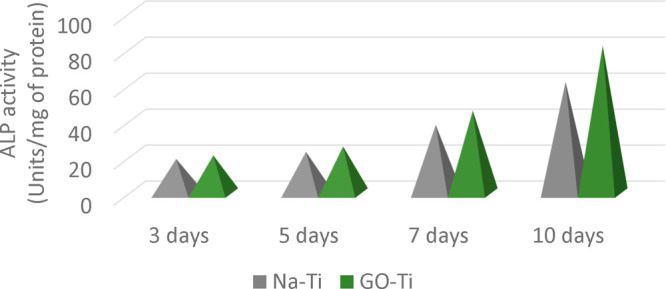
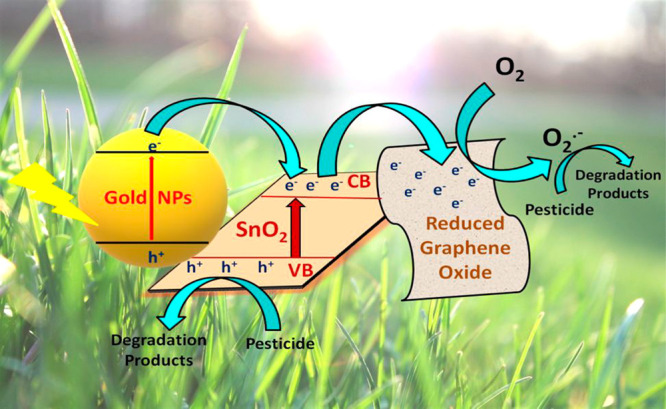
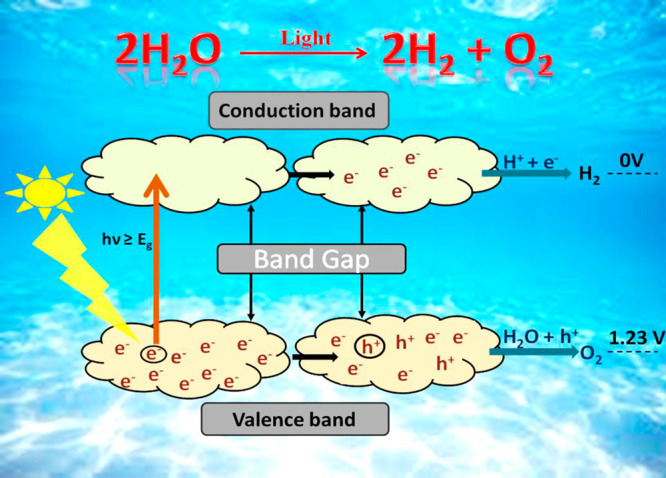
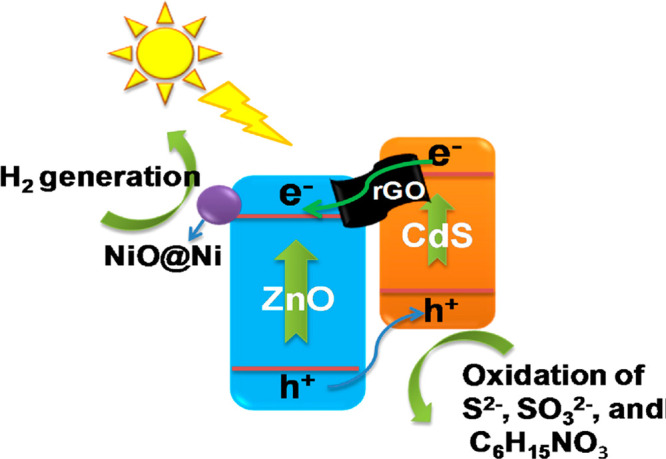
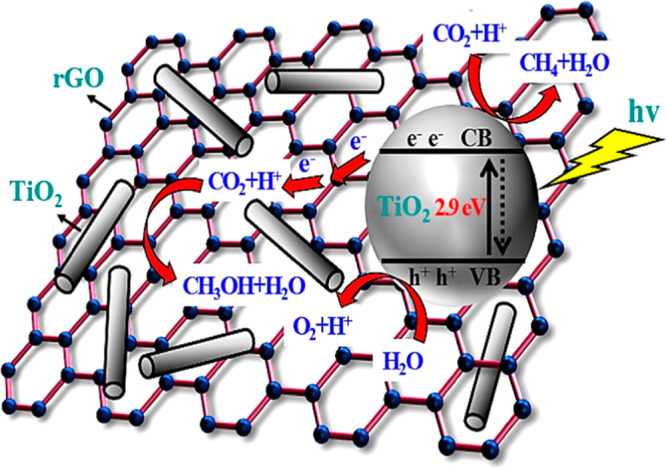
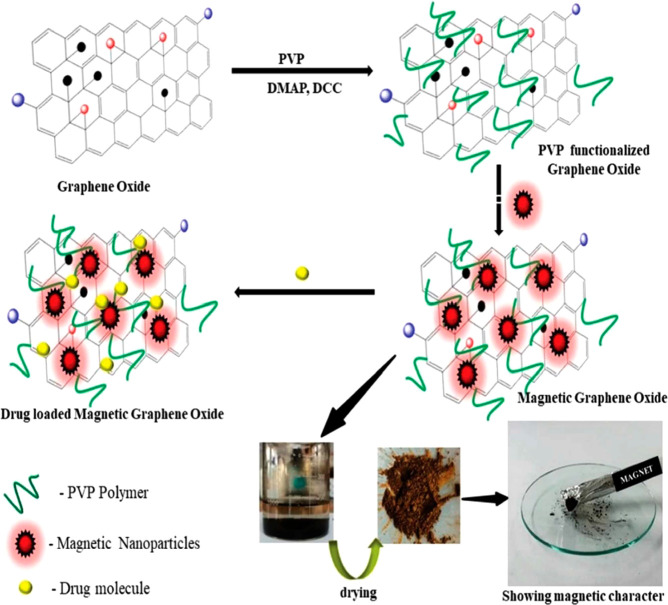
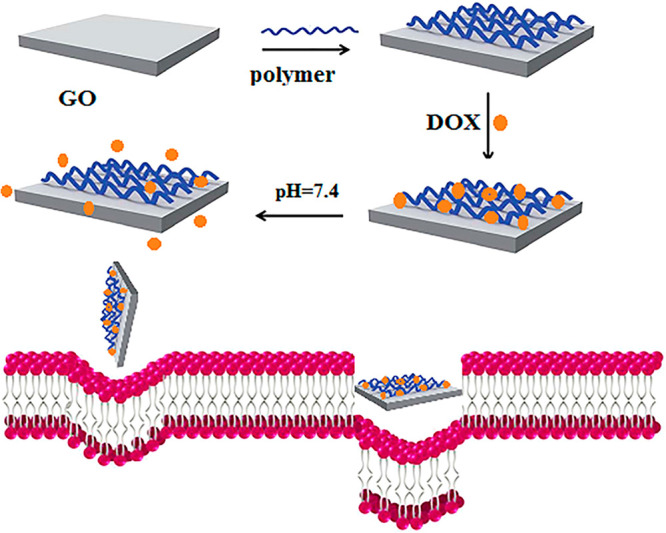
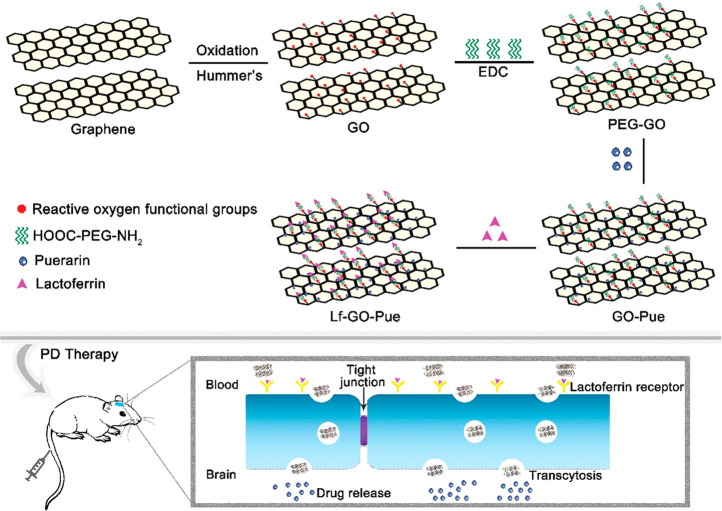
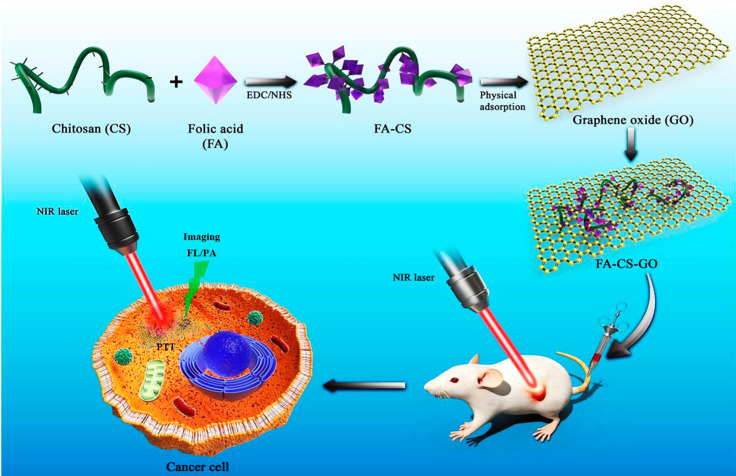
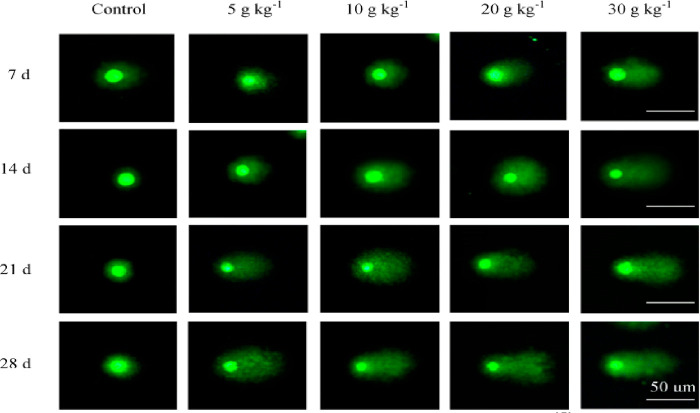
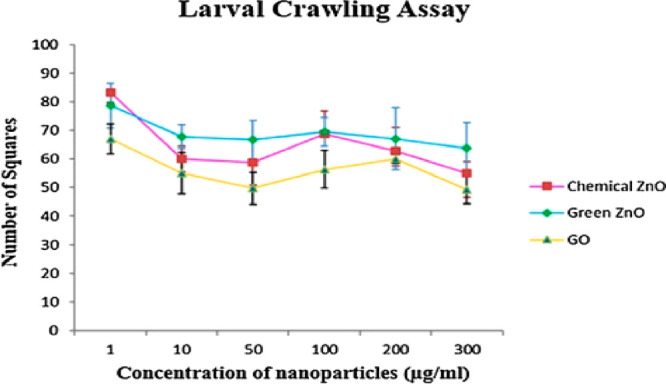
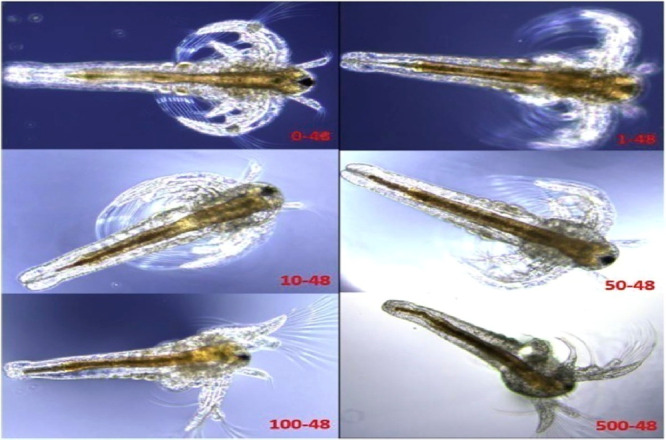
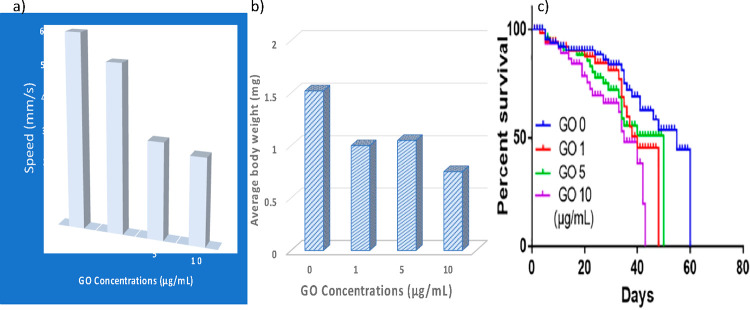
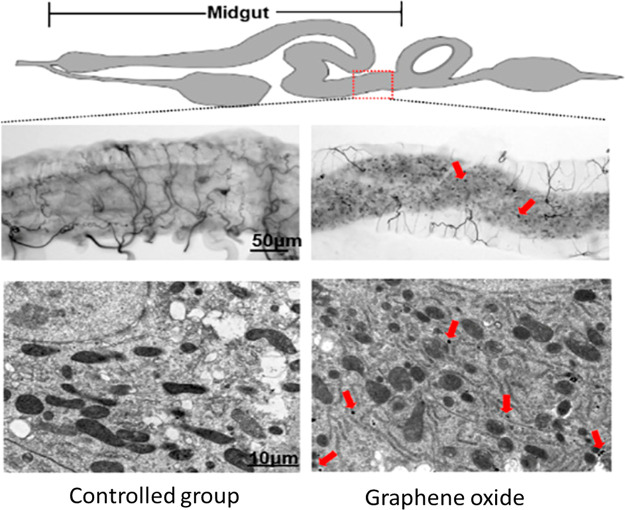
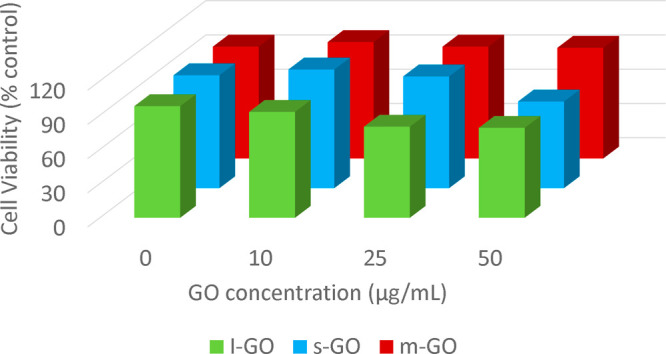
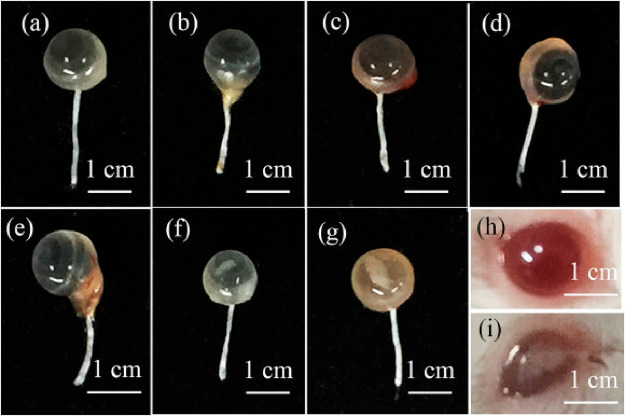
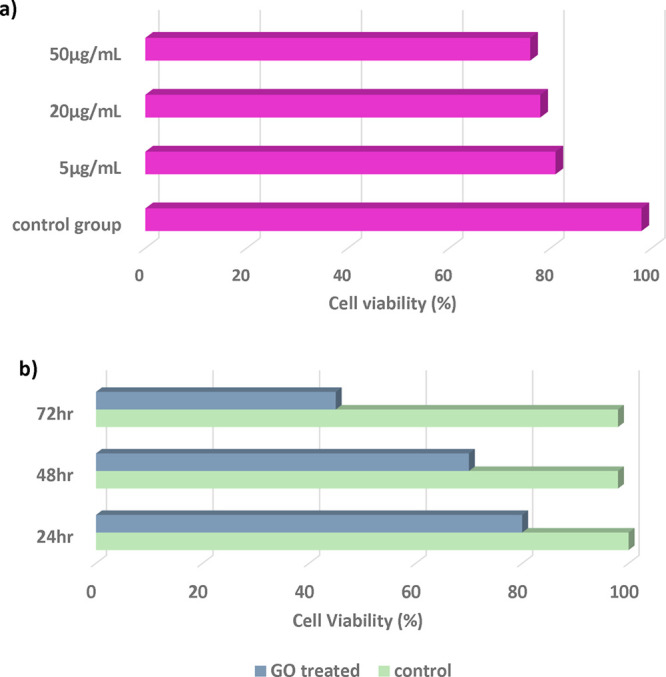
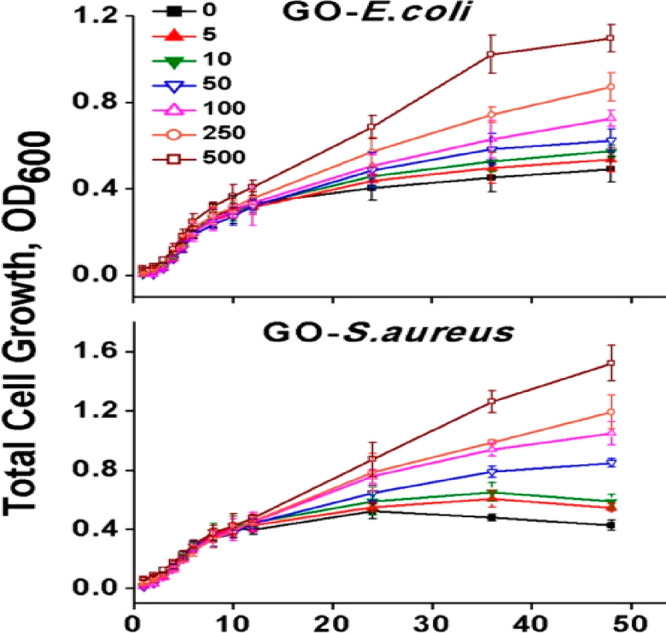
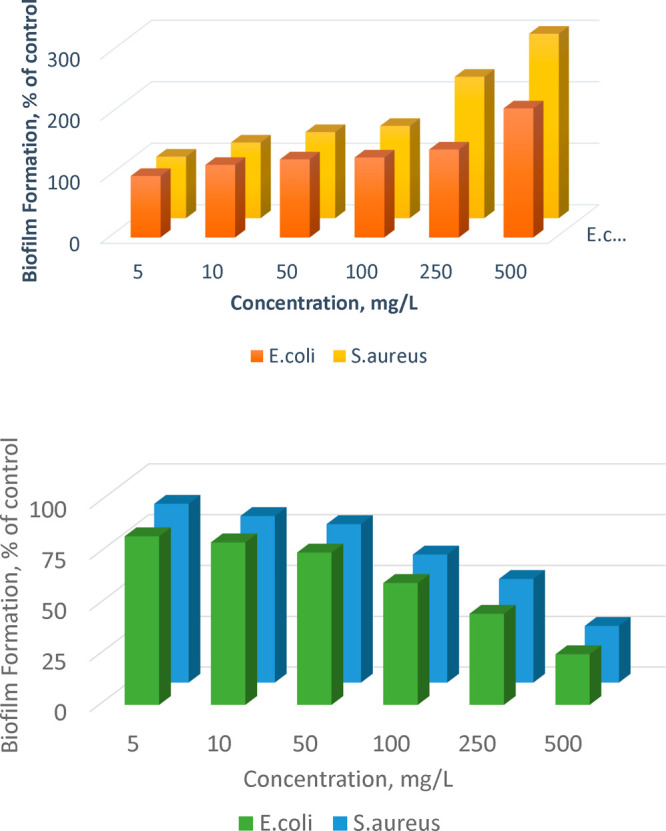
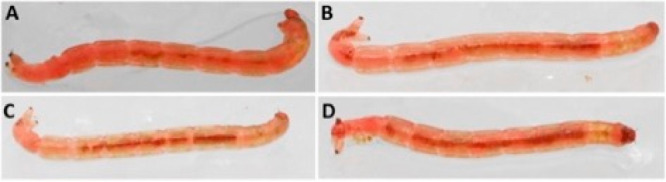
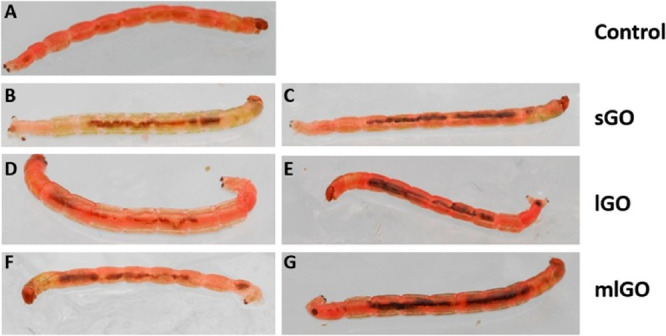
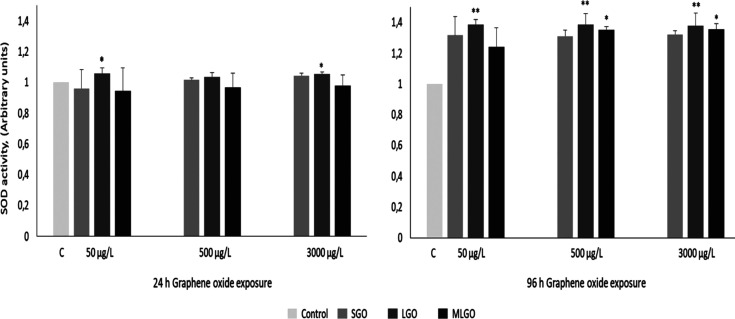
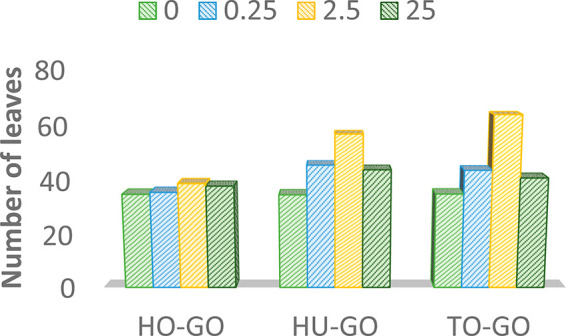
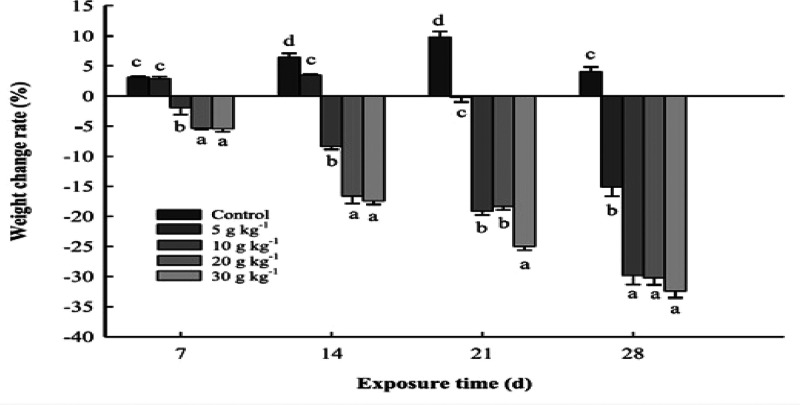
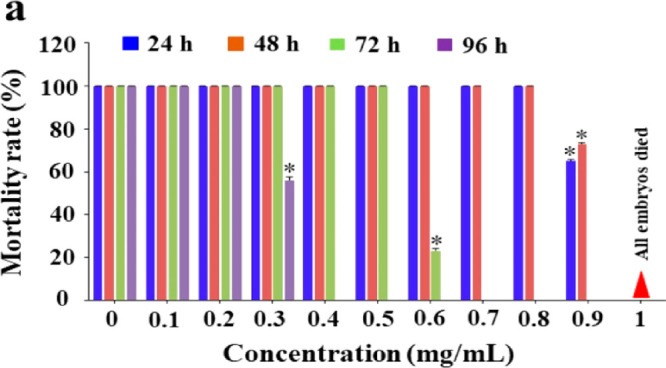
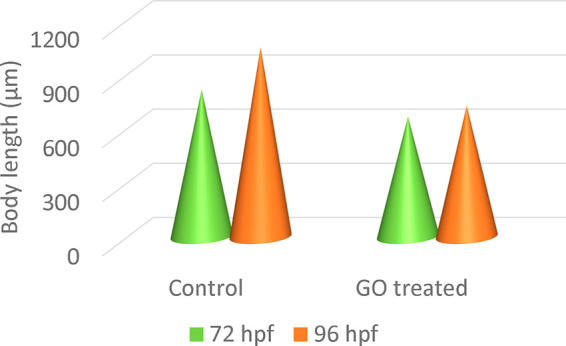
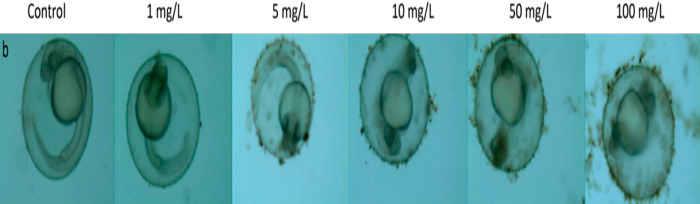
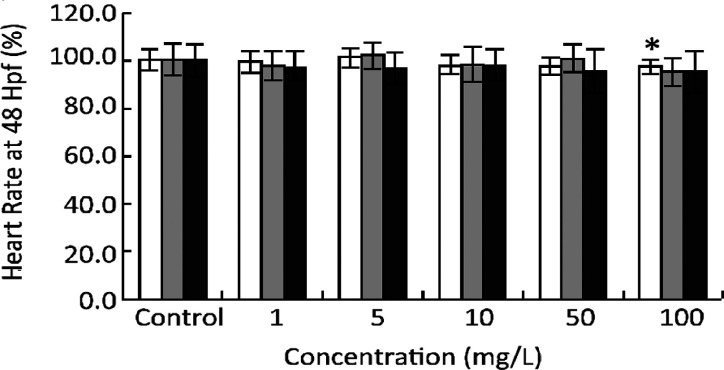
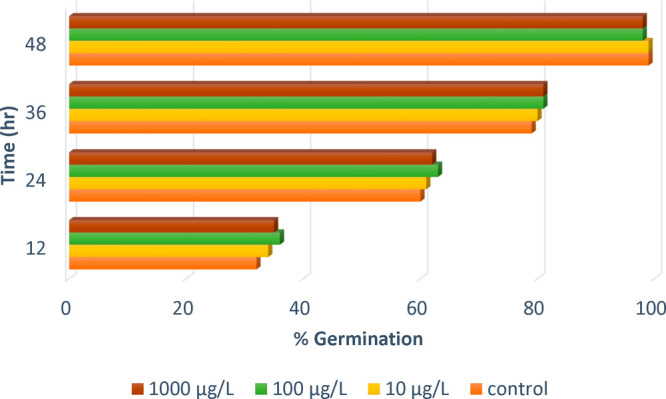
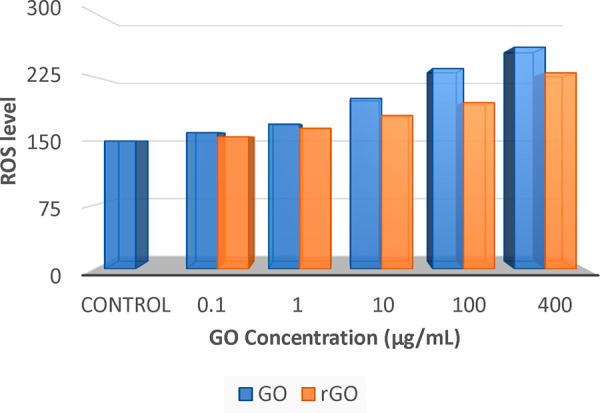
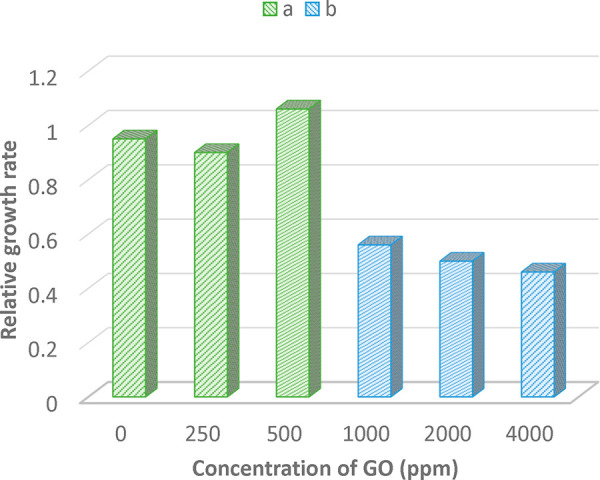
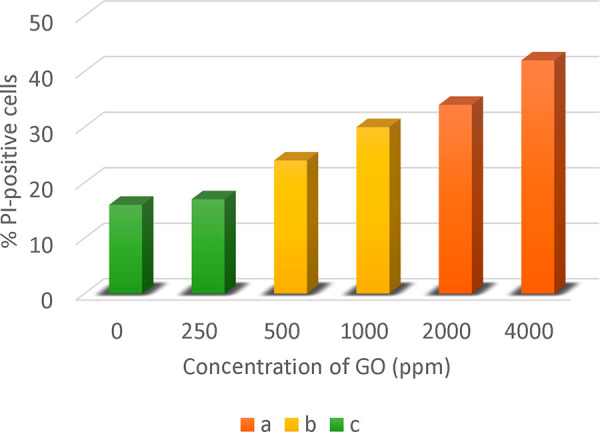
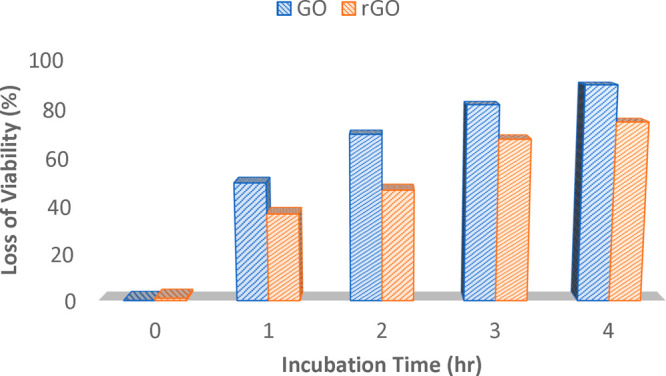
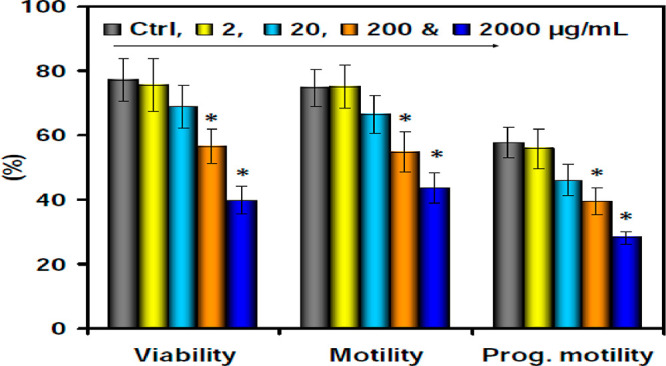
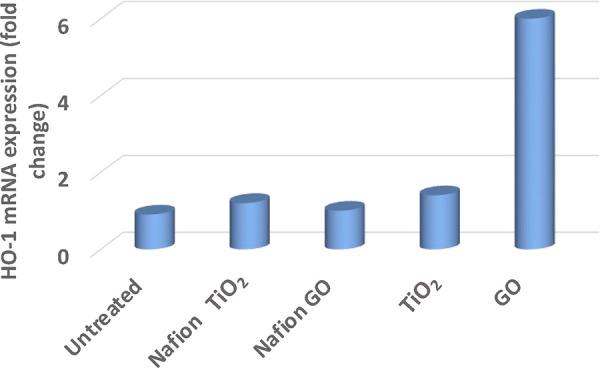
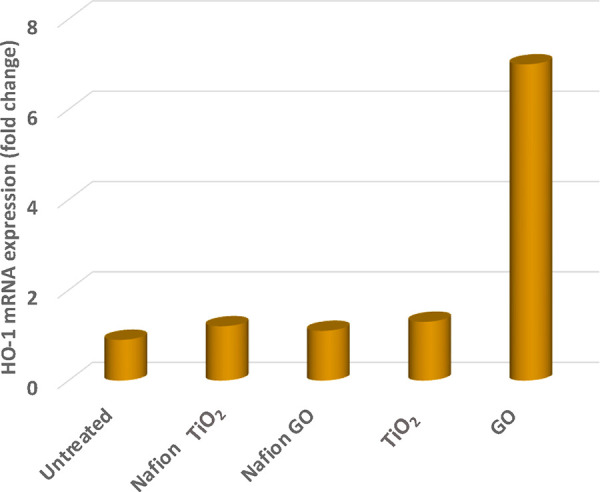
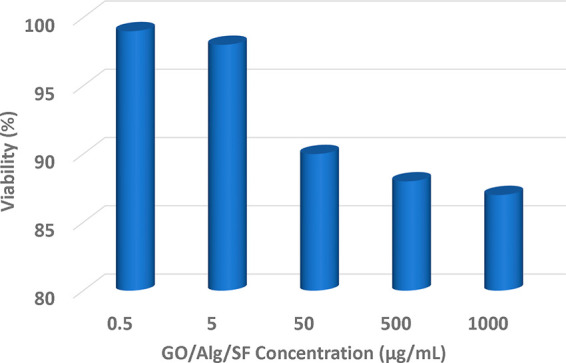
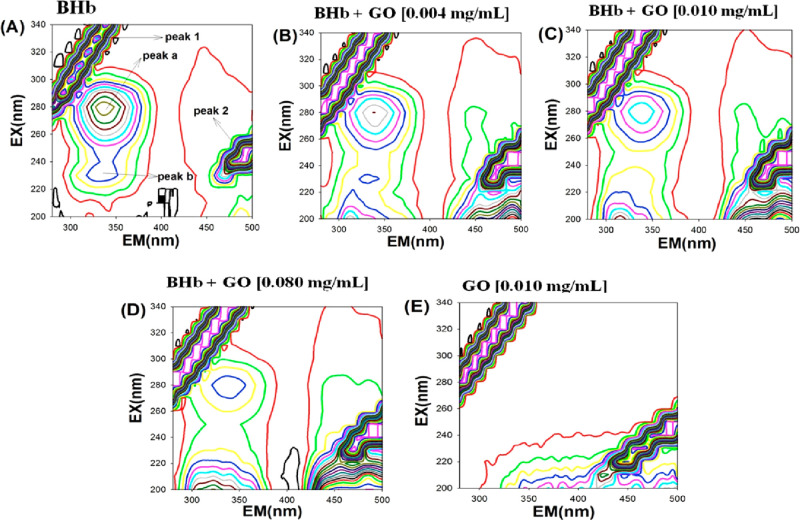
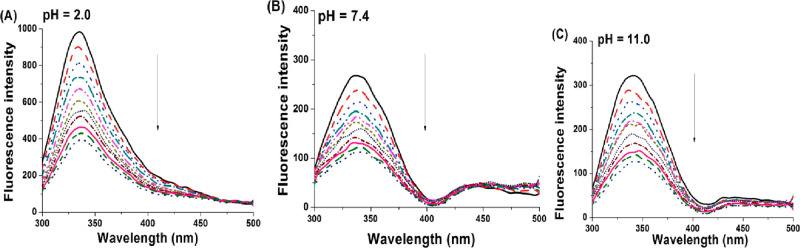
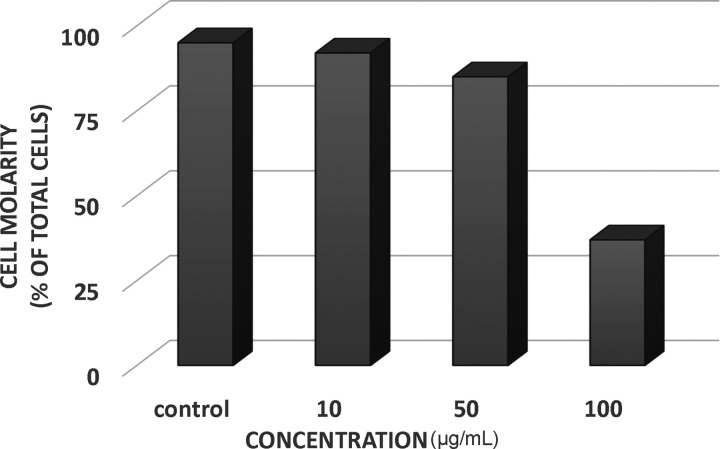
Graphene oxide (GO) has attracted much attention in the past few years because of its interesting and promising electrical, thermal, mechanical, and structural properties. These properties can be altered, as GO can be readily functionalized. Brodie synthesized the GO in 1859 by reacting graphite with KClO3 in the presence of fuming HNO3; the reaction took 3-4 days to complete at 333 K. Since then, various schemes have been developed to reduce the reaction time, increase the yield, and minimize the release of toxic byproducts (NO2 and N2O4). The modified Hummers method has been widely accepted to produce GO in bulk. Due to its versatile characteristics, GO has a wide range of applications in different fields like tissue engineering, photocatalysis, catalysis, and biomedical applications. Its porous structure is considered appropriate for tissue and organ regeneration. Various branches of tissue engineering are being extensively explored, such as bone, neural, dentistry, cartilage, and skin tissue engineering. The band gap of GO can be easily tuned, and therefore it has a wide range of photocatalytic applications as well: the degradation of organic contaminants, hydrogen generation, and CO2 reduction, etc. GO could be a potential nanocarrier in drug delivery systems, gene delivery, biological sensing, and antibacterial nanocomposites due to its large surface area and high density, as it is highly functionalized with oxygen-containing functional groups. GO or its composites are found to be toxic to various biological species and as also discussed in this review. It has been observed that superoxide dismutase (SOD) and reactive oxygen species (ROS) levels gradually increase over a period after GO is introduced in the biological systems. Hence, GO at specific concentrations is toxic for various species like earthworms, Chironomus riparius, Zebrafish, etc.


Conflict of interest statement

The authors declare no competing financial interest.

Figures

Figure 1
Figure 1
Various methods developed over the years for the preparation of GO.
Figure 2
Figure 2
Exfoliation of bulk GO.
Figure 3
Figure 3
Methods of characterization of Graphene Oxide (GO).
Figure 4
Figure 4
Different techniques for spectroscopic characterization of GO. Reproduced with permission from refs (15, 64, 65, 67), and (70). Copyright@2020, Elsevier Ltd., Results in Materials (open access). Copyright@2020, Elsevier Ltd., Materials Today: Proceedings. Copyright@2020, Elsevier Ltd., Journal of Materials Research and Technology. Copyright@2017, Scientific Research, Graphene. Copyright@2021, Taylor and Francis Ltd., Polycyclic Aromatic Compounds.
Figure 5
Figure 5
UV–visible spectra of (a) graphite, (b) GO synthesized by Hummers method, (c) and (d) GO synthesized by two different modified Hummers methods. Reproduced with permission from ref (64). Copyright@2020, Elsevier Ltd., Results in Materials.
Figure 6
Figure 6
XRD pattern of GO nanosheets. Reproduced with permission from ref (65). Copyright@2020, Elsevier Ltd., Materials today: Proceedings.
Figure 7
Figure 7
FTIR spectra of GO. Reproduced with permission from ref (66). Copyright@2022, Elsevier Ltd., Nanomedicine: Nanotechnology, Biology and Medicine.
Figure 8
Figure 8
Raman spectra of (a) single and (b) bilayered GO. Reproduced with permission from ref (76). Copyright@2020, Elsevier Ltd., Carbon.
Figure 9
Figure 9
(a) Survey scan XPS spectra, (b) C 1s extended XPS of GO, and (c) O 1s extended spectra of GO. Reproduced with permission from ref (67). Copyright@2020, Elsevier Ltd., Journal of Materials Research and Technology.
Figure 10
Figure 10
EDX of (a) graphite, (b) GO–HM, (c) GO–MHM1, and (d) GO–MHM2. Reproduced with permission from ref (64). Copyright@2020, Elsevier Ltd., Results in Materials.
Figure 11
Figure 11
Some techniques for microscopic characterization of GO. Reproduced with permission from refs (, , and 78). Copyright@2017, Scientific Research, Graphene. Copyright@2020, Elsevier Ltd., Nanomedicine: Nanotechnology, Biology and Medicine. Copyright@2021, Multidisciplinary Digital Publishing Institute, Nanomaterials.
Figure 12
Figure 12
SEM images of (a) GO with low oxygen content and (b) GO with high oxygen content. Reproduced with permission from ref (68). Copyright@2022, Elsevier Ltd., Journal of King Saud University – Science (open access).
Figure 13
Figure 13
Density of graphite and GO dispersed in ethanol (E-GO), acetone (A-GO), and deionized water (DIW-GO). Reproduced with permission from ref (69). Copyright@2022, AIP, Ltd., AIP Conference Proceedings (open access).
Scheme 1
Scheme 1. Synthesis of Primary Amines from Aldoximes via Beckmann Rearrangement
Scheme 2
Scheme 2. Catalytic N-Formylation Reaction through CO2 Fixation
Scheme 3
Scheme 3. A 3 mg Catalyst Loading Gives 88% Yield in 3 h Using Benzaldehyde (1 mmol), Trimethyl Phosphite (1 mmol), and Methanol (3 mL) at Room Temperature.
Scheme 4
Scheme 4. Glycosylation Reaction of the Unprotected d-Glucose with Allyl Alcohol
Scheme 5
Scheme 5. Hydrogen Generation from Liquid Organic Hydrogen Carriers
Scheme 6
Scheme 6. Formation of Dihydropyrimidine (Biginelli Reaction) Based on Cinnamaldehyde
Scheme 7
Scheme 7. Chan–Lam Coupling Reaction
Scheme 8
Scheme 8. Reaction between p-Hydroxybenzaldehyde and Nitromethane
Scheme 9
Scheme 9. Synthesis of Acetyl Aniline from Aniline with Ag–GO NPs as Catalyst
Scheme 10
Scheme 10. Synthesis of Isatin-Linked Thiazolidine
Scheme 11
Scheme 11. Conversion of Benzaldehyde into β-Nitro Styrene
Scheme 12
Scheme 12. Epoxidation of Cyclooctene
Scheme 13
Scheme 13. Esterification Reaction between Lactic Acid and Ethanol
Scheme 14
Scheme 14. Synthesis of Iodine Octane from Chlorobenzene and NaI via Nucleophilic Substitution
Scheme 15
Scheme 15. Suzuki–Miyaura Coupling
Scheme 16
Scheme 16
Reaction conditions for benzaldehyde:ethyl acetoacetate:urea are 1 mmol:1 mmol:1.3 mmol over 0.1 g of CG (clay–GO) at 130 °C.
Scheme 17
Scheme 17. Etherification Reaction in Amine Curing
Figure 14
Figure 14
Viscosity vs curing time. Reproduced with permission from ref (115). Copyright@2016, Royal Society of Chemistry, Royal Society of Chemistry Advances (redrew the image from the information available).
Scheme 18
Scheme 18. Reduction of 4-Nitrobenzene
Scheme 19
Scheme 19. Synthesis of 3-Trifluoroalkylated Quinoxalin-2(1H)-ones
Scheme 20
Scheme 20. GO/rGO-Catalyzed Synthesis of Quinoxalines from 2-Nitroaniline
Scheme 21
Scheme 21
Reaction conditions: benzaldehyde (1 mmol), acetophenone (1 mmol), and nitrile (1 mmol). GO: 25 mg in 5 mL of solvent at room temperature for 24 h. The highest yield is 96% when ethanol is used as solvent.
Scheme 22
Scheme 22. Formation of Benzonitrile
Scheme 23
Scheme 23. Preparation of Chalcones via Claisen–Schmidt Condensation
Scheme 24
Scheme 24. Hydrolysis of Ulvan Monosaccharides in the Presence of GO@SO3CF3
Scheme 25
Scheme 25. Friedel–Crafts Addition of Indoles to α,β-Unsaturated Ketones and Nitro Styrene
Scheme 26
Scheme 26. Oxidation of Benzyl Alcohol Using NGO as the Catalyst
Scheme 27
Scheme 27. aza-Michael Addition
Figure 15
Figure 15
General effect of a GO-based scaffold on biological and mechanical properties of tissues.
Figure 16
Figure 16
Tissue engineering for different body parts: (a) skin, (b) cartilage, (c) neural, (d) dentistry, and (e) bone.
Figure 17
Figure 17
Effect of GO and others on cell viability with the MG-63 cell line by trypan blue dye exclusion. Reproduced with permission from ref (43). Copyright@2021, Elsevier Ltd., Journal of Drug Delivery Science and Technology (redrew the image from the information available).
Figure 18
Figure 18
Standard deviation of porosity values with varying concentrations of Dex microspheres. Reproduced with permission from ref (43). Copyright@2021, Elsevier Ltd., Journal of Drug Delivery Science and Technology (redrew the image from the information available).
Figure 19
Figure 19
XPS peak deconvolution of the C(1s) core level of GO reduced by ginseng (a) in the absence and (b) in the presence of Fe catalyst, as compared to the spectra of (c) as-prepared GO and (d) the GO reduced by hydrazine (as benchmarks) as well as the GO heat treated (e) in the absence and (f) in the presence of Fe catalyst at 80 °C for 10 min. (g) The peak area ratios of the oxygen-containing bonds to the C–C bond for each sample. Reproduced with permission from ref (151). Copyright@2014 Elsevier Ltd., Carbon.
Figure 20
Figure 20
MTT assay plotted for viability of the scaffolds toward PC12 cells at time points of 3, 7, 14, and 60 days. Reproduced with permission from ref (152). Copyright@2021, Elsevier Ltd., Materials Science and Engineering: C.
Figure 21
Figure 21
Growth of ATDC5 cells on chitosan/PVA/GO (6 wt %), chitosan/PVA/GO (4 wt %), and chitosan/PVA after 1, 4, 7, and 14 days of culture. Reproduced with permission from ref (21). Copyright@2017, Elsevier Ltd., Materials Science and Engineering C (redrew the image from the information available).
Figure 22
Figure 22
(A) Cell viability of 3T3 cells in the leachates of the scaffold. The photographs of subcutaneous implanted CSMA/PECA/GO scaffold on the back of mice for (B) 1, (C) 2, (D) 4, and (E) 8 weeks. Histological section of the subcutaneous implanted CSMA/PECA/GO scaffold for different periods. Images F, G, H, and I were of H&E staining at 1, 2, 4, and 8 weeks. (J), (K), (L), and (M) were of Masson staining at the same time as H&E staining (original magnification × 400). Reproduced with permission from ref (161). Copyright@2015, Nature, Scientific reports (open access).
Figure 23
Figure 23
Different concentrations of PCL-GO-Ag-Arg against L929 mouse fibroblast cells. Reproduced with permission from ref (165). Copyright@ 2020, De Gruyter, Biomolecular Concept.
Figure 24
Figure 24
(a) Surgery process of a rat for implanting nanofibrous membranes on an open wound and wound healing 14 days postsurgery for (b) a pristine CS-based mat and (c) 1.5% GO-containing membrane. (d) Wound closure rate for the examined materials compared with the control. Reproduced with permission from ref (166). Copyright@ 2017, Elsevier Ltd., Materials Science and Engineering: C.
Figure 25
Figure 25
ALP activity of PDLSCs cultured on Na-Ti and GO-Ti substrates. Reproduced with permission from ref (27). Copyright@2016, Nature, Scientific Reports (redrew the image from the information available) (open access)).
Figure 26
Figure 26
Schematic representation for electron transfer in the Au–SnO2–rGO heterojunction. Reproduced with permission from ref (175). Copyright@2020, Elsevier Ltd., Journal of Hazardous Materials.
Figure 27
Figure 27
Schematic of the generation of electron–hole pairs, charge transfer, and the degradation of MB pollutant dye through oxidation and reduction reactions. Reproduced with permission from ref (180). Copyright@2022, Elsevier Ltd., Optical Materials.
Figure 28
Figure 28
Schematic representation for the mechanism of photocatalytic water splitting. Reproduced with permission from ref (185). Copyright@2022, Royal Society of Chemistry, New Journal of Chemistry.
Figure 29
Figure 29
Scheme of the photocatalytic reaction process in the NiO@Ni-ZnO/rGO/CdS heterostructure. Reproduced with permission from ref (186). Copyright@2017, Elsevier Ltd., Applied Surface Science.
Figure 30
Figure 30
Schematic representation of the mechanism of charge separation in the TiO2–rGO composite. Reproduced with permission from ref (36). Copyright@2021, Elsevier Ltd., Journal of Alloys and Compounds.
Figure 31
Figure 31
Schematic representation of the synthesis of magnetic GO and drug loading on magnetic GO. Reproduced with permission from ref (248). Copyright @2022, Royal Society of Chemistry, Royal Society of Chemistry Advances.
Figure 32
Figure 32
Preparation of doxorubicin (DOX)-loaded graphene (GO) nanocomposites. Reproduced with permission from ref (249). Copyright@2021, Elsevier Ltd., International Journal of Biological Macromolecules.
Figure 33
Figure 33
Lf-GO-Pue for the multifunctional brain-targeted drug delivery system for the treatment of PD. Reproduced with permission from ref (250). Copyright @2022, Royal Society of Chemistry, Biomaterials Science.
Figure 34
Figure 34
Chitosan (CS)-functionalized GO nanosheets were conjugated with folic acid for targeted photothermal tumor therapy. Reproduced with permission from ref (251). Copyright @ 2020, Elsevier Ltd., International Journal of Biological Macromolecules.
Figure 35
Figure 35
(a) IR thermal images of tumor-bearing mice with or without injection of FA-CS-GO exposed for 5 min to a laser (2.0 W/cm2). (b) Temperature variations of the tumor region of the mice treated with PBS and FA-CS-GO exposed for 5 min to a laser (2.0 W/cm2). (c) The tumor growth curves of different groups of tumors after various treatments. Reproduced with permission from ref (251). Copyright@ 020, Elsevier Ltd., International Journal of Biological Macromolecules.
Figure 36
Figure 36
Schematic illustration of the preparation of MG–PB. Reproduced with permission from ref (252). Copyright@2021, Elsevier Ltd., European Polymer Journal.
Figure 37
Figure 37
(a) Atomistic structure of GO and (b) the scheme of the thermal regime. Reproduced with permission from ref (261). Copyright@ 2022, Elsevier Ltd., Carbon.
Figure 38
Figure 38
(a) Time evolution of the total number of atoms, (b) number of carbon atoms, and (c) number of oxygen atoms along the simulation at different temperatures. Atoms of carbon, oxygen, and hydrogen are shown in blue, red, and gray, respectively. Reproduced with permission from ref (261). Copyright@2022, Elsevier Ltd., Carbon.
Figure 39
Figure 39
Time-dependent evolution of the concentrations of gas-phase products during the simulation of GO oxidation at Tmax at 3500 K. Reproduced with permission from ref (261). Copyright@2022, Elsevier Ltd., Carbon.
Figure 40
Figure 40
FTIR spectra of GO, Cl-f-GO, Cu-salen, and Cu-f-GO. Reproduced with permission from ref (264). Copyright@2022, Elsevier Ltd., Journal of Molecular Structure.
Figure 41
Figure 41
TG analysis of GO, Cl-f-GO, Cu-salen, and Cu-f-GO. Reproduced with permission from ref (264). Copyright@2022, Elsevier Ltd., Journal of Molecular Structure.
Figure 42
Figure 42
(a) FTIR spectra of Sr-G/M before and after adsorption. (b) Full XPS spectra of Sr-G/M before and after adsorption. Copyright@2022, Elsevier Ltd., Journal of Hazardous Materials.
Figure 43
Figure 43
Comet image of DNA damage to coelomocytes in E. fetida. Reproduced with permission from ref (272). Copyright@2021, Elsevier, Environmental Pollution.
Figure 44
Figure 44
Crawling assay analysis (Chem ZnO vs Green ZnO vs GO NPs). The average no. of squares crossed by larvae treated with Green ZnO is greater than that of squares crossed by larvae treated with both chemical ZnO and GO. Reproduced with permission from ref (274). Copyright@2019, Elsevier, Ltd., Toxicology Reports.
Figure 45
Figure 45
Microscopy images of GO uptake by Artemia salina in 0, 1, 10, 50, 100, and 500 mg/L of GO suspension at 48 h. Reproduced with permission from ref (275). Copyright@2018, Elsevier, Ltd., Chemosphere. Copyright@2018, Elsevier Ltd., Chemosphere.
Figure 46
Figure 46
(a) Crawling speed, (b) body weight, and (c) life span of 43 flies. Reproduced with permission from ref (276). Copyright 2022, Elsevier, Ltd., Science of The Total Environment.
Figure 47
Figure 47
Treatment with 10 μg/mL led to significant accumulation in the posterior midgut. Reproduced with permission from ref (276). Copyright 2022, Elsevier, Ltd., Science of The Total Environment.
Figure 48
Figure 48
Viability of A459 cells after being exposed to GO for 24 h. Reproduced with permission from ref (277). Copyright@2011, Elsevier, Ltd., Toxicology Letters (redrew the image from the information available).
Figure 49
Figure 49
(a) Eyeball exposed to double-distilled water for 7 days (control group). (b) Eyeball exposed to 25 μg/mL of RGO for 7 days. (c) Eyeball exposed to 50 μg/mL of RGO for 7 days. (d) Eyeball exposed to 100 μg/mL of RGO for 7 days. (e) Eyeball exposed to 25 μg/mL of GO for 7 days. (f) Eyeball exposed to 50 μg/mL of GO for 7 days. (g) Eyeball exposed to 100 μg/mL of GO for 7 days. (h) Eyeball exposed to 25 μg/mL of GO for 10 days. (i) Eye exposed to 100 μg/mL of GO for 7 days in vivo. Copyright@2018, Elsevier, Ltd., Experimental Eye Research.
Figure 50
Figure 50
Effects of GO exposure on corneal epidermal cell viability. (a) Cell viability after exposure to GO at 5 μg/mL, 20 μg/mL, and 50 μg/mL for 24 h. (b) Cell viability after exposure to GO at 5 μg/mL for 24 h, 48 h, and 72 h. Reproduced with permission from ref (278). Copyright@2018, Elsevier, Ltd., Experimental Eye Research.
Figure 51
Figure 51
Effect of GO on total cell growth of E. coli and S. aureus. Copyright@2017, Elsevier Ltd., Science of The Total Environment.
Figure 52
Figure 52
Biofilm formation after incubation with GO and rGO for 48 h of E. coli and S. aureus. Reproduced with permission from ref (279). Copyright@2022, Elsevier, Ltd., Science of The Total Environment (redrew the image from the information available).
Figure 53
Figure 53
Presence of GO in the digestive tract of C. riparius larvae exposed to 3000 μg/L for 24 h. Control (A), sGO (B), lGO (C), and mlGO (D). Reproduced with permission from ref (281). Copyright@2022, Elsevier, Ltd., Science of The Total Environment.
Figure 54
Figure 54
Presence of GO in the digestive tract of C. riparius. Control (A); 50 μg/L of sGO (B); 3000 μg/L of sGO (C); 50 μg/L of lGO (D); 3000 μg/L of lGO (E); 50 μg/L of mlGO (F); and 3000 μg/L of mlGO (G) for 96 h. Reproduced with permission from ref (281). Copyright@2022, Elsevier, Ltd., Science of The Total Environment.
Figure 55
Figure 55
SOD activities on Chironomus riparius after 50, 500, and 3000 μg/L of sGO, lGO, and mlGO (*p < 0.05, **p < 0.01). Reproduced with permission from ref (281). Copyright@2022, Elsevier, Ltd., Science of The Total Environment.
Figure 56
Figure 56
Leaf number of Lemna minor treated for 7 days with HO-GO, HU-GO, and TO-GO samples. Reproduced with permission from ref (284). Copyright@2022, Elsevier, Ltd., Chemosphere (redrew the image from the information available).
Figure 57
Figure 57
Weight change rate of E. fetida after 28 days exposure to GO. Reproduced with permission from ref (285). Copyright@2022, Elsevier, Ltd., Ecotoxicology and Environmental Safety.
Figure 58
Figure 58
Mortality of embryos at 24, 48, 72, and 96 h postfertilization (hpf). Reproduced with permission from ref (286). Copyright@2019, Elsevier, Ltd., Science of The Total Environment.
Figure 59
Figure 59
Variation of body length distance in zebrafish embryos and larvae exposed to GO at 72 and 96 h postfertilization (hpf). Reproduced with permission from ref (286). Copyright@2019, Elsevier, Ltd., Science of The Total Environment.
Figure 60
Figure 60
Effect of exposure to different concentrations (control, 1, 5, 10, 50, and 100 mg/L) of GO for 24 h of exposure. Reproduced with permission from ref (288). Copyright@2014, Elsevier, Ltd., Biomedical and Environmental Sciences.
Figure 61
Figure 61
Heart rate of zebrafish embryos at 48 hpf exposed to MWCNTs (white), GO (gray), and RGO (black) at 1 to 100 mg/L concentrations. Reproduced with permission from ref (288). Copyright@2014, Elsevier, Ltd., Biomedical and Environmental Sciences.
Figure 62
Figure 62
Effects of GO at different times on germination. Reproduced with permission from ref (289). Copyright@2015, Elsevier, Ltd., Environmental Toxicology and Pharmacology (redrew the image from the information available).
Figure 63
Figure 63
Comparison of root length in Arabidopsis thaliana seedling plants. Reproduced with permission from ref (289). Copyright@2015, Elsevier, Ltd., Environmental Toxicology and Pharmacology (redrew the image from the information available).
Figure 64
Figure 64
Dose-dependent effects of three different-sized GO (GO) particles (50–200 nm, <500 nm, and >500 nm) on zebrafish embryos and larvae after the 120 h exposure (4–124 h postfertilization). (a) Survival rate, (b) hatching rate, and (c) body length. Reproduced with permission from ref (290). Copyright@2020, Elsevier, Ltd., Ecotoxicology and Environmental Safety.
Figure 65
Figure 65
(a) Growth inhibition of five different algal cell types (C. vulgaris, S. obliquus, C. reinhardtii, M. aeruginosa, and Cyclotella sp.) exposed to 10 mg/L of GO at 24 and 96 h, respectively. (b) Content of chlorophyll a. Reproduced with permission from ref (291). Copyright@2020, Elsevier Ltd., Environmental Pollution.
Figure 66
Figure 66
Relative expression of miR-21 and miR-29a in (a) MCF-7, (b) KMBC/71, and (c) HUVEC cells. These cells were exposed to GO-100 and GQDs-50 at a concentration of 15 μg mL–1 for 4 and 24 h. Reproduced with permission from ref (292). Copyright@2020, Elsevier, Ltd., Toxicology In Vitro.
Figure 67
Figure 67
Cytotoxicity of GONWs and RGNWs to E. coli and concentrations of RNA in the PBS (phosphate buffer solution) of theE. coli bacteria exposed to the nanowalls. Reproduced with permission from ref (293). Copyright@2010, American Chemical Society, Ltd., American Chemical Society- Nano.
Figure 68
Figure 68
Cytotoxicity of GONWs and RGNWs to S. aureus and concentrations of RNA in the PBS (phosphate buffer solution) of the S. aureus bacteria exposed to the nanowalls. Reproduced with permission from ref (293). Copyright@2010, American Chemical Society, Ltd., American Chemical Society- Nano.
Figure 69
Figure 69
Ratio of the number of the active bacteria obtained from the as-prepared GOS–bacterial, the GOS–melatonin–bacterial, and and the GS–melatonin–bacterial suspensions. Reproduced with permission from ref (294). Copyright@2010, American Chemical Society, Ltd., The Journal of Physical Chemistry B.
Figure 70
Figure 70
Survival of spermatogonial cells test treated with GO and rGO. Reproduced with permission from ref (295). Copyright@2016, Elsevier, Ltd., Colloids and Surfaces B: Biointerfaces (Redrawn the figure, based on the information available).
Figure 71
Figure 71
Plotting the measurement of free radicals. Copyright@2016, Elsevier, Ltd., Colloids and Surfaces B: Biointerfaces (redrew the image from the information available).
Figure 72
Figure 72
Yeast cells were coincubated with different concentrations of GO. Reproduced with permission from ref (296). Copyright@2016, Elsevier, Ltd., Ecotoxicology and Environmental Safety (redrew the image from the information available).
Figure 73
Figure 73
Treated cells stained with PI and observed by fluorescence microscopy. Reproduced with permission from ref (296). Copyright@2016, Elsevier, Ltd., Ecotoxicology and Environmental Safety (redrew the image from the information available).
Figure 74
Figure 74
Time-dependent antibacterial activities of GO and rGO. An amount of 5 mL of GO or rGO (80 μg/mL) was incubated withE. coli (106 to 107 CFU/mL, 5 mL) for 4 h. The loss of visibility was measured at 0, 1, 2, 3, and 4 h, respectively. Reproduced with permission from ref (298). Copyright@2011, American Chemical Society, American Chemical Society- Nano (redrew the image from the information available).
Figure 75
Figure 75
Viability, motility, and progressive motility. Reproduced with permission from ref (300). Copyright@2015, Elsevier Ltd., Carbon.
Figure 76
Figure 76
mRNA gene expression of HO-1 in zebrafish after exposure to free nanoparticles and nanocomposites. The HO-1 mRNA expression was increased only in free GO treatment. Reproduced with permission from ref (301). Copyright@2017, Frontiers in Physiology (redrew the image from the information available) (open access).
Figure 77
Figure 77
Gene expression of iNOS in zebrafish after exposure to free nanoparticles and nanocomposites. The iNOS mRNA expression was increased only in free GO treatment. Reproduced with permission from ref (301). Copyright@2017, Frontiers in Physiology (redrew the image from the information available) (open access).
Figure 78
Figure 78
Cell viability histogram at different concentrations and picture of the MTT assay on the Hu02 cell line with different concentrations. Reproduced with permission from ref (303). Copyright@2020, Elsevier, Ltd., Carbohydrates Polymer (redrew the image from the information available).
Figure 79
Figure 79
Cell viability of MDA-MB-231 and SKRB3 cell lines. Reproduced with permission from ref (305). Copyright@2015, Elsevier, Ltd., Materials Science and Engineering: C.
Figure 80
Figure 80
Pro-inflammatory response induced by the five samples as determined by the production of TNF-α. Reproduced with permission from ref (306). Copyright@2021, Elsevier, Ltd., Journal of Hazardous Material.
Figure 81
Figure 81
Oxidative stress induced by the five samples as determined by ROS production after 24 h. Reproduced with permission from ref (306). Copyright@2021, Elsevier, Ltd., Journal of Hazardous Material.
Figure 82
Figure 82
Enteritidis was incubated on silver nanoparticles and GO-coated nanoplatforms after incubation at 37 °C for 24 h. Reproduced with permission from ref (307). Copyright@2019, Springer, Ltd., Nanoscale Research Letters (redrew the image from the information available).
Figure 83
Figure 83
Fibroblast (a) and HUVEC (b) viability after 24 h of incubation on the nanoplatforms was determined using a Presto Blue assay. Reproduced with permission from ref (307). Copyright@2019, Springer, Ltd., Nanoscale Research Letters (redrew the image from the information available).
Figure 84
Figure 84
Concentration of silver inside the J774 tumoral macrophage. Cells cultivated in culture bottles were exposed to 1000 μg L–1 of pristine silver nanoparticles and GO–silver nanocomposites for 24 and 48 h. Reproduced with permission from ref (308). Copyright@ 2016, Springer, Ltd., Journal of Nanobiotechnology.
Figure 85
Figure 85
Macrophage cells’ absorption and breakdown of the nanocomposite as well as the creation of oxidative stress. Reproduced with ref (308). Copyright@2016, Springer, Ltd., Journal of Nanobiotechnology.
Figure 86
Figure 86
Schematic representation for the interaction of GO with a protein.
Figure 87
Figure 87
Fluorescence emission spectra of Lyz in the presence of various concentrations of GO at different pH. Concentrations of GO are (lg/mL): 0, 4, 8, 12, 16, and 20. Lyz = 0.143 mg/mL. kex = 286 nm. Reproduced with permission from ref (312). Copyright@2021, Elsevier, Ltd., Spectrochimica Acta Part A: Molecular and Biomolecular Spectroscopy.
Figure 88
Figure 88
Fluorescence spectra of BSA in various concentrations of GO in aqueous solution (pH = 7.4) at 298 K. [BSA] = 3 × 10–6mol/L. [GO] = 0.25, 0.5, 0.75, 1.0, 1.25, 1.5, 1.75, 2.0, 2.25, and 2.5 × 10⁻⁵ mol/L. Reproduced with permission from ref (313). Copyright@2019, Elsevier, Ltd., Spectrochimica Acta Part A: Molecular and Biomolecular Spectroscopy.
Figure 89
Figure 89
Fluorescence spectra of 1:1 Trp–GO at different time intervals. Reproduced with permission from ref (315). Copyright@2020, Elsevier, Ltd., International Journal of Biological Macromolecules.
Figure 90
Figure 90
(A) Absorption spectra of pure GO (blue) and [HSA]:[GO] ratios of 4:1 (red), 10:1 (yellow), and 20:1 (purple). (B) Difference spectra of [HSA]:[GO] ratios of 4:1 (blue), 10:1 (red), and 20:1 (yellow). (C) Basis spectra obtained by SVD analysis: singular values of descending order: s1 - red, s2 - blue, and s3 - yellow, respectively. (D) Dependence of the weights (w1 - red, w2 - blue, w3 - yellow symbols) of the s1, s2, and s3 basis spectra, respectively, as a function of the [HSA]:[GO] ratio. Reproduced with permission by ref (316). Copyright@2021, Elsevier, Ltd., International Journal of Biological Macromolecules.
Figure 91
Figure 91
Three-dimensional fluorescence spectral contours of the (A) BHb, (B–D) BHb–GO system, and (E) GO. Conc. of BHb: (A) 5.0 × 10⁻⁶ mol/L, (B) 5.0 × 10⁻⁶ mol/L, (C) 5.0 × 10⁻⁶ mol/L, (D) 5.0 × 10⁻⁶ mol/L, and (E) 0.0 × 10⁻⁶ mol/L. Conc. of GO: (A) 0.00 mg/mL, (B) 0.004 mg/mL, (C) 0.010 mg/mL, (D) 0.080 mg/mL, and (E) 0.010 mg/mL. Reproduced with permission from ref (317). Copyright@2016, Elsevier, Ltd., Materials Chemistry and Physics.
Figure 92
Figure 92
Fluorescence spectra of BHb (5.0 × 10⁻⁶ mol/L) in different concentrations of GO. c(GO)/(μg/mL): 0, 2, 4, 6, 8, 10, 12, 14, 16, 18, and 20. T = 298 K, λex = 280 nm. (A) pH = 2.0, (B) pH = 7.4, and (C) pH = 11.0. Reproduced with permission from ref (317). Copyright@2016, Elsevier, Ltd., Materials Chemistry and Physics.
Figure 93
Figure 93
Viability of cells. Reproduced with permission from ref (319). Copyright@2014, Elsevier Ltd., Applied Surface Science (redrew the image from the information available).

References

    1. Lee C.; Wei X.; Kysar J. W.; Hone J. Measurement of the Elastic Properties and Intrinsic Strength of Monolayer Graphene. Science 2008, 321 (5887), 385–388. 10.1126/science.1157996. - DOI - PubMed
    1. Eftekhari A.; Jafarkhani P. Curly Graphene with Specious Interlayers Displaying Superior Capacity for Hydrogen Storage. J. Phys. Chem. C 2013, 117 (48), 25845–25851. 10.1021/jp410044v. - DOI
    1. Ullah S.; Denis P. A.; Menezes M. G.; Sato F. Tunable and Sizeable Band Gaps in Strained SiC3/HBN VdW Heterostructures: A Potential Replacement for Graphene in Future Nanoelectronics. Comput. Mater. Sci. 2021, 188, 110233. 10.1016/j.commatsci.2020.110233. - DOI
    1. Yousuf S.; Siddique H. R.; Arjmand F.; Tabassum S. Functionalized Graphene Oxide Loaded GATPT as Rationally Designed Vehicle for Cancer-Targeted Drug Delivery. J. Drug Deliv. Sci. Technol. 2022, 71, 103281. 10.1016/j.jddst.2022.103281. - DOI
    1. Chen Z.; Luo Y.; Huang C.; Shen X. In Situ Assembly of ZnO/Graphene Oxide on Synthetic Molecular Receptors: Towards Selective Photoreduction of Cr(VI) via Interfacial Synergistic Catalysis. Chem. Eng. J. 2021, 414, 128914. 10.1016/j.cej.2021.128914. - DOI

LinkOut - more resources