. 2022 Sep 26;17(1):1282-1295.
doi: 10.1515/biol-2022-0478. eCollection 2022.

Preclinical immunogenicity assessment of a cell-based inactivated whole-virion H5N1 influenza vaccine

Affiliations

Preclinical immunogenicity assessment of a cell-based inactivated whole-virion H5N1 influenza vaccine

Zhegang Zhang et al. Open Life Sci. .

Abstract

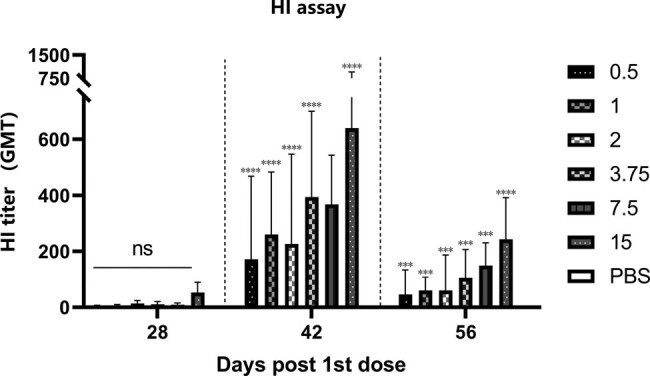
In influenza vaccine development, Madin-Darby canine kidney (MDCK) cells provide multiple advantages, including large-scale production and egg independence. Several cell-based influenza vaccines have been approved worldwide. We cultured H5N1 virus in a serum-free MDCK cell suspension. The harvested virus was manufactured into vaccines after inactivation and purification. The vaccine effectiveness was assessed in the Wuhan Institute of Biological Products BSL2 facility. The pre- and postvaccination mouse serum titers were determined using the microneutralization and hemagglutination inhibition tests. The immunological responses induced by vaccine were investigated using immunological cell classification, cytokine expression quantification, and immunoglobulin G (IgG) subtype classification. The protective effect of the vaccine in mice was evaluated using challenge test. Antibodies against H5N1 in rats lasted up to 8 months after the first dose. Compared with those of the placebo group, the serum titer of vaccinated mice increased significantly, Th1 and Th2 cells were activated, and CD8+ T cells were activated in two dose groups. Furthermore, the challenge test showed that vaccination reduced the clinical symptoms and virus titer in the lungs of mice after challenge, indicating a superior immunological response. Notably, early after vaccination, considerably increased interferon-inducible protein-10 (IP-10) levels were found, indicating improved vaccine-induced innate immunity. However, IP-10 is an adverse event marker, which is a cause for concern. Overall, in the case of an outbreak, the whole-virion H5N1 vaccine should provide protection.

Keywords: H5N1; MDCK cells; cellular immune response; humoral immune response; vaccine.


Conflict of interest statement

Conflict of interest: Authors state no conflict of interest.

Figures

Figure 1
Figure 1
Rats were boosted on day 28. The serum collected after vaccination was used in HI assay. Rats vaccinated with 2–15 μg HA induced strong neutralization antibody responses. Vaccine containing 2 μg HA induced high level antibody in rats for at least 6 months. Statistical analysis was performed using a two-way ANOVA.
Figure 2
Figure 2
Mouse were boosted on day 28. The serum collected after vaccination was used in HI assay. There is no change in neutralization antibody after first dose. The antibody increased significantly 14 days after boost and decreased significantly 28 days after boost. Vaccine containing 15 μg HA induced highest GMT during the immunization.
Figure 3
Figure 3
The serum used in microneutralization test were the same as in HI assay. The antibody increased significantly after immunization. There was a decrease in antibody levels, but not as significant as in HI assay.
Figure 4
Figure 4
(a) After the first dose, the activated CD8+ T cells were significantly enhanced in the spleen of the mice. The CD8+ T cells were also significantly activated (lower than the 1 ug and 15 ug groups) in the PBS group after boost. All CD8+ T cells decreased to no significant difference in day 56. (b) The differences in CD4+ T cells of splenocytes were not significant at day 28, 32, and 56.
Figure 5
Figure 5
(a) The ratio of IgG2a/IgG1 decreased after boost. The immune response tended to the Th2 direction. This balance remained until day 56. (b and c) There is an antagonism between the Th1 and Th2, both of which showed a significant increase at day 42 after immunization. Both Th1 and Th2 began to exert immune function.
Figure 6
Figure 6
On day 28, IL-2 levels in all vaccine groups (except for 7.5 μg) were significantly higher than those in the placebo group. After booster administration, IL-2 levels in all vaccine groups began to decline on day 32, and there was no difference between the vaccine groups and the placebo group on day 56 (a). IL-4 levels increased significantly on day 32 and declined to the level of the placebo group on day 56, except for those in the 7.5 and 15 μg groups (b). IL-5 levels in the vaccine groups were not different from those in the placebo group on day 28; those in the 7.5 and 15 μg groups were even lower. On day 32, IL-5 levels in the 0.5, 2, 3.75, and 7.5 μg groups were significantly increased compared with those in the placebo group, and on day 56, IL-5 levels in all vaccine groups declined to the level of the placebo group (c). There was no difference in IL-6 levels between the vaccine groups and the placebo group on day 28, but there was a significant increase in IL-6 levels in all vaccine groups on day 32, except for the placebo group. IL-6 levels decreased in all groups on day 56 and were still higher than those in the placebo group (d). IL-9 levels did not change significantly during the immunization period except at a dose of 3.75 μg (e). On day 32, IL-10 levels were significantly increased in all vaccine groups. IL-10 levels decreased in all vaccine groups on day 56 and were still higher than those in the placebo group (f). IL-13 levels increased significantly on day 32 and continuously increased until day 56, but there was no difference between the 15 μg and placebo groups (g). Significant changes in IL-22 were observed at day 28, but gradually decreased with time delay to no significant changes in the placebo group (h). At day 28, there was no significant difference in each group, but IL-17A levels increased after booster administration (j). IL-17F levels did not change significantly during the entire immunization process (i). There was no significant difference in IFN-γ levels between the vaccine groups and the placebo group on day 32 (except for the 0.5 dose group). IFN-γ levels in each dose group were significantly higher than those in the placebo group on days 28 and 56 (l). TNF-α levels in the placebo group were significantly decreased on day 28 and remained stable until day 56, while TNF-α levels in all dose groups were significantly increased at day 56 (k).
Figure 7
Figure 7
The placebo group began to lose weight at day 4 PC, with the most significant weight loss at day 7 PC (a). Body temperature of the vaccinated group began to rise up to 38.6°C on day 4 PC (b).
Figure 8
Figure 8
On day 8 PC, few lung lesions in the mice were discovered in the vaccine group, and there were no significant abnormalities in tissues (1A/1B/2A/2B). The alveolar wall was slightly thickened, along with a small amount of granulocyte infiltration (blue arrow) (3A/3B). Significant lesions appeared in the lungs of mice in the placebo group, and it was more common for lymphocytes to show focal infiltration around the blood vessels (blue arrow). Inflammatory cell infiltration was noted in a small number of alveolar cavities (green arrow). Due to local bleeding, red blood cells are visible in the alveolar cavity (yellow arrow) (1C/1D). The alveolar wall was slightly thickened, along with a small amount of granulocyte infiltration (blue arrow) (2C/2D). It was more common that congestion was seen in the blood vessels (yellow arrow). The alveolar wall was slightly thickened, along with a small amount of granulocyte infiltration (blue arrow) (3C/3D). On day 11 PC, lesions also developed in the lungs of mice in the vaccine group. There were multiple congestion sites in blood vessels and alveolar wall capillaries (yellow arrow). Few perivascular lymphocytes showed focal infiltration (blue arrow) (1E/1F). A large area of the alveolar wall was moderately thickened with a small amount of granulocyte infiltration (blue arrow) (2E/2F). Few perivascular lymphocytes showed small focal infiltrates (blue arrow) (3E/3F). However, more severe lesions were observed on day 11 PC in the placebo group, with multiple congested sites in the blood vessels and alveolar wall capillaries (yellow arrow). There were perivascular edema and loose connective tissue, accompanied by a small amount of lymphocyte infiltration (purple arrow) (1G/1H). A large area of alveolar wall was severely thickened, with a small amount of granulocyte infiltration (blue arrow). Inflammatory cells showed diffuse infiltration in multiple alveolar cavities (green arrow). It was more common that perivascular lymphocytes showed focal infiltration (purple arrow) (2G/2H). There was a large area of tissue necrosis (red arrow), with structural disorder. It was more common that eosinophilic homogenates appeared in the alveolar cavities (green arrow), surrounded and accompanied by a small amount of inflammatory cell infiltration. Inflammatory cell infiltration was seen in multiple alveolar cavities (blue arrow). There were perivascular edema and loose connective tissue, with a small amount of lymphocyte infiltration (purple arrow) (3G/3H). No significant abnormalities were found in the lung tissue of mice in the blank group (1I/1J/2I/2J).
Figure 9
Figure 9
Each image is divided into two parts (left and right). The left part is an image selected from the immunohistochemical slices using a histologic section digital scanner, while the right part is an automatically analyzed left image by Image Analysis System (Servicebio, China). The nuclei are blue and the proteins of H5N1 virus are brownish yellow or dark brown. The positive cell ratio, mean density, histochemistry score, and positive score were calculated.
Figure 10
Figure 10
PBS (1 mg:1 mL) was added according to the mass of the lungs. The milled tissue fluid was stored at −80°C after centrifugation. Viral titer testing was performed concurrently after the last sampling. The CCID50 results showed that the viral load in the lung was significantly higher in the placebo group than vaccine group.
Figure 11
Figure 11
The time for blood sampling was at 0, 3, 6, 12, 24, and 48 h after injection (n ≥ 5 per time point). IP-10 appeared to have significant changes at 6 h after injection and reached the peak at 12 h. Then, it dropped to a normal level in 12 h.

Similar articles

References

    1. Choi A, Garcia-Sastre A, Schotsaert M. Host immune response-inspired development of the influenza vaccine. Ann Allergy Asthma Immunol. 2020;125:28–35. - PMC - PubMed
    1. Chan PK. Outbreak of avian influenza A(H5N1) virus infection in Hong Kong in 1997. Clin Infect Dis. 2002;34(Suppl 2):S58–64. - PubMed
    1. Hui DS. Review of clinical symptoms and spectrum in humans with influenza A/H5N1 infection. Respirology. 2008;13(Suppl 1):S10–3. - PubMed
    1. Duong TN, Thiem VD, Anh DD, Cuong NP, Thang TC, Huong VM, et al. A Phase 2/3 double blinded, randomized, placebo-controlled study in healthy adult participants in Vietnam to examine the safety and immunogenicity of an inactivated whole virion, alum adjuvanted, A(H5N1) influenza vaccine (IVACFLU-A/H5N1). Vaccine. 2020;38(6):1541–50. - PubMed
    1. Sabarth N, Savidis-Dacho H, Schwendinger MG, Brühl P, Portsmouth D, Crowe BA, et al. A cell culture-derived whole-virus H5N1 vaccine induces long-lasting cross-clade protective immunity in mice which is augmented by a homologous or heterologous booster vaccination. Vaccine. 2012;30(37):5533–40. - PubMed

LinkOut - more resources